

Abstract
The Arctic climate system exhibits dramatic changes in autumn, yet its connection to the tropics remains unclear. This study leverages inter-basin/region teleconnectivity (IB(R)T) analysis to unveil the key teleconnected regions responsible for the connection between autumn Arctic temperature and tropical sea surface temperature (SST). A robust positive correlation is identified between North American Arctic (NAA) temperatures and North Tropical Atlantic (NTA) SST, with the NTA SST leading by one season. Observational evidence reveals that western Pacific (WP) subtropical high (WPSH) and SST play an intermediary role in this cross-seasonal tropical-Arctic connection. Summertime NTA warming triggers an intensification of the WPSH, subsequently inducing autumnal warming of WP SST via inter-basin interactions. This intensified WP convection generates a Rossby wave train propagating from the Northern WP eastward towards the NAA, ultimately leading to an anomalous high over the NAA. The increased atmospheric thickness and air temperature enhances downward longwave radiation, further contributing to surface warming over the NAA. The linear baroclinic model experiments, forced with thermal anomalies corresponding to WP SST warming, successfully reproduce the observed atmospheric circulation response and the associated air temperature changes over the NAA. Our findings provide insights into the role of inter-basin connections in Tropical-Arctic linkages.

Original content from this work may be used under the terms of the Creative Commons Attribution 4.0 license. Any further distribution of this work must maintain attribution to the author(s) and the title of the work, journal citation and DOI.
1. Introduction
The Arctic has experienced amplified warming in recent decades, with a rate approximately twice to four times as fast as the global average, a phenomenon known as Arctic amplification [1, 2]. Arctic amplification is mainly due to sea ice loss and increased atmospheric humidity, alongside oceanic and atmospheric heat transport [3–5]. It is noteworthy that the rate of Arctic sea ice reduction is particularly pronounced in autumn, which is also the season of most rapid warming in the Arctic [3, 6]. Recent studies have shown that the synergistic action of multiple large-scale circulations is an important cause of recent Arctic autumn warming [7]. Strengthening research on Arctic autumn warming is crucial for understanding the overall pattern of Arctic climate change and assessing its impact on the global climate system.
Recent scientific research has increasingly focused on the relationship between Arctic climate change and mid-latitude climate. Rapid Arctic warming is driving changes in midlatitude climate and weather patterns in the Northern Hemisphere [8, 9]. Recent observations of winter temperature trends across major continents in the Northern Hemisphere reveal a pattern of warm Arctic-cold Eurasia (WACE) [10, 11]. The WACE pattern is primarily attributed to the negative phase of the North Atlantic oscillation (NAO) or Arctic oscillation (AO) induced by Arctic warming [12, 13]. The intensification of Arctic warming intensifies meridional atmospheric circulation, amplifies planetary waves, and weakens the stratospheric polar vortex [14–16], leading to more frequent extreme weather events like summer precipitation extremes, droughts, and heatwaves [17–19]. However, research on the connection between the Arctic and the tropics remains relatively limited. Previous studies have shown that warming in the tropical oceans may contribute to Arctic warming through oceanic and atmospheric pathways [20, 21]. These studies primarily focus on interannual and decadal variations in Arctic temperature. However, research exploring the linkage between Arctic warming in autumn and the tropics is still relatively scarce.
The ocean basins are tightly interconnected via complex air-sea interactions. Inter-basin interactions have emerged as a frontier and hotspot in geoscientific research, while most studies have focused on the impacts on the surrounding tropical and subtropical climates. ENSO and the Tropical Atlantic interact and influence surrounding climates through various inter-basin atmospheric teleconnections [22–24]. It has also been demonstrated that the Northeast Pacific sea surface temperature (SST) anomalies propagates to the tropical Pacific through seasonal foot printing Mechanism and subsequently induces anomalous SST in the Atlantic warm pool through subtropical atmospheric teleconnections [25]. In addition, anomalous warm SST in the tropical Atlantic triggers anomalous low-level anticyclones in the western Pacific (WP), thereby strengthening the western North Pacific subtropical high (WNPSH) [26]. However, inter-basin interactions in Arctic climate change remain largely unexplored. Therefore, the role of inter-basin connections in Arctic climate change deserves further investigation.
Unveiling the intricate linkages between geographically distinct regions, such as the tropics and the Arctic, or across basins, demands robust analytical approaches. Wallace and Gutzler pioneered a powerful method to systematically identify atmospheric teleconnections by analyzing the correlation matrix for all possible grid point pairs within the data. This technique effectively captures the structure and strength of key teleconnection patterns within the northern extratropical region [27]. While this method has proven valuable, it is constrained by the defined region and the inherent autocorrelation of data within that region, limiting its ability to detect positive teleconnections spanning multiple regions. To address this limitation, Han and Li [28] extended the method to identify both positive and negative teleconnections across diverse regions. Their approach has been successfully applied to inter-basin interactions, offering a versatile tool for exploring teleconnections between disparate regions. However, its application to the Tropical-Arctic connection remains relatively unexplored. In this study, we employ this method to identify the teleconnection relationship between the autumn Arctic temperatures and the tropical SST. We further explore the underlying physical processes and mechanisms governing this teleconnection, aiming to provide a comprehensive analysis and deeper understanding of this crucial linkage.
2. Data and methodology
2.1. Data and definitions of climate indices
In this study, the surface temperature data are derived from the Met Office Hadley Centre/Climatic Research Unit global surface temperature anomalies, version 5 (HadCRUT5) [29]. The SST data are derived from extended reconstructed SST version 5 (ERSSTv5) [30] and the Hadley Centre SST dataset (HadSST4) [31]. The atmospheric data including geopotential height, radiation, temperature, surface pressure, atmospheric wind fields are derived from the European Centre for Medium-Range Weather Forecasts reanalysis, version 5 (ERA5) [32]. The monthly mean outgoing longwave radiation (OLR) data is derived from National Oceanic and Atmospheric Administration (NOAA) [33]. All data are employed and analyzed for the period 1980–2020. Based on the spatial pattern of the strongest positive correlation between Arctic temperatures in autumn and tropical SST in summer (figure 1), we define a series of indices (see details in table S1 in the supplementary material).

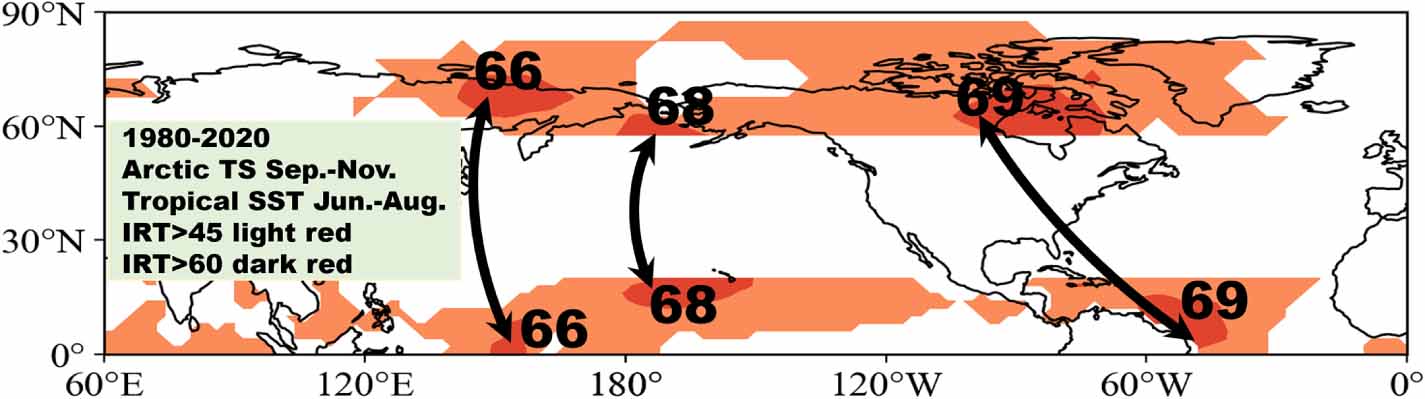
Figure 1. (a) Inter-region strongest positive correlation IBRTa on each one-point detrended correlation map, plotted at the base grid point (referred as 'teleconnectivity') for autumn (September—November) near surface temperature anomalies (HadCRUT5) (55° N‒90° N) and summer (June—August) SST anomalies (ERSSTv5) (0° ‒20° N) during 1980‒2020. Negative signs have been omitted and correlation coefficients multiplied by 100. Regions where IBRTa⩽ 45 are unshaded; 45 IBRTa ⩽ 60 are shaded lightly; 60 < IBRTa are shaded heavily. Arrows connect centers of strongest teleconnectivity with the grid point which exhibits the strongest positive correlation on their respective cross-set one-point correlation maps.
Download figure:
Standard image High-resolution image2.2. Methods and model experiment
To study the teleconnection between Arctic and Tropical oceans, we use the recently proposed inter-basin/region teleconnectivity (IB(R)T) analysis method [27, 28]. We employed the perturbation hypsometric equation proposed by Li et al [34] to explain the correspondence between changes in geopotential height and tropospheric temperature. To investigate the propagation characteristics of teleconnected wave trains impacting the North American Arctic (NAA), we use the wave activity flux and Rossby wave ray tracing. The wave activity flux is parallel to the group velocity of stationary Rossby waves, and thus is a good indicator for the propagation direction and source of stationary Rossby waves in the atmosphere [35]. The Rossby wave ray tracing method analyzes the ratio between zonal and meridional group velocities to numerically compute the trajectory, or path, of the wave ray [36, 37]. All the equations and detailed algorithms are provided in the supplementary material. To investigate the physical mechanisms underlying the teleconnection pattern, we employ the linear baroclinic model (LBM) to examine the atmospheric response to thermal forcing associated with WP SST anomalies. The LBM, which linearizes primitive equations about a specified basic state, provides an effective tool for isolating the atmospheric response to prescribed thermal forcing (figure S1). Detailed information about the LBM configuration and experimental design is provided in the supplementary material.
Common statistical methods such as regression analysis, correlation analysis, and partial correlation analysis are used in this study. Since the data used in this paper are all monthly data, the significance test of the correlation coefficient used is the t-test with effective degrees of freedom. Detailed algorithms are provided in the supplementary material.
3. Results
3.1. The identification of NAA-North Tropical Atlantic (NTA) teleconnection
Based on the IB(R)T analysis, we identify the most robust teleconnection pattern between autumn Arctic and tropical oceans. This study focuses on the strong positive correlation between autumn Arctic temperatures and tropical SST. As shown in figure 1, the regions exhibiting the strongest correlation between autumn Arctic temperatures and tropical SST are the NAA and the NTA, with the NTA SST leading by one season. Consequently, we define boxes in the NAA (60° N‒75° N, 110° W‒70° W) and NTA (0‒20° N, 80° W‒30° W) regions, respectively. We further calculate the summer NTA SST and autumn NAA temperatures normalized time series for the period of 1980–2020 derived from the ERSSTv5 data and HadCRUT5 data, respectively (figure 2(a)). High correlation coefficients are observed between the NTA SST and NAA temperatures indices (r = 0.72, p < 0.05), and remains strong even after removal of the linear trend (r = 0.61, p < 0.05). Figure 2(b) shows the spatial correlation pattern map between summer NTA SST and autumn NAA temperature. Significant strong positive correlations are observed over the NAA and NTA, respectively. The robustness of this correlation is further validated by the significant positive correlations observed in other datasets (supplementary figures 2 and 3), indicating that the results are not sensitive to the exact choice of dataset. Additionally, supplementary figure 4 demonstrates that the correlation coefficients between summer NTA SST and autumn NAA temperatures is the strongest compared to other seasonal combinations, further confirming that autumn NAA temperature is strongly linked to NTA SST in summer.

Figure 2. (a) The detrended normalize time series of NAA temperature anomaly index and NTA SST index during 1980–2020. The detrended correlation map of the SON NAA (green box: 60° N–75° N, 110° W–70° W) temperature anomaly index with (b) JJA SST. The detrended correlation map of the JJA NTA (green box: 0°–20° N, 80° W–30° W) SST index with (b) SON temperature anomaly. Areas significant at the 95% confidence level are denoted by dots.
Download figure:
Standard image High-resolution imageWhile NTA SST appears to be a critical driver of NAA temperature changes, previous studies have also highlighted the crucial roles of the NAO and AO in modulating Arctic climate variability [38, 39]. We find that the autumn NAA temperature index exhibits significant negative correlations with the NAO index (r = −0.43, p < 0.05) and the AO index (r = −0.28, p < 0.05). Employing partial correlation analysis to isolate the influence of NAO and AO separately, the correlation coefficients between the summer NTA SST index and the autumn NAA temperature index are 0.74 and 0.75, respectively. ENSO exerts a significant influence on global climate [40, 41]. The correlation coefficient of the previous winter and autumn Niño3.4 index with the autumn NAA temperature index are 0.29 and −0.3, respectively. The partial correlation coefficient between the summer NTA SST index and autumn NAA temperature index after removing the influence of ENSO is 0.68. These results demonstrate robust cross-regional and cross-seasonal associations between NAA and NTA, independent of NAO, AO, and ENSO. Further investigations into the underlying physical processes and mechanisms driving the NAA-NTA teleconnection are warranted.
3.2. Atmospheric and oceanic processes associated with NTA
The preceding analysis reveals a robust teleconnection between autumn NAA temperatures and summer NTA SST during the analysis period 1980–2020. In this section, we analyze the atmospheric circulation anomalies associated with autumn NAA temperatures and illustrate their role in bridging the link between NTA SST and NAA temperatures. Atmospheric data employed in the subsequent analysis are derived from ERA5 reanalysis.
3.2.1. Atmospheric circulation patterns
We analyze the impact of the summer NTA SST on the autumn atmospheric circulation and how it contributes to regional atmospheric circulation pattern that favors NAA temperature anomalies. As shown in figure 3(a), the regression map between the summer NTA SST index and the autumn 200 hPa horizontal wave activity flux reveals a clear large-scale Rossby wave train pattern with alternating positive and negative anomalies propagating from the tropical Pacific into the NAA. The horizontal stream function is calculated from the geopotential height (equation (9) in supplementary material). The presence of positive anomalous stream function over the NAA implies that the geopotential height over the NAA is elevated. Figure 3(b) displays the spatial regression of near-surface temperature (shading) and 1000–200 hPa atmospheric thickness (contours) onto the summer NTA SST index. Significant positive anomalies in both atmospheric thickness and temperature are evident over the NAA, both significant at the 95% confidence level. The increased 1000–200 hPa atmospheric thickness over the NAA corresponds to adiabatic expansion of the air column. The increased atmospheric thickness is reflecting an increase in tropospheric air temperature. Figure 3(c) shows the spatial regression of downward longwave radiation onto the summer NTA SST index, revealing a clear positive anomaly over the NAA. This implies that the increased geopotential height and tropospheric air temperature contribute to strengthening downward longwave radiation over the NAA, with a consequent increase in surface temperature. We also examine the contributions of other surface fluxes and temperature advection. It is found that their contributions to the NAA temperature increase are small and localized. This further suggests that downward longwave radiation plays an important role in the near-surface warming of the NAA.

Figure 3. Regressions of the (a) SON 200 hPa horizontal stream function anomalies (shading, units: m2 s−1) and wave activity flux (vector, units: m2 s−2), (b) SON near surface temperature (shading, units: K) and atmospheric thickness (contours) from 1000 hPa to 200 hPa, and (c) SON downward (positive) longwave radiation (shading, units: W m−2) with respect to the JJA NTA SST index during 1980–2020. Areas significant at the 95% confidence level are denoted by dots.
Download figure:
Standard image High-resolution imageThe wave activity flux represents the direction of energy dispersion. The divergence region of the wave activity flux corresponds to the wave source. As shown in figure 3(a), the existence of wave activity flux divergence in the WP region, along with the direction of the vector arrows, indicates that the large Rossby wave train may be originated from the WP region. With the vector arrows pointing, the waves originating from the WP propagate in a northeasterly direction to the NAA, with positive anomalies in the height of the potential in the central North Pacific Ocean and the NAA, and negative anomalies in the Gulf of Alaska. The wavelength of this wave train is approximately 90°–120° longitude, corresponding to a zonal wave number of 3–4. To better characterize this North Pacific to Arctic wave pattern, then we define a North Pacific- Arctic Wave (NPAW) index (defined as the difference between the sum of the average geopotential height of two positive centers (located at 60° N–75° N, 90° W–50° W and 30° N–45° N, 180° W–160° W) and the average geopotential height of a negative center (located at 45° N–60° N, 150° W–130° W), supplementary figure 5) and analyze its relationship with SST and air temperature, respectively. As expected, the NPAW is strongly correlated with the NAA temperatures and NTA SST (figure 4). Thus, the zonal wave train over the North Pacific links the NTA to the NAA. It is noted that the high-pressure anomaly over the NAA is indeed pronounced. Previous studies have demonstrated that the Arctic region commonly experiences positive feedback processes and local amplification effects [42]. The strengthening of anticyclonic circulations, contribute to increased downwelling longwave radiation and near-surface warming. This warming further elevates geopotential heights [43, 44], which in turn intensify the surface warming, creating a positive feedback loop that strengthens the high-pressure center over the NAA. These feedback processes are crucial in explaining the anomalous strengthening of the high-pressure anticyclonic activity center in the NAA.

Figure 4. (a) The detrended correlation map of the SON NPAW index with SON near surface temperature. The detrended correlation map of the SON NPAW index with (b) JJA SST and (c) SON SST. Areas significant at the 95% confidence level are denoted by dots. Green boxes indicate NAA (60° N–75° N, 110° W–70° W), WP (0°–20° N, 130° E–150° E) and NTA (0°–20° N, 80° W–30° W) regions. Areas significant at the 95% confidence level are denoted by dots.
Download figure:
Standard image High-resolution imageIt is critical to analyze how NTA SST forces this inter-basin Rossby wave train over the North Pacific. As shown in figures 4(b) and (c), the autumn NPAW index indeed shows a strong positive correlation with summer NTA SST, and it is noteworthy that the autumn NPAW index also exhibits a significant positive (negative) correlation with WP (central-eastern Pacific) SST during the same period. Correlation analysis reveals significant positive correlations of autumn WP SST and NPAW teleconnection with the SON NAA temperature index, reaching up to 0.65 and 0.61, respectively. While the relationship between central-eastern Pacific (–5° S‒10° N, 170° W‒120° W) SST and NPAW and NAA temperature is weak (–0.39 and −0.31, respectively). This emphasizes the role of WP SST warming in modulating NPAW activity and its subsequent impact on NAA temperatures. Recent studies have highlighted strong inter-basin interactions between the Atlantic and Pacific in the tropical regions [45, 46]. Therefore, we hypothesize that the WP SST anomalies may act as an intermediary bridge connecting NTA SST and NAA temperatures. Further research should investigate the WP–NTA connection and its role in the NTA–NAA teleconnection.
3.2.2. Atlantic-Pacific inter-basin connection
The preceding findings suggest that the WP SST may act as an intermediary bridge connecting NTA SST and NAA temperatures. We now explore in depth underlying physical process of the NTA-WP inter-basin connection. We begin by examining the differences in summer and autumn atmospheric circulation anomalies patterns associated with summer NTA SST. As depicted in figure 5, atmospheric circulation anomalies associated with the summer NTA SST differ significantly between summer and autumn. In summer, anomalous warming of NTA SST induces anomalous easterly winds over the tropical Pacific and anomalous low-level anticyclonic over the WP, triggering an intensification of the Western Pacific subtropical high (WPSH) (figure 5(a)). The NPAW train structure associated with summer NTA SST is more pronounced in autumn compared to summer, and the NAA temperature anomalies are clearly linked to the autumn atmospheric circulation anomalies (figures 5(c)–(f)). This further corroborates the connection between summer NTA SST and autumn NAA temperatures. By contrasting the summer and autumn atmospheric circulation anomaly fields, it can be observed that the spatial pattern of atmospheric circulation anomalies associated with summer NTA SST over the North Pacific undergoes substantial changes, while the pattern of atmospheric circulation anomalies over the North Atlantic remains relatively consistent (figure 5). This may be attributed to Pacific SST variability. Additionally, the wave train structure and wave activity flux analysis suggest that the wave train propagating from the North Pacific to the NAA may be originated from Pacific.

Figure 5. Regressions of the sea level pressure (shading, units: hPa) and 850 hPa wind anomalies (vector, units: m s−1) with respect to the JJA NTA SST index during 1980–2020 for (a) JJA and (b) SON. (c)–(f) As in (a)-(b) but for regressions of 500 hPa and 200 hPa geopotential height and wind anomalies. Areas significant at the 95% confidence level are denoted by dots.
Download figure:
Standard image High-resolution imagePrevious studies have indicated that NTA SST induces changes in tropical Pacific SST anomalies via various inter-basin interactions [47, 48]. Therefore, we further analyze the relationship between the NTA SST and the tropical Pacific SST. As depicted in figures 6(a) and (b), the detrended spatial correlation of the summer NTA SST index with summer and autumn SST reveals a positive correlation over the WP, which becomes stronger in autumn, and a negative correlation over the central-eastern Pacific. We further examine the summer and autumn upper troposphere convergence and divergence anomalies associated with summer NTA SST warming. During summer, the upper-level velocity potential shows a strong divergence anomaly over the tropical Atlantic, corresponding to the rising motion generated by the warm NTA SST anomaly, while the entire Pacific region shows strong convergent anomalies (figures 6(c) and (e)). Correspondingly, anomalous cyclonic activity occurs over the North Atlantic, while anomalous low-level anticyclonic activity over the WP triggers an intensification of the WPSH (figure 5(a)). During autumn, the remote atmospheric pattern over the Pacific basin response to NTA SST warming shows a zonal dipole structure, with negative anomalies in upper-level velocity potential and OLR over the WP (indicating anomalous ascending motion), and positive anomalies over the central-eastern Pacific (indicating anomalous descending motion) (figures 6(d) and (f)).
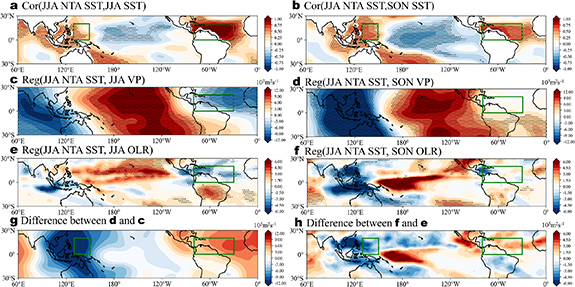
Figure 6. The detrended correlation map of the JJA NTA SST index with (a) JJA SST and (b) SON SST. Regression of the 200 hPa velocity potential (shading, units: 105 m2s−1) with respect to the JJA NTA SST index during 1980–2020 for (c) JJA and (d) SON. Regression of the outgoing longwave radiation (shading, units: W m−2) with respect to the JJA NTA SST index during 1980–2020 for (e) JJA and (f) SON. (g) The difference between (d) and (c). (h) The difference between (f) and (e). Green boxes indicate WP (0°–20° N, 130° E–150° E) and NTA (0°–20° N, 80° W–30° W) regions. Areas significant at the 95% confidence level are denoted by dots.
Download figure:
Standard image High-resolution imageNotably, the central-eastern Pacific experiences strong convergence and subsidence in both summer and autumn. In contrast, the WP region exhibits stronger divergence and upward motion in autumn (figures 6(g) and (h)). This difference in velocity potential is associated with the anomalous autumn warming of the WP SST due to the intensified WPSH. The WP SST exhibits anomalous warming in autumn compared to summer. Consequently, convection intensifies over the WP in autumn, leading to reduced OLR. Consistent with our findings, previous studies have also shown that North Atlantic SST warming induces WP SST warming. Sun et al [49] found that North Atlantic SST warming triggers anomalous warm SST in the WP via the subtropical North Pacific ocean-atmosphere coupling bridge. Additionally, other study indicates that Atlantic warming induces anomalous easterly winds over the Indian-WP region, and the wind changes further induce warming in the Indian-WP through the wind-evaporation-SST feedback [47]. SST anomalies in the central-eastern Pacific may also affect the WP SST [50, 51], and we investigate the contribution of central-eastern Pacific SST anomalies to the variability of autumn WP SST and compare it with the influence of the tropical Atlantic. The WP SST variability is primarily influenced by the NTA SST, explaining 49.6% of its variance, with a strong positive correlation (r = 0.7, p < 0.05) between SON WP SST and JJA NTA SST. The central-eastern Pacific SST also affects WP SST variability, explaining 27% of it, but its influence is weaker (r = −0.52, p < 0.05). Even when the effect of central-eastern Pacific SST is excluded, the robust relationship between NTA SST and WP SST remains significant (r = 0.62, p < 0.05). This suggests that the NTA SST plays a dominant and robust role in influencing the WP SST variability, while the tropical central-eastern Pacific plays a secondary role. To sum up, summer NTA SST triggers an intensification of the WPSH, subsequently inducing autumnal warming of WP SST via inter-basin interactions. The NTA-related WP warming enhances autumnal convective activity, favoring the generation of northeastward-propagating Rossby wave train reaching the NAA region.
3.3. Modeling evidence for the NAA–NTA connection
The preceding analysis reveals a robust teleconnection between NTA SST and NAA temperatures. To further validate the causal relationship between WP thermal forcing and the atmospheric circulation response over the NAA, we perform numerical experiments using the LBM. The model is forced with a prescribed thermal forcing pattern representing the heating over WP. The spatial configuration of this forcing, including both its horizontal distribution and vertical structure, is illustrated in figure S1.
Figure 7 shows the response of the extratropical Northern Hemisphere atmosphere to WP SST heating forcing, as simulated by the LBM. As shown in figure 7(a), the presence of wave activity flux divergence in the WP region indicates that the wave source is located in the WP region. The model also effectively simulates the teleconnection patterns' structure and pathway. The Z500 responses display a Rossby wave train pattern originating from the WP, propagating towards NAA, which accurately captures wave trains aligning with observational data, with spatial correlation coefficients between observed and modeled stream function anomalies of 0.5 for the NPAW region. Figure 7(b) also displays positive temperature anomalies at 850 hPa and positive geopotential height anomalies at 200 hPa over the NAA in response to WP SST heating forcing. These anomalies suggest that the anomalous high geopotential height over the NAA leads to increased atmospheric thickness, which in turn corresponds to warming in the troposphere and contributes to surface temperature rise, consistent with observations. Therefore, the LBM experiment reproduces the observed anomalous atmospheric circulation patterns to a large extent. Model simulations further confirm that the NTA-related anomalous WP SST warming triggers an autumn teleconnection pattern, leading to high-pressure anomalies over the NAA and subsequent lower-tropospheric warming through adiabatic processes.

Figure 7. (a) The results of LBM simulated SON 500 hPa horizontal stream function anomalies (shading, units: m2 s−1) and wave flux (vector, units: m2 s−2) response to the heat forcing over the WP region. (b) As in (a) but for SON atmospheric 850 hPa temperature (shading, units: K) and 200 hPa geopotential height (contour, units: m) response.
Download figure:
Standard image High-resolution imageRossby wave ray tracing theory offers a complementary approach to further characterize the propagation paths and energy dispersion characteristics of Rossby waves. Over the tropical oceans, anomalous SST changes can induce deep atmospheric convection. This enhanced convection can drive anomalous divergence in the upper troposphere of the subtropics, perturbing the subtropical circulation. The Rossby wave sources (RWS) associated with this strong convective activity typically occur near the subtropics around 30 degrees latitude [52, 53]. Prior studies have established a link between RWS locations and the magnitude of the absolute vorticity gradient, which is often found near strong jet streams [54]. We analyze the Northern Hemisphere RWSs during autumn (figure S6), and significant RWSs are found in the subtropical region. Additionally, in the WP region, these sources are concentrated in East Asia, suggesting that SST anomalies in this region could trigger zonally propagating wave trains.
The steady Rossby wave rays obtained from the theory of Rossby wave ray tracing are shown in figure S7. Several initial points within the RWS region over East Asia near 30 degrees north latitude are chosen to demonstrate the ray paths of the steady waves, with the climatological zonal wind at 200 hPa serving as the background field for ray tracing. We choose zonal wavenumbers 3 (figure S7(a)) and 4 (figure S7(b)) to correspond to the spatial scale of the wave train pattern induced by the WP as shown in figure 7(a). During boreal autumn, the mid-latitude jet stream exhibits a pronounced northeasterly orientation across the Pacific basin. This configuration of the jet stream establishes a preferential pathway for the propagation of atmospheric waves, effectively steering and channeling the propagation of planetary waves in the upper troposphere. As shown in figure S7, the steady-state wave ray trajectories for zonal wavenumbers 3 and 4 both exhibit northeastward propagation characteristics, following the waveguide effect of the Pacific jet stream.
4. Conclusions and discussions
In this study, we employ IB(R)T analysis to identify key regions of teleconnection between autumn Arctic temperatures and tropical SST, and further explore and analyze the teleconnections between the Arctic and the tropical SST. We find that the strongest correlation between autumn Arctic temperatures and tropical SST occurs in the NAA and the NTA, with the NTA leading by one season. The summarized mechanism diagram in figure 8 illustrates the physical process underlying the teleconnection between inter-basin modulation of NTA SST and NAA warming. When summer NTA SST exhibit a warm anomaly, this leads to ascending air convection over the NTA, triggering anomalous low-level anticyclonic in the WP and intensifying the WPSH, resulting in the WP SST warming. In autumn, the anomalous warming of WP SST strengthens convective activity, causing upper-level atmospheric divergence and forcing a northeastward-propagating atmospheric Rossby wave train. This wave train propagates along the North Pacific and forms an anomalous high-pressure center over the NAA. The increased geopotential height over the NAA corresponds to increased atmospheric thickness and atmosphere warming, which in turn enhances downward longwave radiation, contributing to the accumulation of surface air temperature over the NAA in autumn.

Figure 8. Schematic diagram of the summer NTA drives autumn NAA warming through WP bridge. See the main text for details for the mechanism.
Download figure:
Standard image High-resolution image
This study utilizes observational and reanalysis data, along with atmospheric modeling, to establish a teleconnection pattern between autumn NAA temperature and summer NTA SST. The study focuses on the intermediary role of WP SST in the NTA-NAA connection. However, we also observe a cold anomaly in the central-eastern Pacific. Previous studies have indicated that deep convection in the tropics is generally weak and rarely observed in regions with SST below 26 °C [55]. Convective intensity over tropical oceans usually increases as SST rises from 26 °C to 29 °C [56]. The central-eastern Pacific is climatologically characterized by a cold tongue, with relatively low SST that inhibit convection [57, 58]. Therefore, this study does not delve deeply into the central-eastern Pacific. Furthermore, we also acknowledge the differences in intensity of the teleconnection patterns between the model experiment and observational results. This study primarily focuses on establishing the connection between the WP and the NAA. In future research, we will delve deeper into multi-model results (e.g. CMIP models) to identify the primary factors contributing to the simulation biases of the intensity the teleconnection patterns. Our findings reveal that the NTA connects to the Arctic via inter-basin interactions with the Pacific. The North Atlantic is characterized by a large-scale meridional atmospheric circulation pattern known as the NAO [59, 60]. Future research is needed to explore the relationship between the NAO and the NTA, as well as its role and contribution to the Tropical-Arctic connection.
Data availability statement
The original observational data are publicly available. All data sources are mentioned in the Materials and Methods section. The source codes for the analysis of this study are available from the corresponding author upon reasonable request.
All data that support the findings of this study are included within the article (and any supplementary files).
Funding
This work is jointly supported by the National Key Research and Development Program of China (2022YFF0801703).
Author contributions
C S, designed the research. W L, and C S, performed the data analysis, prepared all figures, and led the writing of the manuscript. All the authors discussed the results and commented on the paper.
Conflict of interest
The authors declare that they have no competing interests.