

Abstract
Data on Arctic and Sub-Arctic summer heat events are limited due to the sparse network of surface observation stations. Here, we analyze large heat events within 60°–80°N using land surface temperature (LST) observations from the moderate resolution imaging spectroradiometer (MODIS) sensor aboard the Terra satellite. Our heatwave (HW) detection method uses exceedances of the climatological 90th percentile of LST across summer months, and a spatio-temporal density-based clustering algorithm to distinguish space-time coherent events across Northern Hemispheric high latitudes for the summers of 2000–2022. We find a close link between HW duration, spatial extent and amplitude across the study region (correlations ranging from 0.63 to 0.73). MODIS-derived burned area data show that wildfire seasons are significantly correlated to summer HW activity, particularly in Siberia (r = 0.87 at p < 0.05) and Alaska and NW Canada (r = 0.45 at p < 0.05), and are also spatially co-located. MODIS active fire data also show substantial increase during larger heat events. For the strongest HWs in Siberia, the peak in daily fire count (from the MODIS active fire archive) lags behind peak HW activity. We conclude that there is a close link between intense fire summers and extensive HWs over boreal and shrub tundra regions (Interior Alaska, the Canadian Prairies and Eastern Siberia).
Export citation and abstract BibTeX RIS

Original content from this work may be used under the terms of the Creative Commons Attribution 4.0 license. Any further distribution of this work must maintain attribution to the author(s) and the title of the work, journal citation and DOI.
1. Introduction
Heatwaves (HWs) are extreme weather phenomena characterised by exceptionally high temperatures, and associated with slow-moving, anticyclonic circulation (Perkins-Kirkpatrick 2015, Horton et al 2016). High pressure regions tend to accumulate heat over time, which evaporates moisture and exacerbates the hot and dry conditions (Perkins-Kirkpatrick 2015). Therefore, extreme heat often coincides with intense wildfire activity and drought, creating compound hazards (Horton et al 2016, Ciavarella et al 2021, Kharuk et al 2022).
The scientific literature has mostly focused on regional heat events across well-documented areas, e.g. Europe (e.g. Stott et al
2005, Russo et al
2015), North America (e.g. Cowan et al
2016, Qiu and Yan 2020) and Australia (e.g. Jyoteeshkumar Reddy et al
2021), and less on high latitudes (Horton et al
2016). In part, this is related to the distribution of weather stations (Allen et al
2012). The harsh and remote Arctic and Sub-Arctic (ASA) hinders reliable, long-term in situ observations of temperature. Research on Arctic HWs is comprised almost exclusively of individual case studies (e.g. Wendler et al
2011, Fazel-Rastgar 2020, Ciavarella et al
2021, Liu et al
2022) using surface observations and reanalysis, which can have large gaps and uncertainties at high latitudes. Recent extreme events within the Arctic Circle ( N), such as record-breaking HWs and unprecedented fire activity observed across Canada in 2023 and Siberia in 2020–2021 highlight the need for more comprehensive research to characterise Arctic HWs and their links to fire activity.
The lack of in situ observations is a key limitation in ASA research. However, satellite data provide frequent monitoring of remote locations and could help fill this gap. Research and development of applications for remote sensing data is advancing fast and series are now long enough to record variability and trends. Satellite-derived datasets, such as land surface temperature (LST) and burned area (BA), are readily available for analysis. Our study uses remotely-sensed LST data to analyse large-scale HW activity, fire activity and their connection across the ASA. We employ a novel way of identifying spatio-temporally-coherent HW clusters and analyse their attributes such as amplitude, spatial variability, length and size.
While wildfire regimes for Siberia and Alaska have been studied extensively, as summarised by McCarty et al (2021), their link to HWs has not been systematically investigated. Previous studies (e.g. Hu et al 2015, Descals et al 2022) suggest that wildfire activity accelerates when certain thresholds of mean summer temperature are exceeded, and in some regions can be attributed to greenhouse gas forcing on large scales (Gillett et al 2004). Hence, this study evaluates the relationship between HWs and wildfires in the ASA with the help of additional fire products from MODIS. We recognise that aggregating across large areas ignores regional differences such as terrain and fire management. A large-scale analysis identifies statistical and mechanistic relationships between heat and fire, across different regions, but smoothens out small-scale events caused by topography and microclimates.
2. Data and methods
2.1. Data
This study focuses on the terrestrial ASA (60°–80°N, 180°W–180°E). We divide the study area into quadrants: 180°–90°W (Q1), 90°–0°W (Q3), 0°–90°E (Q4), 90°–180°E (Q2). The choice of quadrants follows from previous research by Dobricic et al (2020). Due to the short warm period in the ASA, we limit our HW analysis to June–August (JJA) and BA analysis to June–September (JJAS). We restrict our analysis to 2000–2022 due to data availability. We regrid each dataset to 1 1° resolution to identify large-scale heat and fire patterns.
We define burnable area within our study region using the Boreal-Arctic Wetland and Lake Dataset (BAWLD). It provides estimates of fractional land cover of 19 land cover classes at 0.5° resolution (Olefeldt et al 2021). The study region of BAWLD is categorised into 15 wetscapes via distinct configurations of land cover classes. We mask out wetscapes classed as Rivers, Large Lakes, Glaciers, Alpine and Tundra Barrens and Lake-rich Shield, as they comprise of little or no vegetation cover. We assume the other ten wetscapes have sufficient vegetation that could burn—we call these regions burnable.
We use the LST/Emissivity Daily (MOD11C1) Version 6.1 product (Wan et al 2021) from moderate resolution imaging spectroradiometer (MODIS) aboard Terra from 2000 to 2022. MOD11C1 provides gridded, daily LST at 0.05° resolution. The average overpass time of Terra is around noon. As the LST algorithm only works for clear-sky pixels, cloud cover leads to missing values. This means that MOD11C1 has an intrinsic warm bias in its climatology; it under-represents cloudy and rainy days, which tend to be cooler. However, MOD11C1 does not under-sample clear, warm days. Heavy smoke might also hinder observations. Comparison of LST and surface air temperature from ERA5 shows strong correlation between the data, while confirming an LST warm bias (see supplementary materials). While several studies attempt to create global, spatio-temporally continuous LST datasets (Ghafarian Malamiri et al 2018, Yu et al 2022, Zhang et al 2022), we do not interpolate missing values in order to maintain purely observational data.
We retrieve two fire products derived from MODIS:
- Monthly BA from MODIS (FireCCI51), produced as part of the Fire Disturbance Climate Change Initiative project of the European Space Agency (Chuvieco et al
2018). FireCCI51 is available for 2001–2020 at 250 m resolution, we aggregate it to 1
 to focus on large fires.
 - Archived active fire data (MCD14ML) distributed by Fire Information for Resource Management Service, spans 2001–2022 (NASA FIRMS 2023). MCD14ML is a subset of the data produced by the MODIS Fire and Thermal Anomalies algorithm (Giglio et al
2016), aboard both Terra and Aqua. MCD14ML records pixels containing one or more active fires or thermal anomalies. We aggregate the data to 1 resolution by summing up the number of active fire pixels within each grid cell.


Neither fire product is available in 2000, so HWs in 2000 are excluded from our HW–wildfire analysis. As a level 2 product, MCD14ML has spatial and temporal sampling issues (Giglio et al 2016) in the presence of smoke. Hence the monthly BA product may be more robust and representative of wildfire extent on seasonal timescales. We use MCD14ML to study the relationship between HWs and wildfires on timescales shorter than a month and for investigating the timing of peak fire activity with respect to peak HW activity.
2.2. HW clustering technique
Our HW definition builds on previous definitions used in climate research (Perkins-Kirkpatrick and Alexander 2013, Cowan et al 2016). On a grid-point level, we define heatwaves as three consecutive days which exceed the day-of-year 90th percentile (90thp) of LST. We use a multi-year, centred 11 day rolling window for calculating 90thp for each grid point over the analysis period. If a missing day caused by sensor outage in 2000 is both preceded and followed by an exceedance, we flag it as an HW pixel. We use the 90thp, instead of the 95th percentile, due to the presence of missing values. We use a rolling window of 11 days to account for the seasonal cycle, provide a reasonable sample size and reduce noise from synoptic scale variability. We use at least three consecutive days of anomalous heat, as more consecutive days yield more intense events and prolonged heat is more likely to impact vegetation. Reasonable perturbations of the percentile and length of consecutive days to identify gridpoint heat, and the length of the rolling window for climatology yield similar results.
To identify space-time coherent, large-scale HWs, we perform spatio-temporal density-based clustering with noise (ST-DBSCAN) on our dataset of grid points recording HW conditions. We apply a three-dimensional (3D) version (Birant and Kut 2007) of DBSCAN (Ester et al 1996), an unsupervised clustering algorithm that labels each point as part of a group or noise based on its location with respect to all other points in the dataset. We discard small clusters below 100 000 km2 daily extent (details see supplementary materials) to study the characteristics of large HWs in the Arctic. This results in the final definition of a (large) HW as prolonged heat exceedances clustered in space and time, which cover at least 100 000 km2 for at least one day.
The 3D ST-DBSCAN requires three parameters (Birant and Kut 2007, Cakmak et al
2021): a spatial threshold ( ), the minimum number of neighbours (η) and a temporal threshold (
 ).
).  and
and  are the maximum spatial and temporal separation between two points to be neighbours and η is the minimum number of points within a neighbourhood for the region to be considered dense.
We evaluate the sensitivity of HW clusters to parameter choices. They are least sensitive to  , but vary greatly with
  and η. The clustering performed best when choosing 1000 km, 2 days and 10 neighbours as parameters; see supplementary materials for a detailed description of our parameter tuning method and discussion on clustering algorithm choices. We also note that the clustering algorithm is a tool to identify larger and longer HWs, rather than find the optimal HW characteristics. We compare clusters found in the LST data to those in the daily maximum near-surface air temperature (
 ) from ERA5 reanalysis (table S2). We find good agreement, but more clusters in
  due to the aforementioned warm bias in LST data (see supplementary materials).
We are not aware of any other study that uses ST-DBSCAN for HW analysis. Most HW-related studies define HWs at grid cell level only (Reddy et al 2022). To characterise HW extent, many studies (e.g. Cowan et al 2016) estimate the proportion of grid cells under HW conditions within a region of interest, instead of tracking the shape and extent of the events.
Using only grid points which are a part of an HW cluster without interpolation, we assign attributes to each cluster:
- Duration: the number of days from the first to last day when the daily cluster size exceeds 100 000 km2. This filters out small HWs, the beginning and tail of large HWs. However, it lets HWs vary in size throughout their duration.
- Region: the quadrant that the coordinates of the cluster centroid are located in.
- Amplitude: maximum of the daily area-weighted mean LST anomaly of the hottest 100 000 km2 within a cluster. For each day, we rank the highest LST anomalies from the 90thp and cut off our weighted average once the cumulative extent of the ranked grid cells exceeds 100 000 km2. This method samples over the hottest regions of the same size to avoid a low bias in the intensity of the largest HWs.
- Entropy: scatter of LST anomalies within an HW. Higher entropy means more variation in LST anomalies.
- Anomalous energy: integral of the daily LST anomaly over the spatial extent of the HW, averaged over its duration.
- Maximum extent: HW area on the day of the largest spatial extent.
- Fire density: mean fire count per day and per burnable area. We divide the number of active fires during each day of a HW by its burnable area, and average over its duration. The resulting fire density values are standardised by the spatial mean and standard deviation (σ) in each quadrant separately—0 corresponds to the regional-average fire activity during the HW, and 1 (or above) means that the fire occurrence was 1 σ (or more) above the regional-average.
To compare HWs within and across the quadrants, we use the Pearson correlation coefficient (r) and the multiple correlation coefficient ( , for
, for  variables).
2.3. HW–wildfire relationship
We aggregate HW days over summer (JJA) as the percentage of burnable grid cells with valid LST observations which are part of a cluster. Similarly, we divide the cumulative sum of BA over the extended summer (JJAS) by its total burnable area. We estimate the Pearson correlation coefficient r for the resulting time series in each quadrant. This gives an indication of the strength of the HW–wildfire relationship. We assess the significance of r by randomly perturbing the time-order of the aggregated BA, with p-value being the proportion of 10 000 permutations which has a larger correlation coefficient than the observed r.
We also analyse the spatial characteristics of the mean JJAS BA in each quadrant. We compare these results to spatial distribution of the fire density of HW clusters during the whole study period, the five strongest HW and fire summers.
To analyse timing between heat and fire, we create composites of HW clusters with the highest amplitude and stack them by the day of their maximum amplitude. We carry out lagged cross-correlation (CC) of the daily HW metric and fire count. We perform a leave-one-out cross-validation to test sensitivity of our composite mean to each member.
3. Results
3.1. Arctic HW characteristics
The HW attributes and number of clusters we obtain are shown in figure 1. We note no significant difference between the distributions of HW characteristics across the four quadrants (figure 1(a)). We find that HW metrics are significantly correlated (p < 0.05) with each other in all quadrants: max extent with duration  , max extent with amplitude
  , and duration with amplitude
  . In addition, larger and longer HWs have higher amplitude
  . Figure 1(b) demonstrates these relationships visually for each quadrant.
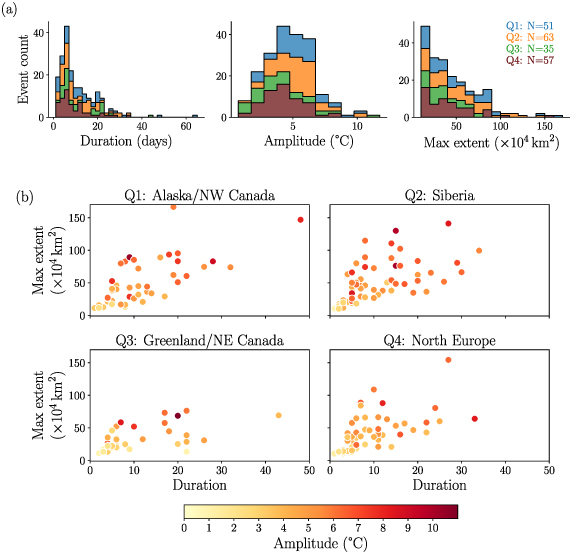
Figure 1. Analysis of heatwaves detected with the clustering algorithm for LST during JJA (2000–2022). (a) Stacked histograms of heatwave metrics for all large heatwaves across the study region and quadrants in LST. N denotes the number of clusters in each region. (b) Scatterplot of maximum extent against duration of heatwave for each quadrant. Each point symbolises a heatwave cluster, the colours mapped by their amplitude.
Download figure:
Standard image High-resolution image3.2. HW–wildfire relationship
With the active fire archive, we also find significant correlation between fire density and maximum extent in all quadrants  , and with other characteristics in some quadrants
 ) despite substantial sampling uncertainty. The strong correlation between fire density and maximum extent is consistent with drying of the vegetation caused by large-scale extreme heat promoting burning (Seneviratne et al
2021), and increased chance of ignition in a larger area.
) despite substantial sampling uncertainty. The strong correlation between fire density and maximum extent is consistent with drying of the vegetation caused by large-scale extreme heat promoting burning (Seneviratne et al
2021), and increased chance of ignition in a larger area.
We also identify a link between HW occurrence and wildfire BA across a quadrant over the whole summer (figure 2). While the relationship between JJA HW and JJAS BA remains significant over the entire study region (r = 0.63), splitting the Arctic into quadrants reveals that the quadrants containing Siberia (r = 0.87) and Alaska (r = 0.46) are the strongest contributors toward the observed strong HW–BA relationship within the Arctic. Q3 and Q4 show low, non-significant correlation between summertime HW activity and BA (r = 0.04 and r = 0.27 respectively). This is consistent with less vegetation cover in NE Canada and Greenland (Q3). The reason for this smaller correlation for Q4 (encompassing North Europe) is less clear, and may be linked to a strong fire management regime in North Europe (Nordic Forest Research, SNS 2021) and possibly also complex topography. As the Arctic warms, HWs will become more likely (Seneviratne et al 2021), but due to high variability this occurs on the background of large climate variability seen in the sectors. For discussion on trends and the impact of clustering on figure 2, see supplementary materials.
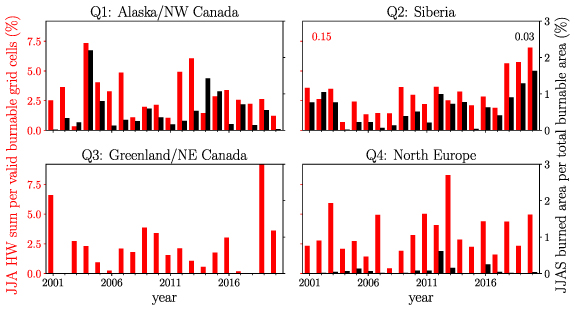
Figure 2. Regional-scale relationship between heatwave and wildfire activity in boreal summer. The sum of heatwave cluster days are expressed as a percentage of burnable grid cells with valid LST observations in each summer (JJA) and in each quadrant (red columns), and the sum of burned area in each extended summer (JJAS) as a percentage of the total burnable area in each quadrant (black columns). Values for the linear slopes for JJA HW (red) ( ) and JJAS BA (black) (
 ) are indicated only when they are statistically significant (p < 0.05).
Download figure:
Standard image High-resolution imageWe further investigate the temporal link between HW and fire activity in figure 3, using MCD14ML. As the quadrant (Q2) exhibiting the strongest HW–wildfire link, we create a composite of the ten hottest HW clusters in Siberia in figure 3 (see supplementary materials for other quadrants). Peak fire activity tends to follow peak HW activity—significant (p < 0.05) CC is found for a lag of 12–13 d. While the location of significant heat/fire lags varies with the cluster number or HW metric chosen, the strong and significant negative correlation before the peak HW activity remains consistent, showing that fire activity does not climax before HW activity.
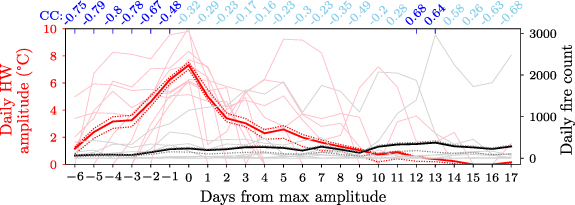
Figure 3. Composites of the ten hottest heatwave clusters in Siberia. Heatwave evolution and daily fire counts with respect to the day of peak heatwave activity are shown in red and black respectively. Thick, solid lines show the composite mean, dotted lines the 95% confidence interval obtained from the LOOCV tests, and semi-transparent lines the individual HW clusters in the composite. Cross-correlation (CC) values are noted in blue along the top, with significant CC (p < 0.05) in dark blue.
Download figure:
Standard image High-resolution imageWe investigate the spatial relationship between HW and fire activity in figure 4—relating fire activity (BA as grayscale shading and fire density as coloured points) to HW locations. Evaluating the entire study period (figure 4(a)), we find negligible fire activity during HWs in Greenland and North Europe. Events coinciding with anomalously strong fire activity (in space, at any given time) in Q4 are located in Western Siberia. In Q1 and Q2 we see some overlap between where high fire density HWs have been observed and where most of the summertime BA occurs, and a tendency for anomalous fire density (red shaded dots) to occur with larger HW (larger dots) in those regions. This indicates a spatial dependency for fire-prone HWs in Interior Alaska, the Canadian Prairies and Eastern Siberia. While HWs occur across the entire Arctic, there is a limited relationship between HWs and fires in the far northern Arctic. In summary, extreme heat over regions with sufficient vegetation appear most likely to result in high fire activity.
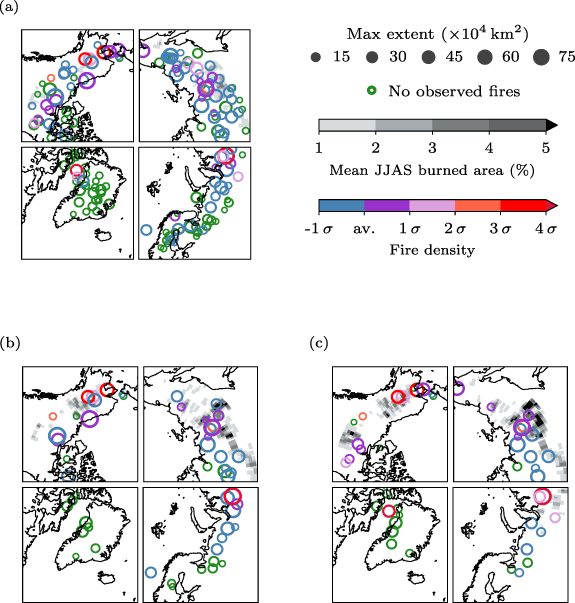
Figure 4. Spatial link between heatwave and wildfire activity. Circles denote the centroid of each heatwave, colour indicates the observed fire density during each event relative to average and standard deviation of fire density during heat waves across the spatial sector, size denotes maximum extent of each heatwave. Grayscale shading shows average JJAS burned area during (a) 2001–2020, (b) the five strongest heatwave summers and (c) the five strongest fire summers in each quadrant. JJAS burned area is calculated as a percentage of area burned in each grid cell. Summers used in (b) and (c) are the strongest events shown in figure 2. Legend applies to all subfigures.
Download figure:
Standard image High-resolution imageFinally, we investigate whether HW activity in the five strongest HW/fire summers is more prone to fires (figures 4(b) and (c)). In comparison to figure 4(a), we find a more pronounced spatial HW–BA relationship during these five summers (figures 4(b) and (c)). Especially for intense fire summers, we find a strong spatial co-incidence between HWs and BA (figure 4(c)). This suggests that extensive HWs contribute greatly to intense fire summers. As fire activity lags behind peak HW activity (figure 3), this supports that intense HW activity may result in extreme BA. However, strong HW activity does not result in extensive burning everywhere (figure 4(b), and discussion).
4. Discussion
Our spatio-temporal clustering technique allows us to include spatial connectivity in our HW definition. We minimise noise sensitivity to individual hot days through limiting gridpoint HW conditions to at least three consecutive HW days, before clustering. We tune the parameters via a simplified 3D extension of the grid search method. However, we note that most clustering quality indices and hyper-parameter tuning methods have not yet been implemented for spatio-temporal data and require further work.
We aim to minimise the bias within HW attributes:
- We only use valid grid cells recording HW conditions when calculating HW attributes rather than interpolating across missing values. This may result in an underestimate of some HWs (see supplementary materials), as the 90thp threshold with complete sampling includes cool, cloudy days that may be missing for LST. Further work could focus on using gap-filling techniques for the LST data (e.g. Metz et al 2017, Ghafarian Malamiri et al 2018).
- We choose an extent threshold of in our definition of HW duration to focus on large-scale events and limit influence of noise during the onset or decay period of HWs. Moreover, this helps to compare the frequency and characteristics of similar-sized HWs across the ASA.
- We split our study region into only four quadrants, similarly to Dobricic et al (2020) rather than smaller (e.g. IPCC) regions (Christensen and Kanikicharla 2021) to avoid separating large HW clusters. Our focus is on the large-scale link between heat and fire, integrating across different topography and fire management regimes which would need to be considered in a regional analysis.
- The amplitude of the HW is similarly based on the hottest 100 000 km2 grid cell area. Our final amplitude definition closely agrees with the anomalous energy of the HW and shows a much clearer logarithmic relationship between our amplitude definition and entropy than a more simple metric (see supplementary materials).

We find that the duration, maximum extent and amplitude of HW clusters are strongly correlated across the terrestrial Arctic. Previous studies (e.g. Bieli et al 2015, Perkins-Kirkpatrick 2015, Horton et al 2016, Quinting and Reeder 2017, Papritz 2020, Yasunari et al 2021) show that high pressure regions are the dominant atmospheric features responsible for HW development. Several case studies on recent HWs in Siberia (Overland and Wang 2020, Ciavarella et al 2021), Scandinavia (Sinclair et al 2019, Lindroth et al 2021), Alaska (Wendler et al 2011) and Canada (Fazel-Rastgar 2020) report upper level ridging and semi-stationary anticyclones. The longer the HW persists (as a result of the anticyclonic conditions), the stronger and larger it may become, amplifying surface heating and preventing heat dissipation. Therefore, the strong link between HW duration, size and strength demonstrated in our results is consistent with HW development being governed by anticyclonic weather systems across the ASA.
However, due to climatic and land surface differences across the study region, HWs in the more continental climate of Siberia, NW Canada and Alaska tend to have larger, longer and stronger HWs (figure 1). HWs in the maritime climate of NE Canada and Greenland are weaker in intensity (figure 1), but can persist for long periods of time, likely due to the persistence of melting.
As our analysis is large-scale, we are not able to deal with local confounding factors consistently. Instead, we focus on the question if HW activity contributes to fire variability, a question that is addressable using large-scale data where local effects tend to average out. The scatter of our HW clusters (figure 4(a)) indicates that HWs extending over large burnable areas are closely linked to above-average fire activity, and that links between heat and fire can therefore be extended to high latitude HWs. High HW activity can extend much further than BA, thus HWs do not result in wildfires everywhere in the Arctic. Our findings show that enhanced HW activity over the boreal and shrub tundra regions—mainly Siberia, Alaska and NW Canada—are most likely to result in high fire activity (figures 4(b) and (c)). The findings of Masrur et al (2018) also support this; they identify clusters of high fire activity in the tundra regions of Alaska, the Canadian Arctic and NE Russia. North Europe at present shows a weaker link, which might be explained by more complex topography and fire management.
Our findings are consistent with research by Descals et al (2022), who find an exponential relationship between mean summer average temperature and annual BA in the Siberian Arctic and propose that temperature controls various other fire factors directly (i.e. vapour pressure deficit, length of growing season) and indirectly (climatic water deficit). While they do not discuss HWs specifically, high mean summer temperature often reflects an intense HW season (Dobricic et al 2020). Our findings suggest that prolonged, extreme heat conditions might be an underlying cause of the relationship observed by Descals et al (2022). Our study focuses on the observed link between heat and fire and does not aim to explain other important factors in wildfires that have shown to be regionally important, such as fire management or fuel load (Descals et al 2022).
Overall, our findings suggest that HWs are a driver of a severe wildfire season. Physically, this might be linked to enhanced evaporation during prolonged periods of extremely hot days. Ignition in the high latitudes is mainly caused by lightning strikes (Wendler et al 2011, Descals et al 2022). The more intense the heat, the drier the vegetation can become, and the more likely convection and lightning will occur. With increasing HW extent, more vegetation experiences heat stress and ignition can occur over a larger area. For small, short or weak HWs, the probability of burn is lower due to the cool (and often wet) climate of Arctic summers.
5. Conclusion
We use a novel, density-based clustering method to find large individual HWs in the LST product from MODIS. This allows us to characterise each event by their duration, amplitude and maximum extent. We find that these metrics are strongly correlated ( –0.73) across the study region, consistent with the idea that Arctic HWs are governed by anticyclonic circulation.
Using two different fire datasets from MODIS (active fire archive and BA), we show that there is a strong connection between intense fire seasons and enhanced HW activity in Siberia, Alaska and NW Canada. Summertime BA is significantly correlated with HW activity in two quadrants: Siberia (r = 0.87 at p < 0.05), Alaska and NW Canada (r = 0.45 at p < 0.05). Analysing the strongest HWs in Siberia, we find a 12–13 d lag between peak HW activity and peak daily fire count. We identify Interior Alaska, the Canadian Prairies and Eastern Siberia as hot-spots for fire-related HWs. In particular, we link intense fire summers to extensive HWs. While not all HWs lead to wildfires, our findings demonstrate that extreme heat played an important role in the intense wildfire seasons that Siberia, Alaska and NW Canada experienced in the 21st century.
Our results of a strong connection between fire and heat raises concerns about how the carbon-cycle may be affected by the HW–wildfire relationship in high latitudes. Hence consistent with Wang et al (2023), boreal forest and the high latitudes are a region that may be affected by significant climate risk, both to the carbon cycle and air quality. This is illustrated dramatically in the 2023 strong Canadian Arctic fire seasons which impacted air quality across North America.
Acknowledgment
G H and A B were funded by NERC under the GloSAT Project (NE/S015698/1). We acknowledge the data providers for MODIS and the BAWLD dataset. For the purpose of open access, the author has applied a Creative Commons Attribution (CC BY) licence to any Author Accepted Manuscript version arising from this submission.
Data availability statement
No new data were created or analysed in this study.
Supplementary data (7.3 MB PDF)