

Abstract
Ambient air pollution in India accounts for 870 000 deaths per year, including 43 000 from road transportation. Vehicle electrification could posit a sustainable solution. However, 3/4th of India's electric grid is powered by coal, emitting large amounts of PM2.5, SO2, and NOx. This leads to uncertainty regarding the health benefits and distributional consequences from vehicle electrification. Our results show that if electric vehicles made up 30% of vehicle kilometers traveled, there would be 1000–2000 additional deaths each year under present day conditions. Higher increases in pollution exposure are seen in scheduled castes/tribes, poor, and rural populations particularly in high coal production states. Switching to net zero-emitting electricity generation for charging would reduce air pollution attributable deaths by 6000–7000 annually and PM2.5 exposure across all groups of population.
Export citation and abstract BibTeX RIS

Original content from this work may be used under the terms of the Creative Commons Attribution 4.0 license. Any further distribution of this work must maintain attribution to the author(s) and the title of the work, journal citation and DOI.
1. Introduction
Ambient air pollution exposure is one of the leading environmental contributors to the global burden of disease [1] associated with 4.1 million premature deaths annually. In India, both short-term and long-term exposure to air pollution have been linked to increased disease burden and mortality [2–6]. The distribution of health damages from ambient particulate matter is heavily skewed toward the developing world [7, 8] due to high population density, increase in consumptive uses and lack of regulation on emissions of air pollutants such as SO2, NOx , and PM2.5. SO2 and NOx react with NH3 in the atmosphere leading to the formation of secondary PM2.5, associated with premature mortality from cardiovascular and respiratory diseases, lung cancer and other health issues [1]. India alone accounts for a quarter of total global premature deaths attributed to ambient PM2.5 [9–11]. Mittal et al [12] looked at air quality co-benefits of low carbon policies in India's transportation sector and determined higher co-benefits in high-income states like Maharashtra compared to low-income states like Bihar and Jharkhand. Although, air pollution health impacts are widely studied [13–18], the understanding of how adoption of new technologies will affect the overall costs or benefits, while accounting for systems dynamics, distributive equity and environmental justice (EJ) issues, is often lacking especially in developing countries in Asia and Africa [19].
Vehicle electrification can be a sustainable strategy, but the net effects on air pollution consequences hinges on factors like the electricity generation mix, air pollution control technologies used, and vehicle efficiency. The benefits of reduced air pollution from conventional gasoline or diesel vehicles will depend on where and when vehicles are used [20, 21] and the types of vehicles displaced [20, 21]. When it comes to the distributional impacts of charging electric vehicles (EVs), the timing of charging, location and type of power plants used to meet the charging demand, and the resulting health impacts must be considered. Unlike tailpipe emissions from gasoline and diesel vehicles, emissions from charging EVs may occur at power plants located far away, with emissions that can travel long distances. This means that the group of people exposed to air pollution consequences may differ from the group exposed to tailpipe emissions. Studies in the United States (US) have shown that the reduction in air pollution health impacts and climate change from EVs depends greatly on the electricity generation source and location [13, 14]. Air pollution exposure is also seen to disproportionately impact certain ethnic and income groups. In the US, black and Hispanic minorities have higher levels of PM2.5 exposure compared to whites [22–27] and in 34 major cities in China, EVs have been shown to exacerbate environmental injustice, with most of the emissions being inhaled by low-income rural communities [28, 29].
India's reliance on coal [30] for electricity generation and lack of air pollution control technologies [31] make it unclear how vehicle electrification will affect premature mortality and EJ. Some studies related to the focus of this work include a study by Gilmore and Patwardhan [15], who find that compressed natural gas vehicles had the lowest private and societal costs in a benefit–cost analysis of the ownership cost, environmental and human health effects of different four-door passenger vehicles in India. Cropper et al [16] estimated the health damages associated with PM2.5 from individual coal-fired power plants in India and found 75% of premature deaths were associated with fine particles resulting from SO2 emissions. Peng et al [17] found that failing to implement air pollution control strategies resulted in 14 200–59 000 more PM2.5-related deaths in 2040 compared to 2015, while failing to implement energy policies resulted in 5900–8700 more PM2.5-related deaths. Gao et al [18] found that 11 million years of life were lost due to power generation emissions in China and India.
In previous work, state-level life-cycle emissions of criteria air pollutants from various vehicles in India were estimated and it was found that some categories would increase PM2.5 emissions if electrified [21]. Specifically, it was found that the Indian grid would need to decrease its SO2 emissions by 58%–97% (depending on the state) for widespread vehicle electrification to make sense. While the implications for emissions are certainly important, premature mortality outcomes from primary and secondary PM2.5 emissions will depend on the resulting PM2.5 concentration associated with such emissions, as well as on the exposure to people. Up until recently, such assessments would hardly be feasible, since there was no reduced complexity model for air quality available for India. Recently, Global Intervention Model for Air Pollution (InMAP) was developed by Thakrar et al [32], enabling an assessment of premature mortality implications of different transportation strategies for India.
The EJ literature is growing but limited in the context of India. Garg [33] estimated the health benefits of reducing PM10 concentrations in Delhi based on income level, finding that percentage reduction in avoided cases was higher for the poor than the rich. Kopas et al [34] studied the EJ impacts of air pollution from coal-fired power plants and found that ethnic and poor populations were more likely to be exposed to coal pollution, but this relationship followed an inverted U-shape. Sabapathy et al [35] assessed commuters' exposure to CO and PM10 in Bangalore using a survey and found no evidence that lower-income groups bear higher commuting exposures. Kathuria and Khan [36] developed household exposure index using a structured questionnaire and PM data from seven pollution monitoring stations in Delhi, found that economically disadvantaged communities were most affected by exposure to air pollution on average.
Despite the growing attention to air pollution consequences, to date there is no assessment of state level health impacts and monetized damages in India from vehicle electrification, while also accounting for the EJ aspects across populations under Indian government's ambitious decarbonization targets. This study aims to fill this gap by providing a state-level assessment for four grid scenarios and drawing policy conclusions for the widespread adoption of EVs based on the local electricity mix.
In this work, we start by establishing a baseline scenario that uses characteristics of the vehicle stock as detailed in table S1 in the Supplementary Information (SI). We then consider several illustrative scenarios, with differing assumptions regarding the grid emissions. We have named these scenarios EV current grid, EV coal, EV natural gas and EV net zero grid. EV current grid assumes that EV charging is associated with emissions of SO2, NOx , and PM2.5 matching the state average annual grid emissions intensity. EV coal represents charging done with uncontrolled (i.e. with no installation and use of air pollution control technologies) coal power plants, EV natural gas represents 100% charging from natural gas power plants and EV net zero grid represents a scenario where electricity generation mix emits nearly no emissions of pollutants that lead to PM2.5 (such as coal or gas with post-combustion carbon capture and sequestration, wind, hydropower, solar, combined with storage, or nuclear).
For each of the four scenarios, we calculate the total vehicle kilometers traveled by multiplying total number of registered vehicles in each vehicle class (two-wheelers, three-wheelers, four-wheelers, and buses) by their average distance traveled [21, 37]. We then assume that 30% of these vehicle kilometers traveled are attributable to EVs, which is equivalent to assuming that 30% of the vehicles in the counterfactual scenarios are electric. This assumption aligns with India's 2030 goals for vehicle transition [38]. We use the latest high-resolution emissions inventory from Emissions Database for Global Atmospheric Research version 5.0 (EDGAR v5.0), Model for Emissions of Gases and Aerosols from Nature (MEGAN) v2.1, Fire INventory from NCAR (FINN) v2.5 which includes anthropogenic, biogenic and fire sources respectively [39–43], and couple it with a reduced complexity air quality model, Global InMAP [32], to compute annual average PM2.5 concentration changes in each scenario. We use nonlinear concentration–response functions from 2019 Global Burden of Disease (GBD) study [44, 45] and compute the health impacts for each scenario. This dataset provides age- and cause-specific mortality data for the six endpoints (lung cancer, lower respiratory infections (LRIs), chronic obstructive pulmonary disease (COPD), diabetes mellitus type 2, stroke, ischemic heart disease (IHD)). The economic value of the health impacts is determined two-fold (a) using a range of India-specific values for the statistical life (VSL) varied by the income elasticity, computed using the relationship between value of statistical life for the US and gross national income for the two countries; (b) using US-specific VSL to analyze how monetized damages change if we present the cost society is willing to pay to reduce the loss of an additional life in an equitable way [46–52]. We combine this with the modeled estimates for the demographics based on the 2001 and 2011 census data [53] and 2015–2016 National Family Health Survey [54] data to analyze EJ consequences across all regions of India.
2. Materials and methods
We estimate ambient PM2.5 attributable health burden from road transportation in India under multiple vehicle electrification and grid emissions scenarios. This study combines a high-resolution emissions inventory from anthropogenic, biogenic and fire sources of emissions of air pollutants with a recently developed global reduced complexity air quality model (Global InMAP) to compute PM2.5 concentration in each scenario. We use concentration–response functions from 2019 GBD and latest estimates on value of statistical life to provide comprehensive results of the air pollution consequences from vehicle electrification in India. Furthermore, we include the cost of greenhouse gas (GHG) emissions by using the social cost of carbon (SCC).
2.1. Scenarios
The overall health and climate change damages from air pollution and GHGs induced or avoided by vehicle electrification will depend on the characteristics of EV emissions and of the baseline vehicles that they will be substituting. The emissions from EVs, in turn, will depend on the emissions intensity of the grid used for charging. Thus, we establish four counterfactual scenarios that are used in this study, and compared with the reference baseline scenario assumed at 0% EV penetration.
We start by characterizing the anthropogenic emissions of NH3, primary PM2.5, NOx , SOx and non-methane volatile organic compound (NMVOC), from seven sectors (agriculture, residential, power, transport, waste, industry, and others) from EDGAR version 5.0 [39, 40]. EDGAR uses a 0.1° × 0.1° (∼11 km × 11 km) spatial resolution for allocation of emissions and has sectoral and country level air pollutant emissions data from 1970 to 2015 [39, 40]. EDGAR v5.0 considers three types of road transport emissions: exhaust, evaporative, and non-exhaust emissions. Exhaust emissions are tailpipe emissions with vehicle engine warmed up to its normal operating temperature [39, 40, 55]. Evaporative emissions are NMVOCs, originated due to the evaporation of fuel especially in gasoline vehicles [39, 40, 55]. Non-exhaust emissions include tire and brake wear and road abrasion emissions [39, 40, 55]. Biogenic emissions are from MEGAN v2.1 [41, 42]. MEGANv2.1 has a global coverage with 1 km × 1 km spatial resolution [41, 42]. The wildfire emissions from open-burning sector were obtained from the FINN v2.5 [43] which is based on satellite observations. FINN provides daily, 1 km × 1 km spatial resolution open burning emissions estimates for use in regional and global chemical transport models [43]. We then use Global InMAP [32] to estimate the resulting annual PM2.5 concentration from all sectors, as shown in figure S1. Our baseline scenario (see figure 1(A)) is the current contribution of transportation sector to the overall current PM2.5 concentration.

Figure 1. Road transportation attributable PM2.5 concentration. (A) Contribution of the road transportation sector to estimated baseline annual ambient PM2.5 concentration. (B) We compare the change in PM2.5 concentration attributed to the use of EVs in four different scenarios to the current emissions from the road transportation sector.
Download figure:
Standard image High-resolution imageWe then consider four scenarios, with varying assumptions regarding the emissions intensity of the grid and its electricity generation mix. All scenarios assume electrification of 30% of stock of vehicles from four classes (two-wheelers, three-wheelers, four-wheelers, and buses), distributed based on the projected vehicle kilometers traveled by different vehicle classes in 2019, as shown in table S1. The number of total registered vehicles by vehicle class was obtained from road transport yearbook [37] developed by the Ministry of Road Transport & Highways, Government of India. The average kilometers driven in a year and the charging requirements in KWh km−1 for different vehicle types comes from Peshin et al [21]. The 30% share for EVs in terms of vehicle kilometers traveled is hence computed as the fraction of the product of total registered vehicles and average kilometers driven by each vehicle class per year.
The scenarios are called EV current grid, EV coal, EV natural gas and EV net zero grid. The simulated state-wise electricity consumption and average emission factors (in kg MWh−1 for PM2.5, NOx , SO2) for each power plant for 2017–2018 are obtained from Sengupta et al [56] and discussed in data S1. EV current grid assumes the 2017–2018 grid mix. EV coal and EV natural gas scenarios assume 100% of EV charging is either done with coal or natural gas power plants. EV net zero grid scenario assumes that EVs are charged from energy sources that have net-zero emissions. The latter three scenarios represent the marginal set of plants that may be called upon to meet the increasing demand from charging. Sengupta et al [57] determine that coal plants usually run at the margin in high emission states in India while hydro and natural gas plants are called to meet excess demand in the low emission states.
The current grid would need to produce ∼4% more electricity annually to support the charging of a transportation fleet that is 30% electric, as shown in table S1. If all charging is done using coal power plants (EV coal), this increases to about 7% more electricity from each plant (table S2). If charging is done using natural gas plants (EV natural gas), the increase is ∼140% (table S2). This is because coal currently accounts for about three-fourths of the electricity generation mix while natural gas contributes just 5% [30]. The emissions in the four scenarios where EVs represent 30% of the projected vehicle kilometers traveled are computed by decreasing the road transportation emissions from EDGAR used for baseline scenario by 30% and increasing the power sector emissions based on the electricity needed to charge the EV fleet. Specifically, we decrease the road transportation attributable exhaust and evaporative emissions by 30% while keeping the non-exhaust emissions the same as the baseline scenario. This is because non-exhaust emissions from EVs will be equal to or greater than those associated with internal combustion engine vehicles depending on the vehicle weight and technology improvements like regenerative braking systems [58–61]. The reason we did not increase the non-exhaust emissions in the EV scenarios is because the kerb weight associated with EV counterparts currently available in India across various vehicle categories is either similar to or lower than the internal combustion engine vehicle in the same category [21]. Secondly, there is a high level of uncertainty associated in the emission factors associated with these conversions as described in [62] and out of scope for this study. Thirdly, unique aspect about India's road transportation sector is two-wheelers accounting for ∼75% of the fleet [37] which contribute just 5% to the total non-exhaust emissions [61] and this is the category seeing the largest uptick in registered EVs [63]. These are of course simplifying assumptions, as the removal of conventional vehicles and their emissions and health consequences differ from state to state and depend on timing of dispatch. In figure S2 in SI, we show the simulated CO2 and SO2 marginal grid emission factors across five intra-day periods and monsoon/non-monsoon months for the top ten states in India based on population (∼1 billion people) developed from Sengupta et al [57] (data S2). We find that though mid-day (10°am to 2°pm) and afternoon (2 pm to 6 pm) periods for certain states with higher renewable penetration show decrease in emissions, marginal emission factors still align closely with average emission factors because of India's 3/4th dependence on coal.
2.2. InMAP
InMAP is a reduced-complexity air quality model [64] that has been used to study air pollution health consequences in US [25, 65–68] and has recently been extended to a global spatial domain [32]. It uses outputs from chemical transport model GEOS-Chem [69] to parameterize chemistry, physics, and meteorology. The model estimates pollutant concentrations by approximating the steady-state solution to a set of differential equations governing pollutant emissions, reaction, advection, diffusion, and removal. It solves equations by discretizing over space and time, using a variable resolution grid, and spatially varying parameterizations that simplify the reaction, advection, and removal terms in the equations. The annual-average concentrations of both primary and secondary fine particulate matter (PM2.5) are estimated using these emissions inventories. The secondary PM2.5 is tracked by accounting contributions from particulate ammonium (pNH4), particulate sulfate (pSO4), particulate nitrate (pNO3), and secondary organic aerosol, from emissions of PM2.5 precursors (sulfur oxides (SOx ), nitrogen oxides (NOx ), ammonia (NH3), and NMVOCs) [64].
Global InMAP uses the 2020 population data [70] to create a computational grid with ∼1.5 million grid cells. The horizontal resolution at ground-level ranges from 5° × 4° (∼500 km length at the equator) in remote locations to 0.04° × 0.03° (∼4 km length at the equator) in urban locations [32].
We ran a simulation in Global InMAP to compute the baseline ambient PM2.5 concentration (μg m−3) from all sources. The all-India population-weighted annual average PM2.5 is estimated to be 45.2 μg m−3. This in line with estimates by Chowdhury et al [71] of 55 μg m−3 for 2015 and average estimates by van Donkelaar et al [72] for India from 1998 to 2020 (53.3 μg m−3). We then calculated the premature mortality due to road transportation by comparing the initial simulation with the second run without road transportation emissions.
The four scenarios with electrified vehicles and different electricity generation mixes were performed by changing the emissions from the road transportation and power sector and comparing those with concentration in each grid cell in the baseline scenario. We assume a uniform 30% decrease in road transportation emissions at all locations and uniform increase in power generation (in MWh) based on the scenario and power plant type.
The stack height for the coal power plants with a capacity of >500 MW are required to be kept at 275 m based on the government guidelines; those between 210 MW and 500 MW are mandated to build a stack of 220 m. However, there are many old coal power plants in India having stack height ranged between 150 m and 220 m [73]. For our work, we assume an average stack height of 200 m for the coal plants and 100 m for the gas-fired plants as in [74]. For the other stack characteristics (velocity, diameter, and temperature), median parameter data provided by Environmental Protection Agency (EPA) is used since we do not have plant level stack parameters data available for India [75].
2.3. Health impact assessment
Year-2019 age specific mortality data and population age structures were obtained from the Institute for Health Metrics and Evaluation (IHME) for India [44]. This dataset provides age- and cause-specific mortality data for the five endpoints (lung cancer, LRIs, COPD, diabetes mellitus type 2, stroke, IHD).
We use the calculation approach provided in Apte et al [8] to estimate mortality impacts of PM2.5 in each grid cell. We compute premature mortality M for population age stratum l and disease endpoint j attributable to ambient PM2.5 for grid cell i located in region k using the attributable-fraction type relationship in equation (1)
where,
 is the population in grid cell i and age stratum l. Grid cells discretized based on state boundaries.
 is the baseline annual mortality rate (deaths per 100 000 people) for disease j in state k for age stratum p. Age specific functions are only used for stroke and IHD.
 represents the annual-average PM2.5 concentration in cell i.
 is the relative risk for disease j and age stratum p at concentration
  , and
, and
 represents the average population-weighted relative risk for end point j and age group p within region k.
 used in equation (1) and defined above is computed as follows:
The parameter grouping introduced in equation (1),  , represents the hypothetical 'underlying incidence' (i.e. cause specific mortality rate) that would remain for region k if PM2.5 concentrations were reduced to theoretical minimum risk concentration (theoretical minimum risk exposure level (TMREL)) throughout that region. To estimate the change in mortality, ΔMi,j
, in grid cell i under a scenario where concentrations are changed from
, represents the hypothetical 'underlying incidence' (i.e. cause specific mortality rate) that would remain for region k if PM2.5 concentrations were reduced to theoretical minimum risk concentration (theoretical minimum risk exposure level (TMREL)) throughout that region. To estimate the change in mortality, ΔMi,j
, in grid cell i under a scenario where concentrations are changed from  to a counterfactual concentration
  * without altering the underlying incidence, we use the following relationship:
Finally, estimates of year-2019 attributable mortality M (and potential changes in premature mortality ΔM for EV scenarios) are developed by summing over all j disease endpoints for all age strata within i grid cells for a specific state k.
The relative risk curves from GBD 2019 are scaled to incorporate the TMREL estimate using the methodology provided in IHME GBD 2019 modeling description [45]. The updated RR curves at different concentrations are developed using equation (4)
For each endpoint,  represents a theoretical minimum-risk concentration above which there is evidence indicating health benefits of PM2.5 exposure reductions (range from GBD 2019: 2.4−5.9 μg m−3). We perform this for lower, mean, and central estimates of relative risks for each disease endpoint.
2.4. Economic valuation
To estimate the monetary value of health damages, we apply India-specific estimates for the VSL developed using the relationship outlined in Hammitt and Robinson [45] shown in equation (5)

where:
 is the value of statistical life for the US.
 and
and
 are the gross national income in India and USA.
ε is the income elasticity for India.
The base VSL for USA of $11.3 million is taken as the average of estimates from EPA ($11 million), Department of Transportation ($11.6 million) and Department of Health and Human Services ($11.4 million) in USD $2020 [46–49]. This base VSL estimate is then adjusted for other countries by multiplying it by the ratio of average gross national income in India to income in the US, measured using Atlas method developed by World Bank on gross national income (GNI) per capita [50]. The average GNI per capita in the US was $65 910 and India was $1900 (2019 US$). We conducted sensitivity analysis on the income elasticity for India, calculated using a methodology applied by the World Bank [51]. We assume a central value of 1.2 for India, lower estimate of 1.0 and a higher estimate of 1.4 (applied for low and middle-income countries). We multiply these country specific VSL values obtained by national estimates of transportation attributable deaths to yield estimates of monetized health damages.
2.5. Demographic information
We projected the demographics data for 2021 using census data from 2001 and 2011 [53]. Subsequently, by combining the estimated 2021 census data with the PM2.5 concentration trajectories across the grid cells in India, we find the EJ consequences of electrifying vehicles based on eight socioeconomic parameters (literacy rates, urban households, scheduled castes, scheduled tribes, households with four-wheelers, households with two-wheelers, multidimensional poverty index (MPI), minority rates). To project literacy rates in each grid cell within a state, we used state-specific projections from 2010 to 2100 [76]. We assumed linear changes for minority rates, urban households, scheduled castes, and scheduled tribes between 2001 and 2011 and used these trends to project these variables for 2021. We found that the number of households with two and four-wheelers nearly doubled between 2001 and 2011, in line with data from the socio-economic and caste census [77]. We also used the MPI [78] developed from the 2015–2016 National Family Health Survey [54] to examine the relationship between grid cell level deprivation scores and change in PM2.5 concentration across the two scenarios. MPI is calculated as the product of headcount ratio (H) and intensity (A) as define below:
Headcount ratio (H) = proportion of individuals identified as multidimensionally poor in the population.
Intensity (A) = average share of weighted indicators in which multidimensionally poor individuals are deprived i.e. add the deprivation scores of the poor and divide it by the total number of poor individuals.
The dimensions MPI looks at include health, education, and standard of living with different weights assigned to each of the indicators within a dimension [78]. The higher the MPI score, the more deprived a community is.
Since India's census data does not provide income information, we use net state domestic product (NSDP) [79] (data S3) as a proxy to understand the relationship between state-specific incomes and change in premature mortality under different electrification scenarios. In figure S3, we show the NSDP in $ per capita for the Indian states and union territories.
3. Results
3.1. Baseline PM2.5-related deaths from all emissions sources and sectors in India
First, we estimate that the total annual PM2.5-related mortality from all emissions sources and sectors is 0.88 million (confidence interval due to uncertainty in the relative risk functions: 0.67−1.07 million) as shown in figure S4 in SI. The three leading causes of death are IHD, COPD, and stroke. These three contribute ∼80%–85% of total deaths from PM2.5 in our scenarios. These estimates are in line with prior studies [9–11, 17, 18, 80]. The state of Uttar Pradesh in the Indo-Gangetic plains has the largest health damages (99 000–164 000 deaths) from all sources. This region is a hotspot for PM2.5 pollution due to high emissions of air pollutants as well as reduced air circulation caused by obstruction from the Tibetan Plateau [18]. This is also the most populated state in India with the total population of ∼240 million. Other states with high number of deaths attributed to total ambient PM2.5 include West Bengal (78 000–110 000), Tamil Nadu (72 000–104 000), Maharashtra (67 000–107 000), Bihar (44 000–72 000) and Karnataka (39 000–64 000). The state-specific premature mortality numbers computed for total ambient air pollution are within the bounds provided by GBD 2019 study [44].
3.2. Contribution of road transportation to PM2.5 concentration
We find that road transportation in India in the baseline scenario accounts for PM2.5 concentration that ranges from 0 to 13 μg m−3 across the country (figure 1(A)). Our EV current grid and EV coal scenarios show an increase in PM2.5 concentration in the Northern, Central, as well as in some of the Southern states (figure 1(B)). The largest increases are seen in coal heavy states of Maharashtra, Gujarat, Chhattisgarh, Odisha, and Tamil Nadu. A grid powered by zero-emission sources results in decreased PM2.5 concentration everywhere.
3.3. Change in premature mortality for each scenario
We estimate that road transportation air pollution related deaths are estimated in the range of 27 000 to 37 000 year−1 (∼4% of the deaths from all sources) under present day conditions (figure S5). Electrification of vehicles under the current electricity grid would increase deaths by 1000–2000 year−1 (3.7%–5.4% increase). Assuming coal would provide all the electricity used to charge the vehicles, increase in deaths per year would range +7000 to +9000); and fewer deaths if electricity is from natural gas (−4000 to −6000) or net-zero emission sources (−6000 to −7000). The large increase in premature mortality associated with EV coal scenario is attributed to increase in electricity requirements (∼7% from coal power plants compared to 4% in EV current grid). This results in large increases in premature mortality in the heavily populated states of Uttar Pradesh, Bihar, Maharashtra, West Bengal, and Madhya Pradesh (figure 2).

Figure 2. Annual total PM2.5-related estimated deaths by state: (A) Baseline—road transportation (0% electric vehicle penetration). Central estimates of road-transportation attributable PM2.5 deaths along with uncertainty range for the states are shown in table S3 in the SI. (B) Changes in each scenario relative to baseline (30% EV penetration).
Download figure:
Standard image High-resolution image3.4. Monetized damages from air pollution and climate change
We compute the total annual monetized external costs from health damages and GHG emissions for our baseline and four EV scenarios. VSL represents the marginal rate of substitution between mortality risk and money that society is willing to pay for risk reduction. Given the many issues associated with representing the monetized damages and the underlying irreducible uncertainties and assumptions that come with that, we use a range of values to understand if our results are robust across a wide set of VSL assumptions. We assume a VSL for India of $161 000 computed from income elasticity of 1.2 (and using a low and high figure of $79 000 from income elasticity of 1.4 and $327 000 with income elasticity of 1.0, respectively). We multiply VSL by our estimated attributable deaths to find that current damages from road transportation range between $2.6 and $10.6 billion per year. Electrifying road transportation under the current grid or charging the vehicles with coal electricity generation scenarios lead to higher damages than the baseline scenario ($2.7–$11.1 and $3.2–$13.2 billion per year, respectively). Charging vehicles with natural gas-based electricity or with net-zero emitting sources reduces damages compared to the baseline ($2.2–$8.9 and $2.0–$8.4 billion, respectively) (figure S6). A VSL in the range of values used by the US agencies highlights the stark difference society is willing to incur given premature mortality in India is valued at one-seventieth to that of additional life saved in the US. Though the values for the US represent the US market, we include this comparison to represent the value of reduced mortality in an equitable way. In figure S7 in SI, we show that EV current grid and EV coal have much higher damages with VSL for US (+$19 billion and +$91 billion per year respectively compared to baseline). Improvements in annual health damages are seen for EV natural gas and EV net zero grid scenarios (−$57 billion and −$76 billion per year respectively compared to baseline).
The avoided GHG emissions from road transportation sector and increased emissions from power sector when charging with coal or natural gas power plants are detailed in table S4 in the SI. We find that GHG emissions avoided with 30% uniform EV penetration are ∼55 Mt per annum from the road transportation sector. The power sector emission increases vary based on the scenarios. For the power sector, we use CO2 emissions intensity (in ton year−1) from Sengupta et al [56] (data S1) for different power plant types. Compared to the baseline, we find for the EV current grid, EV natural gas and EV net zero grid scenarios, the overall net avoided GHG emissions are positive (∼21 Mt, ∼29 Mt and ∼55 Mt respectively). For the EV coal scenario, the overall net avoided GHG emissions are negative (∼−4 Mt) indicating charging vehicles entirely with coal generation has higher damages from both climate change and air pollution perspectives. We estimate the annual external damages associated with climate using the average of the damages from use-phase emissions for each of the vehicle type (two-wheelers, three-wheelers, four-wheelers, and buses), in cents km−1, from Peshin et al [21] multiplied by the distance traveled. For the electrification scenarios, we use CO2 emissions intensity (in ton year−1) from Sengupta et al [56]. We assume a SCC of $50 per ton of CO2 (tCO2). We also parametrically test the effect of assuming $35 tCO2 −1 and $100 tCO2 −1 [81, 82]. The road transportation associated costs are taken as shown in table S5 [21]. We find that electrifying vehicles using the current electricity grid reduced climate change damages (by −$0.6 to −$1.9 billion) (table S6). While it increases air pollution damages (+$0.1 to +$0.5 billion) given the large share of coal in the current electricity generation mix (figure 3). Improvements in both climate and health damages are found in vehicle electrification scenarios when the charging is done with natural gas power generation or when the grid is powered by non-emitting sources. In figure S8 in the SI, we show contour plots showing the total estimated damages from both climate change and air pollution at different levels of SCC and VSL. When considering both climate change and air pollution, and under our base case set of assumptions we find that total damages are US$ 14.1 billion (lower estimate: US$ 8.8 billion, higher estimate: US$ 28.4 billion) (figure 3).

Figure 3. Estimated annual climate and health damages (billion$2020) for baseline and EV scenarios for road transportation in India. Central estimate (cyan-colored bars for climate changes damages and fuchsia-colored bars for air pollution damages) are with VSL taken as $161 000 (income elasticity: 1.2) and SCC as $50 tCO2 −1. Lower estimate (shown with black star) refers to VSL $79 000 (income elasticity: 1.4) and SCC of $35 tCO2 −1. Higher estimate (shown with blue star) refers to VSL $327 000 (income elasticity: 1.0) and SCC of $100 tCO2 −1.
Download figure:
Standard image High-resolution image3.5. Socio-economic parameters and disparity regarding the change in PM2.5 concentration
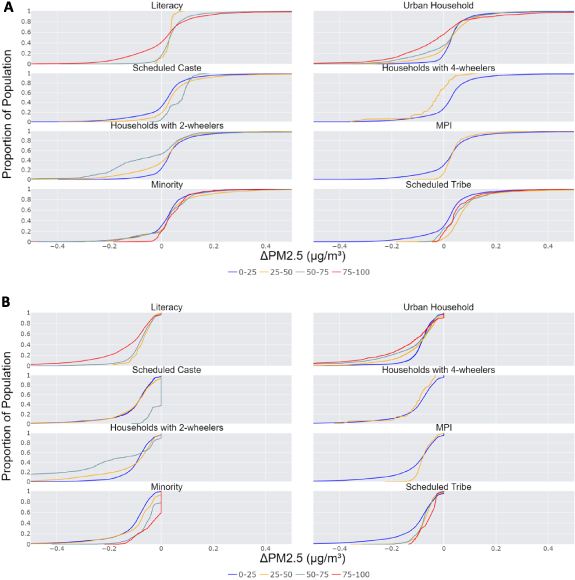
In figure 4(A), we show the change in PM2.5 concentration for the EV current grid scenario with reference to eight socio-economic variables. From the air pollution modeling simulations, the entire region of India is divided into ∼27 220 grid cells with varying population sizes. We discretized the district level census data to match the size of these grid cells and determined the socio-economic characteristics associated with each grid cell. The four lines represent the proportion of population that lie within the groups binned by percentage of a specific characteristic in a grid cell ('0%–25%', '25%–50%', '50%–75%', '75%–100%'). We find that under the current grid, electrifying 30% of the vehicle stock leads to 27% of the population experiencing a decrease in PM2.5 concentration (obtained by computing the number of people that lie to the left of the vertical 0 μg m−3 line) while the remaining 73% see an increase. People with high literacy rate that live in urban areas are generally less exposed to the negative consequences of electrification, while grid cells with majority of scheduled castes/tribes, poor and rural populations see an increase in PM2.5 exposure. Kerala, Karnataka, and Tamil Nadu are the states with majority of their populations having a decrease in PM2.5 concentration from transportation as vehicles electrify under the current electricity grid mix. Madhya Pradesh, Rajasthan, Uttar Pradesh, and West Bengal have a larger proportion of their population exposed to an increase in PM2.5 concentration than those that see a decrease. In figure 4(B), we show that, while there is still a distribution for the range of changes in PM2.5 exposure across the population, everyone enjoys a reduction in exposure to PM2.5 exposure. In figure S9 in the SI, we show the state-specific net domestic product (NSDP) along with change in air pollution attributable road transportation deaths (per 100 000 people) associated with the two vehicle electrification scenarios.
Figure 4. The proportion of population with a specific socio-economic characteristic as a function of the change in PM2.5 concentration. (A) EV current grid scenario; (B) EV net zero grid scenario. MPI refers to multidimensional poverty index explained in detail in the section 2.
Download figure:
Standard image High-resolution image
3.6. Electrifying the ten most populated Indian cities
We analyze the impact of electrifying 30% of road transportation vehicle kilometers traveled in the ten most populous cities in India (Mumbai, Delhi, Bengaluru, Hyderabad, Ahmedabad, Chennai, Kolkata, Surat, Pune, and Jaipur) [83] on premature mortality. We use a similar methodology as described in the section 2 where we first run a baseline scenario using emissions inventory from EDGAR v5.0, MEGAN v2.1, NCAR (FINN) v2.5 which includes anthropogenic, biogenic and fire sources respectively [39–43] and then for the EV current grid and EV net zero grid scenarios for cities, we decrease the road transportation emissions by 30% specifically in the grid cells associated with the ten most populous cities and increase the power sector emissions based on the grid characterization scenario. The current grid would need to produce about 0.83% more electricity annually to meet the charging needs, as shown in table S7. Under the current grid electricity generation mix, eight of the ten cities (excluding Kolkata and Chennai due to high-emitting thermal power plants in these areas) showed a decline in PM2.5 concentration as road transportation is electrified (figure S10 in the SI). This means reduction in air pollution due to vehicle electrification provides a net benefit to urban populations compared to populations living closer to power plants which see an increase in pollution exposure. Under a future grid with no emissions, all cities see a reduction in PM2.5 concentration. In terms of premature mortality, the states of Delhi, Maharashtra, and Karnataka (which include the three most populous cities in India: Delhi, Mumbai, and Bengaluru, respectively) showed the most improvements in health impacts in both scenarios as shown in figure S11.
3.7. Estimating premature mortality based on India's 2030 goals
At 26th United Nations Climate Change Conference (COP26), India announced highly ambitious goals of having 500 GW of non-fossil capacity and meeting 50% of energy requirements from renewables [84–88]. We reviewed the recent studies that estimate India's national average grid emission factors in 2030 [84–88] as shown in table S8. We find the average grid emission factor to be ∼473kgCO2 MWh−1 across the four studies. To determine state-level emission factors, we assume that they decrease by the same ratio as the current national grid average used in the EV current grid scenario. We find that if India does achieve its targets set for 2030, there are still 17 states which see an increase in premature mortality if we are to electrify 30% of the road transportation vehicle kilometers traveled. Overall, we find an increase of 600–1000 premature deaths in India based on the 2030 grid as shown in figure S12 in the SI.
4. Limitations
This study makes use of a reduced-complexity air quality model, which is generally less accurate than a chemical transport model. Prior Global InMAP simulations of total PM2.5 concentrations have predicted concentrations in the Indo-Gangetic Plain that are lower than measurement data [89, 90] as shown in figures S1 and S13. This likely results from a combination of the model inputs (such as low emission in inventories from certain sectors) [91, 92] or episodic events such as biomass burning that may not be well captured in annual averaged concentrations [32]. When evaluated against other models in South Asia for estimating changes in PM2.5 concentrations, Global InMAP performs relatively well (population-weighted normalized mean error of 44.4%–59.4%) across a range of emission scenarios [32], highlighting its potential to estimate air quality health impacts for policy decisions in the region. Despite these modeling limitations, our estimate of premature mortality for the baseline scenario from all sources (figure S5) is in the range estimated by other recent studies [9, 11]. Exposure levels are high enough in these heavily polluted areas of Indo-Gangetic plains that even underestimates of 20–30 μg m−3 do not significantly affect the relative risk of diseases due to non-linear concentration–response functions. In our EV counterfactual scenarios, we also take simplifying assumptions of uniform 30% penetration of EVs across all regions although the uptake of EVs will vary across locations, populations and vehicle classes. For example: electric two-wheelers and three-wheelers have shown a higher adoption contributing to ∼95% of new registered EVs in India compared to electric four-wheelers and buses [63]. The location and population specific adoption implications we have tried to address through our ten most populous city-specific adoption scenarios which show majority of the cities showing a decline in PM2.5 concentration and health impacts compared to populations living closer to power plants which see an increase in exposure.
5. Discussion and conclusions
Our results underscore the requirement of moving toward a sustainable electricity grid that emits less GHGs and air pollutants as to make a widespread transportation electrification case for India. These results are in alignment with studies that have looked at China (similar population size [93], EV targets [94], current electricity grid mix [30] and ambient air pollution attributable deaths [45]) where authors found the need for continued emission reductions in the power generation sector to have greater human health and economic benefits [95–97]. India relies heavily on coal, which constitutes ∼53% of India's installed capacity [98] and 74% of total electricity generation [99]. Most plants operate with minimal pollution control strategies. The process of coal phaseout will likely take decades given the costs of changing the infrastructure and need for affordable electricity services to ensure the livelihood and quality of life of a large population. However, there are multiple strategies Government of India can take today at a relatively low cost: in December 2015, the government required all power plants to install pollution control equipment (flue gas desulfurization units) by the end of 2017. The deadline has since been extended twice, first to end of 2022 for all utilities to comply and now up to 2025 for utilities in less populous and polluting regions. It is anticipated that 70% of the plants may fail to meet the set standards in 2022 [100]. Given three-fourth of the coal power plants [101] in India are using inefficient sub-critical coal technology and are highly polluting, meeting set standards would be a first step toward responding to the air pollution crisis affecting the country. Power producers will have to invest 65 000–130 000 dollars per MW in air pollution control technologies [102]. This comes to ∼$20 billion based on current installed coal capacity [103] in India (taking central estimate of ∼$97 500 MW−1). Sengupta et al [56] show that if plants establish minimal sulfur controls to meet Indian emissions norms, we could see a decrease in 79% of sulfur emissions with only ∼1% increase in annual variable costs. They also compute variable costs of control (₹20–₹100 MWh−1) to be less than the ₹50–₹200 MWh−1 penalties proposed by the Government of India for noncompliant plants, which suggests that plants are better off adopting control technology to avoid penalties in the dispatch order with the larger societal benefit of reducing current premature mortality levels. From our results, we determined that with 30% EV penetration and net zero grid used for charging, we could reduce annual health damages by $1.2–$4.8 billion per year compared to EV coal scenario (∼7% of total electricity required from coal plants).
From the economics perspective, recent studies have shown that ∼25%–50% of India's coal fleet has higher variable costs than the levelized costs of solar plants [104, 105]. This means the Indian government can save money at least in some locations by decreasing its reliance on relatively expensive coal power plants running at the margin with low-cost renewable energy. Displacing comparatively inexpensive coal plants will however also require investments into storage technology or other fast ramping generation to deal with the temporal-variability issues that come with renewables.
The transition to cleaner energy sources may have important implications that may disproportionately impact the low-income communities, notably in the states of Jharkhand, Odisha, Chhattisgarh, Bihar, and West Bengal where majority of the coal production is concentrated. Scholars have highlighted the need for policies and programs that could include skill training programs, income support, and investments in schools and universities in communities in and around plants and mines which are planned for closure [106, 107].
Finally, reducing India's air pollution related health issues will also contribute to emissions reductions from GHGs, and thus with climate change mitigation.
Acknowledgments
Funding for this work comes from Stanford's TomKat Center for Sustainable Energy. This work was also supported by funding from the Department of Energy Science & Engineering and Stanford Doerr School of Sustainability at Stanford University.
Data availability statement
All data that support the findings of this study are included within the article (and any supplementary files).
Supplementary data (0.5 MB XLSX)
Supplementary data (<0.1 MB XLSX)
Supplementary data (<0.1 MB CSV)
Supplementary data (1.5 MB PDF)