

Abstract
As developing countries like Nigeria strive to reduce carbon emissions while expanding energy access, mini-grids' role has gained recognition. However, limited analysis exists regarding the role of interconnected mini-grids (IMGs) in the transition to net-zero emissions electricity generation systems. Here, we employ a bottom-up energy system optimization modeling framework to explore the techno-economic implications of deploying IMGs in net-zero emissions electricity systems, using Nigeria as a case study. We find that IMGs can contribute to modest system-level cost reductions in net-zero emissions electricity systems. IMGs can help minimize stranded electricity generation assets and decrease the reliance on negative emissions technologies in scenarios aiming for net-zero emissions electricity systems by 2050. In scenarios where the net-zero target is delayed until 2070, the widespread deployment of comparatively affordable cleaner generators and the phaseout of fossil fuel power plants may render negative emission technologies unnecessary. The model results further indicate that IMGs can help reduce the use of captive diesel/gasoline gen-sets quickly, and nuclear power has a role in the electricity generation mix in all net-zero emissions scenarios. Moreover, in order to achieve the median per capita electricity consumption observed in high-income countries by the year 2050, Nigeria must undertake a formidable expansion of its current electricity generation capacity at a rate approximately six times greater than that dictated by a business-as-usual trajectory. The study also provides recommendations to address the policy, regulatory, and financial considerations crucial for implementing IMGs successfully.

Original content from this work may be used under the terms of the Creative Commons Attribution 4.0 license. Any further distribution of this work must maintain attribution to the author(s) and the title of the work, journal citation and DOI.
1. Introduction
Access to reliable and affordable electricity is a fundamental catalyst for economic growth, social development, and the overall well-being of communities. However, in many developing countries, such as Nigeria, the challenge of providing universal access to electricity persists (Dioha et al 2022, IEA 2023). This lack of access to electricity is a significant barrier to economic and social development, hindering the growth of businesses and limiting access to education, healthcare, and other essential services (Dioha and Emodi 2019, Emodi et al 2022, Shari et al 2022). However, Nigeria is making progress towards increasing electrification rates through various initiatives and programs, such as expanding and promoting off-grid solutions like solar-based mini-grids (REA 2018).
Nigeria has the largest number of people without access to electricity worldwide, and at the same time, it has one of the largest markets for mini-grid development in the world (USAID 2022, The Energy Progress Report 2023). This paradox points to the potential of mini-grids to provide electricity access for a substantial number of the 35% of Nigerians that do not have access to electricity. Nigeria, the most populous country in Africa, faces significant hurdles in its pursuit of sustainable energy systems, exacerbated by the need to reduce greenhouse gas emissions and mitigate the effects of climate change (Dioha et al 2019, Bugaje et al 2022). Achieving a deeply decarbonized electricity system requires a comprehensive and integrated approach that utilizes diverse energy sources, including renewable energy technologies (Dioha and Kumar 2020b, Abraham-Dukuma et al 2021, 2020). Among the various solutions, mini-grids have emerged as a promising alternative to central grid expansion, particularly in remote and underserved areas.
Mini-grids are localized electricity generation and distribution systems that can operate independently or be interconnected with other mini-grids and the main grid. From a system-level perspective, the operational mode of mini-grids can influence how valuable they could be in electricity-generating systems. Mini-grids can be installed as stand-alone systems or as interconnected mini-grids (IMGs). IMGs are small-scale power systems connected to one another, allowing them to share resources and optimize electricity generation and distribution. These mini-grids can be connected to the national grid, and they mostly rely on renewable energy sources such as solar to generate electricity. Today, over 95% of the mini-grid installations in Nigeria are stand-alone systems.
The Nigerian Rural Electrification Agency (REA) is investing heavily in mini-grids. The REA had secured a US$350 million loan from the World Bank to support the Nigerian Electrification Project (NEP) (REA 2018). It is expected that US$150 million of the total amount earmarked for NEP will be dedicated to developing mini-grid systems across the country. While mini-grid solutions help to improve energy access at the subsistence level, often, the quality and costs of mini-grid power systems are inferior and relatively expensive compared to central-grid power systems (Blimpo and Cosgrove-Davies 2019). On account of these issues, some analysts argue that many households and businesses prefer to be grid-connected whenever they get the opportunity (RMI 2018, Wen et al 2023). This scenario suggests that there could be a convergence of mini-grid and central-grid in Nigeria and SSA in general under an IMG electrification planning framework (Agelebe and Igwe 2020, Dioha and Mutiso 2023).
While evaluating the relevant literature, it was observed that there exists several research on the potential of mini-grids in different electricity system configurations (Kaabeche and Ibtiouen 2014, Maleki and Askarzadeh 2014, Baneshi and Hadianfard 2016, Moner-Girona et al 2016, Ramli et al 2016, Das et al 2017, Shahzad et al 2017, Ahmad et al 2018, Chang et al 2021, González-García et al 2022, Guillou and Girard 2023). Detailed reviews of hybrid renewable energy system considering mini-grids are presented in Bhattacharyya(2018), Come Zebra et al (2021). A holistic assessment of current academic research and existing reviews reveals a noticeable gap in knowledge concerning the role of IMGs within the framework of a net-zero emissions electricity system, specifically from the perspective of an African country. Although existing studies offer valuable insights into the techno-economic aspects of mini-grids, they lack clear evidence regarding the role of IMGs in net-zero emissions electricity systems, especially when considering various decarbonization timelines and electricity demand goals.
A review of the potential of IMGs in Nigeria suggests that the unreliable nature of electricity supply in Nigeria requires a pragmatic introduction of IMG systems to increase the number of sufficient hours of supply to customers (Akinlabi and Oladokun 2021). However, IMGs are yet to be widely adopted by Nigerian energy stakeholders. Given the substantial number of mini-grids present in Nigeria and the desire for central-grid power, policymakers and regulators have to decide how to allow for the cost-effective interconnection of mini-grid assets in cases where the national grid arrives to an area formerly served by a mini-grid or vice versa. Recent government-endorsed scenario studies into Nigeria's energy future have been carried out, including the National Energy Master Plan, the Nigeria energy transition plan, and Nigeria's renewable energy roadmap (NREmap) (Dioha 2022, ECN 2022, IRENA 2023). NREmap envisions the addition of 165 GW of new installed capacity by 2050, of which 115 GW alone will come from solar PV through a mix of technologies, particularly mini-grids that have gained significant traction recently.
At the same time, Nigeria's economy is closely tied to oil and gas exports, with profits from oil currently accounting for 95% of the country's total export revenue (Nwuke 2021). The country's centralized electricity generation mix is also dominated by fossil fuels, with natural gas accounting for over 80% of the total installed capacity. The decentralized generation system is almost entirely powered by fossil gasoline and diesel-based generators (Tambari et al 2020). Nonetheless, Nigeria has shown commitment to the global efforts towards combating climate change. At the COP26 climate summit, Nigeria announced that it was committing to carbon neutrality in 2060 and later released the country's national energy transition plan highlighting the scale effort required to achieve this target (Dioha 2022). Also, Nigeria's significant underserved population and its aspirations for development underscore the country's primary focus on prioritizing growth. It is evident that Nigeria's electricity consumption will inevitably rise in the coming years, driven by its strong desire for socioeconomic progress and projected population growth.
Achieving Nigeria's insufficient generation and transmission capacity alongside the country's climate goals would require a substantial transformation of the country's electricity sector. This is reflected in recent national energy policy and strategy documents that stress three key objectives: universal electrification by 2040 while simultaneously phasing out all diesel/petrol generators; grid capacity expansion through the increasing development of alternative energy sources and achieving country-wide net zero emissions by 2060 in its energy transition plan (Roche et al 2020, Dioha 2022). While there is a growing body of literature investigating Nigeria's energy challenges (Ugwoke et al 2020), this paper explores fundamental questions at the intersection of improved energy access, electricity sector decarbonization, and the role of IMGs.
The central questions addressed in this paper are thus:
- What technology choices are cost-optimal for Nigeria in the context of achieving a net-zero emissions electricity system in different target years?
- What would be Nigeria's required electricity generation capacity within a net-zero emissions system considering different electricity demand scenarios?
- What is the role of IMGs in Nigeria's net-zero emission electricity system?
To address these questions, this study utilizes the TIMES (The Integrated MARKAL-EFOM System) model to analyze Nigeria's electricity system, exploring scenarios for net-zero emissions by 2050 and 2070 under varying electricity demand assumptions. The focus is on assessing the role of IMGs and other generators in achieving net-zero targets, without delving into detailed market operations and tariffs. The analysis, considering total capacity, system-level cost, fuel use, and CO2 emissions, highlights IMGs' role in accelerating energy transition, especially relevant for Nigeria due to its energy demand, access deficit, net-zero commitment, and large mini-grid market.
2. Methods
2.1. The TIMES modeling framework
The broad methodological framework used in this study is presented in figure 1. We employ the International Energy Agency's Energy Technology Systems Analysis Programme—TIMES (The Integrated MARKAL-EFOM System)—modeling framework for this study. TIMES is a partial equilibrium model which has the advanced characteristics of the Energy Flow Optimization Model (EFOM) 4 . Developed as the successor to MARKAL (MARket ALlocation) model, TIMES has gained significant recognition and has been widely adopted by approximately 250 institutes in over 70 countries. TIMES is a bottom-up, linear programming energy modeling framework that enables the computation of an economic equilibrium for energy markets, spanning from energy supply to end-use energy services. TIMES can also be used to construct detailed sectoral models, such as the electricity supply system model. By accounting for energy flow and prices, the model ensures that energy suppliers produce precisely the amount of energy required to meet the demand. This demand-driven approach allows for the simultaneous computation of energy flows and prices, aligning supply with demand.

Figure 1. General methodological framework. BD2050 and BD2070 represent a cluster of net-zero scenarios using the baseline demand (BD) for electricity projections in 2050 and 2070. AD2050 and AD2070 refers to a cluster of net-zero scenarios using the ambitious demand (AD) for electricity projections in 2050 and 2070.
Download figure:
Standard image High-resolution imageThe objective function of the TIMES model (equation (1)) aims to minimize the total discounted cost of the energy system while adhering to various technical and environmental constraints defined within the model. In essence, this objective function maximizes the net total surplus, which encompasses both consumers' and producers' surpluses.
where NPV represents the objective function of TIMES (i.e. the net present value of the total cost of the system/region); R the number of systems/regions; YEARS the set of years in the model for which there are costs; the discount rate; REFYR the reference year for discounting; and the total annual cost in system/region r and year y.

The TIMES model generates several key outputs that contribute to energy systems analysis. These outputs include the deployment of energy technologies, quantification of resource-wise energy requirements, projections of future technology investments, and estimation of environmental emissions at each time period. The selling point of TIMES lies in its combination of a comprehensive database that includes detailed technological information and an economically optimizing solver. This powerful combination allows the model to generate robust energy policy scenarios over extended periods and provide strategic guidance for long-term policy development. The full technical description of TIMES is available in Loulou et al (2016). TIMES source code is publicly available at https://github.com/etsap-TIMES/TIMES_model.
2.2. Development of a capacity expansion model for Nigeria
The Nigerian electricity supply system is modeled with TIMES. The developed reference energy system (RES) for Nigeria's power sector is given in figure 2. This RES encompasses the entire spectrum of energy activities, spanning from energy sources to the ultimate end-use energy demand. The electricity demand stands out among the various types of input data mentioned earlier because it is considered the primary driving factor for the model (see section 2.2.1). Our model is a single region that employs a discount rate of 10% (Dioha and Kumar 2020b, IRENA 2023). Our modeling timeframe spans from 2020 to 2070. The temporal resolution of the model incorporates a detailed representation of seasonal variations, averaged hourly load patterns, and the inherent supply fluctuations of renewable resources such as solar and wind. Overall, the model consists of 48 time slices to account for the two main seasons in Nigeria (dry and wet) and the 24 hourly load of an average day in the two seasons. Each slice represents the hourly load throughout an average day in these seasons. We believe that by examining the 24 h load profile, we effectively capture peak demand periods. However, it is important to acknowledge that daily variations exist even within the same season, potentially leading to blind spots in specific peak periods. Including peak demand explicitly in the time period sampling would have required additional granularity in the analysis, potentially leading to a more complex model. The model includes both non-renewables (such as natural gas and nuclear) and renewables (such as solar, wind, hydro, and biomass). These energy carriers serve as inputs for electricity supply technologies.

Figure 2. The model's reference energy system.
Download figure:
Standard image High-resolution imageTable 1 outlines fuel prices, while table 2 details the techno-economic parameters of various energy conversion technologies used in Nigeria's power sector model. This model includes technologies for converting primary energy into electricity, like hydro, natural gas, biomass, nuclear, solar, wind, battery storage, and infrastructure for transmission and distribution. The transmission system consolidates electricity from all grid-connected plants, while the distribution system allocates electricity to different sectors. The model also integrates off-grid systems, including captive oil generators and mini-grid solar PV systems. Particularly, IMGs are modeled as flexible entities that receive and supply electricity to the distribution system, addressing high and low demand periods. They also directly power various sectors such as residential, commercial, and agriculture. This comprehensive representation allows for a more nuanced understanding of how IMGs interact within the broader energy infrastructure. Tables 3 and 4 show the techno-economic parameters of the transmission and distribution technologies and carbon emission factors, respectively.
Table 1. Projection of fuel prices (US$/GJ).
| Fuel | 2020 | 2030 | 2050 | 2070 |
|---|---|---|---|---|
| Natural gas | 7.1 | 7.8 | 9.9 | 9.9 |
| Biomass | 1.6 | 1.6 | 1.6 | 1.6 |
| Oil | 14.7 | 17.3 | 23.6 | 30 |
| Uranium | 0.28 | 0.28 | 0.28 | 0.28 |
Data source: NEA and IEA (2020), Dioha and Kumar (2020b), Allington et al (2023).
Table 2. Assumptions on techno-economic parameters of conversion technologies.
| Technology | Investment cost (USD/kW) | Fixed O&M cost (USD/kW-yr.) | Annual availability factor | Lifetime (Years) | Efficiency | Start year for new capacity | |||
|---|---|---|---|---|---|---|---|---|---|
| 2020 | 2030 | 2050 | 2070 | ||||||
| Gas—CCT | 1221 | 1171 | 1072 | 973 | 16.0 | 0.60 | 35 | 0.47 | 2020 |
| Gas—SCT | 799 | 764 | 694 | 694 | 12.0 | 0.80 | 35 | 0.32 | 2020 |
| Gas + CCS | 2845 | 2200 | 2000 | 1800 | 28.9 | 0.80 | 35 | 0.47 | 2040 |
| Large hydro | 3000 | 3000 | 3000 | 3000 | 21.9 | — | 45 | — | 2020 |
| Small hydro | 3319 | 3306 | 3279 | 3252 | 25.8 | 0.60 | 40 | — | 2020 |
| Solar PV—utility | 1378 | 886 | 723 | 560 | 11.0 | — | 25 | — | 2020 |
| Solar thermal | 5797 | 4929 | 4295 | 3660 | 178.0 | 0.86 | 25 | — | 2035 |
| Solar PV—minigrid | 4320 | 2700 | 2091 | 2091 | 86.0 | — | 25 | — | 2020 |
| Wind | 1730 | 1528 | 1126 | 723 | 60.0 | — | 25 | — | 2020 |
| Nuclear | 6137 | 6137 | 6137 | 6137 | 91.3 | 0.85 | 60 | 0.33 | 2035 |
| Biomass | 2534 | 2453 | 2291 | 2129 | 64.0 | 0.60 | 30 | 0.31 | 2025 |
| Oil | 750 | 750 | 750 | 750 | 23.0 | 0.30 | 8 | 0.16 | 2020 |
| Battery storage—4 h | 1287 | 532 | 307 | 290 | 26.0 | 15 | 0.85 | 2030 | |
Data source: Cole and Frazier (2019), Dioha and Kumar (2020b), U.S. Energy Information Administration (2022), Allington et al (2023).
Table 3. Techno-economic assumption of transmission and distribution technologies.
| Technology | Capital sost ($/kW) | Variable sost ($/GJ) | Operational life (years) | Efficiency (2020) | Efficiency (2030) | Efficiency (2050) | Efficiency (2070) |
|---|---|---|---|---|---|---|---|
| Electricity transmission | 365 | 0.0001 | 50 | 95% | 95% | 95% | 95% |
| Electricity distribution | 2502 | 0.0001 | 70 | 91% | 92% | 94% | 94% |
Table 4. Emission factors.
| Fuel | Emission factor (ktCO2/PJ) |
|---|---|
| Biomass | 100 |
| Coal | 94.6 |
| Oil | 73.4 |
| Natural gas | 56.1 |
Data source: Dioha and Kumar (2020b), Allington et al (2023).
2.2.1. Electricity demand
Nigeria's baseline future electricity demand was recently evaluated in a comprehensive bottom-up study—NREmap—by the International Renewable Energy Agency (IRENA) in collaboration with the Energy Commission of Nigeria. The study showed that Nigeria's electricity demand could increase from 113 TWh in 2020–520 TWh by 2050 (IRENA 2023). The study projected electricity demand across various demand sectors, including the residential, industry, commercial, transport, and agriculture sectors. A linear extrapolation of the IRENA's electricity demand projection has been done to 2070. Thus, future electricity demand is expected to increase to 876 TWh by 2070 at a compound annual growth rate (CAGR) of 4.2%. Figure 3 shows the projected baseline sectoral electricity demand for the modeling period (2020–2070).
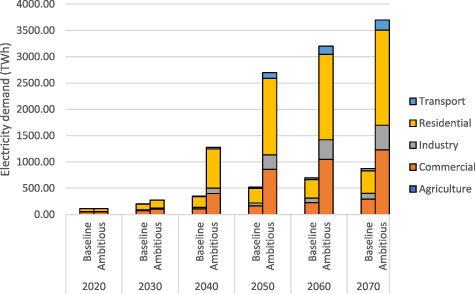
Figure 3. Sectoral electricity demand forecast under the Baseline and Ambitious demand scenarios.
Download figure:
Standard image High-resolution imageIRENA's electricity demand projection shows that by 2050, Nigeria's per capita electricity demand could reach 1296 kWh (IRENA 2023). This value is less than half of the current global average of 3152 kWh and is even more insignificant when compared to OECD and US current consumption levels (7992 kWh and 12 573 kWh, respectively) (Blimpo et al 2023). However, this electricity consumption level of Nigeria largely undermines Nigeria's developmental needs and the central role of electricity as a precursor for socioeconomic development in the modern era. For this reason, the Energy for Growth Hub proposed a modern energy minimum (MEM) of 1000 kWh per capita as a minimum threshold to spur competitive economic growth (Moss et al 2021).
To reflect Nigeria's development aspirations for industrialization, employment, higher incomes, prosperity, and economic transformation, we developed a second electricity demand forecast that envisages ambitious growth driven by relatively higher per capita electricity consumption. Per capita, electricity consumption generally grows as a function of per capita income (Wiedenhofer et al 2013, Wu et al 2019). To estimate the future electricity demand under this ambitious demand (AD) case, we apply similar understandings and assume that there is a relationship between the distribution of income and electricity consumption for a given country (Kemp-Benedict et al 2013, Fouquet 2014, Oxfam 2015, Csereklyei 2020). Given the paucity of national-level income data, we used per capita GDP as a proxy for per capita income (Diacon and Maha 2015, Dioha and Kumar 2020a). Nigeria's GDP data was obtained from the World Bank. The Nigerian population data in this study was obtained from the United Nations' world population prospects (United Nations 2019). The percentile-level national income distribution data were obtained from OXFAM's study of global carbon inequality (Oxfam 2015).
Using the OXFAM's national income percentiles and methods (Oxfam 2015), we calculate the GDP of each percentile. Using the GDP of each percentile, we calculate the fractional share of each percentile's contribution to the national GDP. Next, we calculate the cumulative population of each percentile and their corresponding per capita GDP. To convert the national income distribution data into electricity consumption distributions, we calculate the index value of each percentile distribution (equation (2)). To allow an elastic relationship to exist between electricity consumption and income, we assigned Nigeria income elasticity of electricity demand of 0.513 (Babatunde and Shuaibu 2011), which is then used to determine an elastic income distribution index (equation (3)). The elastic income distribution index is then converted into a synthetic distribution of electricity consumption as per equation (4),
where is the index value for percentile


where is the elastic distribution index value for percentile , and is the income elasticity of electricity demand,


where is the per capita electricity consumption distribution, the per capita electricity consumption by each percentile's elastic index, and the average value of the elastic distribution index.


From equation (4), we derive the distribution of electricity across each national percentile and the corresponding per capita electricity demand. From this electricity consumption distribution, we calculate the total number of people living below the MEM and then quantify the implications of the additional energy needed to lift them to the MEM's value (1000 kWh) by 2030 and the median for high-income countries (6720 kWh) by 2050 (Moss et al 2021). The projected electricity demand is split across sectors using IRENA's study's percentage share across each sector (IRENA 2023). Figure 3 shows the projected ambitious sectoral electricity demand for the modeling period (2020–2070).
2.3. Scenarios description
We build the scenarios based on two electricity demand clusters: baseline demand (BD) and ambitious demand (AD). Nigeria's climate change act envisions the country achieving net-zero emissions energy system between 2050 and 2070 (Climate Action Tracker 2022). We construct four scenarios for each of the two electricity demand clusters based on Nigeria's climate target. Accordingly, we build scenarios to explore the implications of achieving a net-zero energy system by 2050 and by 2070, with and without IMG, resulting in a total of eight scenarios, as summarized in table 5. The selection of different net zero target years aims to facilitate the analysis of the techno-economic implications of different net zero targets under a range of grid configurations. We assume that the emission factors and energy prices will remain constant in all these scenarios.
Table 5. Scenario description.
| Scenario cluster | Scenario name | Description |
|---|---|---|
| Baseline demand (BD) this represents a cluster of net-zero scenarios using the baseline energy demand projections. | BD2050 | Constraint on emissions to reach net-zero by 2050 with baseline electricity demand. No interconnected mini-grid. |
| BD2070 | Constraint on emissions to reach net-zero by 2070 with baseline electricity demand. No interconnected mini-grid. | |
| BD2050-IMG | Connection of mini-grids to the central grid and constraint imposed on emissions to reach net-zero by 2050 with baseline electricity demand. | |
| BD2070-IMG | Connection of mini-grids to the central grid and constraint imposed on emissions to reach net zero by 2070 with baseline electricity demand. | |
| Ambitious demand (AD) this represents a cluster of net-zero scenarios for an ambitious electricity demand where the universal target is the delivery of a sufficient quantum of clean energy guided by the MEM target (1000 kWh/capita) by 2030, and the median for high-income countries (6720 kWh/capita) by 2070. | AD2050 | Constraint on emissions to reach net-zero by 2050 with ambitious electricity demand. No interconnected mini-grid. |
| AD2070 | Constraint on emissions to reach net-zero by 2070 with ambitious electricity demand. No interconnected mini-grid. | |
| AD2050-IMG | Connection of mini grids to the central grid and constraint imposed on emissions to reach net-zero by 2050 with ambitious electricity demand. | |
| AD2070-IMG | Connection of mini-grids to the central grid and constraint imposed on emissions to reach net-zero by 2070 with ambitious electricity demand. |
In the TIMES model, to better align with real-world conditions, we introduce constraints on the technology uptake, acknowledging that factors beyond cost could influence technology adoption. Consequently, existing technologies are retained until their scheduled retirement period, while the start year for investing in new technologies is specified in table 2. In order to ensure the reliability of our scenarios, upper limits were set for the installed capacities of different technologies by 2050. These assumptions are based on the documentation of Nigeria Energy Calculator 2050 (ECN 2015), NREmap and expert judgment (IRENA 2023).
3. Results and discussion
The TIMES model (detailed in the Methods section) was used to determine the lowest-cost electricitysystems configurations that deliver the eight sets of net-zero electricity generation transition scenarios illustrated in table 5. The analysis focuses on assessing the changes in the total installed capacities, electricity generation mix, and, particularly, the role of IMGs under baseline and ambitious electricity demand scenarios. Given the large number of scenarios explored in this research, we present the essential findings and highlight key observations. Raw numerical results for each scenario are provided in the supplementary files (SI). Moreover, specific scenarios are selectively discussed when they offer valuable insights or serve to emphasize critical aspects of the study.
3.1. BD scenario cluster
3.1.1. Capacity and generation of the BD scenarios
In figure 4, the total capacity requirements for all four-BD scenarios are presented, showcasing the contrasting outcomes when considering the interconnection or not of mini-grids. As electricity demand is projected to rise sharply in the modeled years, this will necessitate a substantial increase in both installed capacity and electricity generation, far exceeding current levels. To meet this demand, Nigeria's electricity system is projected to undergo a significant expansion: from an initial capacity of 35 GW in 2020 to an estimated 203 GW by 2050 in the BD2050 scenario. In the BD2070 scenario, the required capacity is projected to reach 157 GW by 2050. Further, by the year 2070, the total installed capacity is expected to increase to 268 GW in the BD2050 scenario and to 282 GW in the BD2070 scenario.

Figure 4. Electricity generation capacity (GW) by technology under the baseline demand scenario cluster.
Download figure:
Standard image High-resolution imageTo align with the net-zero goal by 2050, Nigeria needs to increase electricity generation by 4.7 GW annually, a figure that rises slightly to 4.9 GW for a 2070 target. The BD2050 scenario requires a more rapid build out due to the higher deployment of solar PV with low availability factors, necessitating greater capacity and faster battery storage deployment.
The inclusion of IMGs yields higher cumulative capacity expansions, reaching 308 GW and 326 GW by 2070 in the BD2050-IMG and BD2070-IMG scenarios, respectively. This capacity differential relative to the scenarios without IMGs is predominantly attributable to substantially larger additions of battery storage and utility-scale solar PV. The rise in capacity investment in all scenarios relative to the base year presents notable implications in a context like Nigeria where constraints on capacity or capital investments are prevalent. The additional capacities required imply higher initial capital outlay and increased complexity in managing a more diverse energy system, challenging Nigeria's financial and infrastructural capabilities. Strategic planning and support mechanisms may be required to manage these increased investments without hampering the overall goal of decarbonization.
The model projects a near doubling of annual battery storage and utility-scale solar PV additions in scenarios with IMGs, significantly reducing curtailment and enhancing the efficiency of renewable energy utilization. Furthermore, the oil (diesel and petrol) backup generator phaseout is expected to be completed by 2040 in all scenarios, with a faster retirement rate in scenarios with IMGs. Similar insights were derived from Sachiko Graber et al (2020), and Green Energy Investment (2020), who opined that IMG customers could benefit from better, more reliable, cost-effective electricity service.
In all BD scenarios, a rise in thermal power generation, particularly from combined cycle gas turbines (CCGTs), is expected, peaking at 13.8 GW around 2030–2035. Meeting the net-zero target by 2050 would require the early decommissioning of CCGT and biomass power plants. To offset this, the model suggests deploying 5.2 GW of CCGT with carbon capture and storage (CCS) in the BD2050 scenario. However, in the BD2050-IMG scenario, which integrates solar PV and battery storage, the need for CCGT + CCS is significantly reduced to only 0.3 GW. This is due to the flexibility and reliability provided by IMGs with solar PV and battery storage. As the goal shifts to achieving net-zero by 2070 in the BD2070 and BD2070-IMG scenarios, renewable energy options, thanks to decreasing costs, become more feasible, reducing the dependence on CCS technology. The model also finds feasibility to deploy at least 10 GW of nuclear capacity by mid-century in all four BD scenarios. This capacity grows rapidly, with an average of 0.5 GW per year, resulting in a minimum installed capacity of 24 GW by 2070 in the BD2070-IMG scenario. Nigeria has the ambition to embrace nuclear energy through the addition of 4 GW of nuclear capacity in Geragu, Kogi State (Bolodeoku 2021, Ewim et al 2022). Despite its strong supportive role in decarbonizing Nigeria's electricity system, the successful implementation and contributions of nuclear technology heavily rely on the level of domestic and international policy support (Dioha 2020, Dioha and Kumar 2020b).
To meet the Nigeria's electricity demand in the BD scenarios, total electricity generation is projected to increase eightfold from 121 TWh in 2020 to around 956–961 TWh in 2070 in the BD2050 and BD2070 scenarios (figure 5). The BD2050 scenario shows a quicker rise in electricity generation until 2050, after which a decrease is observed. By 2050, non-fossil sources like wind, solar PV, hydro, and nuclear will constitute about 87% of total electricity generation in the BD2050 scenario, compared to 78% in the BD2070 scenario. Fossil fuels, which accounted for 76% of the energy mix in 2020, are phased out by 2050 in the BD2050 scenario, while they still hold an 11% share in the BD2070 scenario. In both IMG scenarios, the share of non-fossil energy is pushed to 92% by 2050, driven by the accelerated deployment of utility-scale solar.

Figure 5. Electricity generation by fuel types for all baseline demand scenarios.
Download figure:
Standard image High-resolution image3.1.2. Emissions trajectories and fuel requirement of the BD scenarios
Figure 6 shows annual CO2 emissions for various scenarios, with electricity sector emissions peaking at 154 million tCO2 between 2020–2030, then declining. The net-zero by 2050 scenarios, BD2050 and BD2050-IMG, see significant CCGT + CCS deployment after 2050 for CO2 removal, with lower CCS use in BD2050-IMG due to mini-grids replacing CCS needs. In the 2070 scenarios, emissions consistently decrease at a 6% CAGR. Figure 7 outlines fuel requirements for natural gas, oil, biomass, and nuclear. Natural gas use decreases over time, peaking at 746 PJ between 2030–2040, then dropping as cleaner technologies are adopted. Even with CCGT + CCS, the BD2050 scenario would use over 250 PJ of natural gas by 2070, suggesting potential continued use of Nigeria's gas reserves with effective CCS implementation. Oil usage sharply declines in all scenarios, peaking at 1860–1866 PJ in 2025. Biomass use increases, peaking at 232 PJ in 2050 in the BD2070 and BD2070-IMG scenarios, but all biomass capacity retires by 2070 across all scenarios.

Figure 6. Emissions trajectories in all baseline demand scenarios.
Download figure:
Standard image High-resolution image
Figure 7. Natural gas, nuclear, biomass, and oil requirements in all baseline demand scenarios.
Download figure:
Standard image High-resolution image3.1.3. Total system cost of the BD scenarios
Table 6 presents the total discounted cost of the electricity system for the four BD scenarios. In general, achieving net zero will require very large investments, underlining the need for low-cost, long-term international climate finance, in the absence of which these investments would have to come at the cost of other sectors and public services, therefore, obstructing much-needed development. The total discounted system cost for both BD2050-IMG and BD2070-IMG scenarios are 510 and 509 billion USD, respectively, both ∼1% lower than their non-IMG counterparts. The total discounted cost for both net zero scenarios by 2050 (BD2050 and BD2050-IMG) experiences a minimal increment of only 1.1% in comparison to their 2070 counterparts (BD2070 and BD2070-IMG). As mentioned in section 3.1.1, this cost differential can be attributed to the faster deployment of new capacity of clean generating assets and early retirement of fossil assets in the BD2050 and BD2050-IMG scenarios. Similar cost differentials were found by (Panos et al 2023) who showed that postponing mitigation measures by a decade could lead to mitigation expenses for achieving a 2 °C target that closely resemble the costs needed to attain the 1.5 °C goal if initiated now.
Table 6. Total discounted cost of energy system.
| Scenarios | Total discounted cost of energy system (billion USD) | Cost difference with IMG scenarios (%) |
|---|---|---|
| BD2050 | 516 | 1.1% |
| BD2050-IMG | 510 | — |
| BD2070 | 515 | 1.2% |
| BD2070-IMG | 509 | — |
| AD2050 | 1022 | 1.1% |
| AD2050-IMG | 1016 | — |
| AD2070 | 1005 | 1.2% |
| AD2070-IMG | 1001 | — |
It is important to note that the choice of a discount rate is pivotal in such long-term investment analyses. The 10% rate used in our study is indicative of the current economic climate and risk profile in Nigeria. A lower discount rate, which might be justifiable should Nigeria's economic prospects improve, would significantly alter these findings. Specifically, it would increase the present value of future investment costs, making upfront investments in clean generating assets and IMGs appear more economically attractive.
3.2. AD scenario cluster
The AD cluster, as detailed in section 2.2.1 of the methodology, represents a series of experimental scenarios designed to address Nigeria's energy consumption deficit required to support its ambitious development goals within the framework of the net zero objectives.
3.2.1. Capacity and generation of the AD scenarios
To meet the median per capita electricity consumption of high-income countries by 2050, Nigeria requires a dramatic expansion in capacity, adding 27–32 GW annually—nearly six times higher than BD scenarios (figure 8). By 2070, under the AD2050 and AD2070 scenarios, total installed capacity would reach 1392 GW and 1538 GW, respectively. In these scenarios, IMG capacities are 8% higher than their counterparts, mainly due to substantial solar PV installations.

Figure 8. Electricity generation capacity (GW) by technology for all ambitious demand scenarios.
Download figure:
Standard image High-resolution imagePetrol and diesel generators are phased out earlier in all AD scenarios, consistent with the BD scenarios. For scenarios targeting net-zero emissions by 2050, CCGT capacity peaks at around 44 GW by 2035, contrasting with a delayed peak of about 107 GW for 2070 targets. In both AD2050 and AD2050-IMG scenarios, CCGT and biomass generation assets are abandoned by 2050.
In all four AD scenarios, a rapid deployment of CCGT equipped with CCS begins in 2050, in line with the higher renewable energy mix. The need for CCS diminishes when extending the net-zero target to 2070. As with the BD scenarios, IMG scenarios further reduce CCS deployment due to the economic advantages of solar power and battery storage.
Renewable energy technologies, particularly utility-scale solar PV, solar PV mini-grids, and battery storage, are pivotal in attaining the ambitious energy consumption target. Notably, utility-scale solar PV and battery storage demand expedited and substantial annual deployments of 9–10 GW and 4–7 GW, respectively. Similar to the BD scenario clusters, the model consistently prioritizes the accelerated deployment of battery storage in both IMG scenarios (AD2050-IMG and AD2070-IMG). This emphasis is particularly notable during the period from 2020 to 2050, with an average annual growth rate of approximately 7 GW of new battery storage capacity, a rate nearly double that observed in AD scenarios without IMGs. Investments in other non-fossil sources like CSP and nuclear are also significant, reaching 70 GW and 80 GW by 2070, respectively.
Nigeria's electricity generation must grow three-fold by 2030 to approximately 317 TWh, and by 2070, a thirty-four-fold increase to over 4000 TWh is necessary (figure 9). The AD scenarios heavily rely on CCGT + CCS from 2050 onwards, balancing ambitious electricity demand with emission constraints.

Figure 9. Electricity generation by fuel types for all ambitious demand scenarios.
Download figure:
Standard image High-resolution image
3.2.2. Total system costs of the AD scenarios
In table 6, we show the total discounted cost of the system over the modeling period for the four AD scenarios. Notably, despite the considerable increase in capacity additions in the AD scenarios compared to the BD scenarios, the total discounted cost is only twofold higher, between 1001–1022 billion USD. This outcome can be attributed to the substantial incorporation of cost-effective generation sources such as solar PV. Furthermore, it is important to note that, similar to the BD scenarios, the presence or absence of IMGs does not significantly impact the total investment costs in the AD scenarios.
It is, however, crucial to recognize that these investment costs may not accurately reflect the full range of system requirements and associated costs to achieve the ambitious energy transition goals outlined in the AD scenarios. This would require a more granular spatial and co-optimization modeling approach to account for the spatial distribution of renewable resources, transmission and distribution constraints, and the interplay between generation, storage, and grid infrastructure.
4. Conclusion
This study addresses the limited research on IMGs and their potential in creating a carbon-neutral energy system, particularly in the context of Nigeria's high-energy future. It offers new empirical evidence demonstrating that IMGs can significantly contribute to Nigeria's electricity system, both as a primary source and as a reliable backup in collaboration with the main grid in a carbon constrained-world.
The study finds that to achieve net-zero objectives by 2050, early retirement of fossil fuel assets, especially CCGT and diesel and petrol-fueled generators, is necessary. Incorporating IMGs into the energy mix reduces the reliance on negative emission technologies like CCS. IMGs, particularly when integrated with battery storage, offer a cost-effective and flexible solution for meeting net-zero commitments. This integration is crucial for a seamless transition to a more sustainable energy system. Although transitioning to a net-zero system by 2050 requires rapid generation capacity expansion, the associated cost increase is marginal (only 1% higher) compared to a delayed target of 2070. This suggests that ambitious decarbonization is feasible and affordable. However, substantial initial capital investments are needed, posing challenges in financing and resource mobilization. Conversely, a successful mobilization of these resources also presents an important opportunity for job creation and skill development in a country where record debt, sluggish economic growth and poor infrastructure and rapid population growth have led to high unemployment rates.
All scenarios showcase the important role of nuclear power as a key component in contributing to the Nigeria's net zero objectives. Achieving an ambitious energy demand future to increase access to productive power in a deeply decarbonized energy system would require a monumental capacity expansion, nearly six times faster than that based on the current BD forecast. However, this ambitious pursuit of electrification comes with an important tradeoff: the estimated cost, when considering the time value of money, is anticipated to be double that of scenarios that only meet baseline electricity demand projections.
Fundamentally, our analysis indicates that the role of IMGs in a deeply decarbonized electricity system lies in their ability to address key electricity system challenges. IMGs can facilitate the integration of variable renewable energy sources, such as solar, into the electricity system. While our model does not explicitly quantify reliability, we draw upon established industry understanding to suggest that by connecting mini-grids to the main grid, excess renewable energy generated in one area can be efficiently transmitted to areas with higher demand, improving grid reliability and the overall utilization of clean energy resources. IMGs reduce captive diesel/gasoline gen-sets installed capacity and facilitate emissions reduction by providing electricity that carbon-intensive generators would otherwise provide, contributing to global efforts to mitigate climate change and achieve sustainable development goals.
Overall, this analysis highlights the key role of IMGs in achieving Nigeria's net-zero and energy prosperity objectives. However, their success hinges on robust political and policy support to unleash their exponential growth potential. Such support may be in the form of:
- 1.Curation and publication of grid expansion data or data on the spatial distribution of areas where interconnected mini grids can deliver maximum value for distribution companies.
- 2.Refining IMG business models, informed by pilot project assessments, covering aspects like tariffs, roles, and regulatory frameworks.
- 3.Fostering collaborative efforts across various stakeholders, emphasizing the need for transparency and streamlined processes to enhance cooperation and implementation.
The study is not without some caveats and thus could be enhanced in several ways. Firstly, incorporating the interconnection costs of renewables will improve the cost-optimization analysis. Increasing the sub-annual time resolution would better capture the fluctuating electricity generation from renewable technologies. Nigeria-specific hydro capacity factors should be included for a more accurate representation of hydro resources, and hydropower plants should be individually represented instead of aggregating by size. Hydrological modeling of planned dams would yield more precise estimations of dam productivity and its impacts. The model consists of 48 time slices which could ignore peak periods in certain days. Also, incorporating an explicit representation of the reserve margin would improve the overall representation of the electricity supply system. Furthermore, it would be beneficial to incorporate the spatial distribution of renewable power plants to adequately capture in-country resource variability across time and space. While acknowledging these rooms for improvement, we believe that our analysis provides valuable insights into the role of IMGs in Nigeria's energy transition 'journey'.
Acknowledgments
This work utilized financial resources from The Energy for Growth Hub.
Data availability statement
All data that support the findings of this study are included within the article (and any supplementary files).
Conflict of interest
The authors declare no competing interests.
Footnotes
- 4
EFOM is a bottom-up model which depicts the energy system as a network of energy flows, by the combination of primary energy carriers, through conversion and to the demand for energy services.