

Abstract
The area of Arctic winter sea ice growth (WSIG) has expanded dramatically since winter 2008. Yet the thermodynamic and dynamic contributions to the abrupt increase in WSIG remain unclear. Here using an ice concentration budget, we characterized quantitatively the increasing WSIG and revealed the relative contributions of dynamics during 1985–2021. Ice dynamics related to ice convergence/divergence are compared in two representative regions. The northern Laptev Sea is a freezing-dominated ice growth region and is competitively driven by the ice convergence. While in northwest Beaufort Gyre (BG), the combined effects of freezing and ice divergence have both enhanced since 2008, and the dynamics contribute 84% to the significant WSIG intensification since 2008. Comparison of thermodynamic and dynamic contributions emphasized that the winter sea-ice expansion is influenced not only by winter freeze, but also by convergence/divergence relative to newly formed thinner and mobile ice. Furthermore, the amplified summer Beaufort High in the mid-2000s and its long-lasting memory of the wind-driven strengthened BG are partially attributed to the abrupt increased WSIG since 2008.
Export citation and abstract BibTeX RIS

Original content from this work may be used under the terms of the Creative Commons Attribution 4.0 license. Any further distribution of this work must maintain attribution to the author(s) and the title of the work, journal citation and DOI.
1. Introduction
Arctic sea ice states have undergone conspicuous changes in recent decades, with dramatic reductions in the overall ice area, ice age, and ice thickness (e.g. Kwok and Rothrock 2009, Maslanik et al 2011, Polyakov et al 2012, Kwok 2018). Although there is ongoing sea ice loss in the Arctic in all seasons, it is more severe in summer than winter (Onarheim et al 2018, Stroeve and Notz 2018). 'Winter' in this paper refers to the freezing season generally extending from October to March in the Arctic. These seasonal trends suggest that accelerating summer melt is offset to some extent by increased winter sea ice growth (WSIG), despite probably not being enough to prevent an ice-free Arctic this century as the Arctic warms rapidly (Petty et al 2018). The observational evidence (Ricker et al 2017, 2021, Hao et al 2020), corroborated by modeling studies (Petty et al 2018, Cornish et al 2022, Zhao et al 2023), indicates that the Arctic WSIG in area and thickness has increased dramatically, likely increasing continuously from the mid-2000s until the mid-21st century and thereafter may decrease or remain stable depending on Arctic warming.
Although this WSIG is infrequently discussed, in contrast to rapid sea ice melt, it is gaining importance in understanding the emerging 'new' Arctic climate system (Landrum and Holland 2020). First, winter sea ice formation, when expected to recover from summer melt, provides stability in the Arctic sea ice system, making rapid or irreversible losses in the summer sea ice area unlikely (Tietsche et al 2011). Second, the thinner winter newly formed ice, which transitioned from multiyear ice in recent decades (Maslanik et al 2011, Kwok 2018, Sumata et al 2023), allows for more effective heat exchange during the early freezing season (Walden et al 2017) and becomes more sensitive to extreme synoptic events (Zhang et al 2023). Meanwhile, during winter sea ice formation, surface cooling and salinification induced deep winter convention in the eastern Eurasian Basin may promote upward heat flux from the shoaling Atlantic waters to the surface (Polyakov et al 2017).
Recent studies have explored the trend, abrupt shift, and interannual variability of the Arctic WSIG and understood it as a result of thermodynamic ice growth and dynamic changes in sea ice drift and deformation (Ricker et al 2017, 2021, Petty et al 2018, Stroeve et al 2018, Hao et al 2020, Cornish et al 2022). Many studies have attributed the winter thermodynamic growth to near-surface air temperature, sea surface temperature, sensible and latent heat flux, and snow depth in winter (e.g. Timmermans 2015, Merkouriadi et al 2017, Stroeve et al 2018, Ricker et al 2021, Tsubouchi et al 2021, Zhong et al 2022). Furthermore, a well-known negative feedback linking winter thermodynamic growth to summer ice loss has been established (e.g. Notz 2009, Tietsche et al 2011, Notz and Marotzke 2012, Stroeve and Notz 2015). That is, thinner winter newly formed ice grows faster than thicker ice due to its lower insulation, stimulating sea ice replenishment after a strong summer melt (Bitz and Roe 2004, Stroeve et al 2018). Ricker et al (2021) have confirmed the effects of negative feedback in the North America–Asia marginal seas east from the Laptev Sea to the Beaufort Sea from 2002 to 2019. They also emphasized that this negative feedback is being overwhelmed by the surface heat of ocean and air released by Atlantic waters in winter, leading to a decreasing WSIG in the Barents Sea and part of the Kara Sea. Although ice export largely controls dynamic growth, a thinner ice cover is also more prone to ridging, rafting, divergence and convergence, leading to dynamic winter growth (Rampal et al 2009, Zhang et al 2012, Olason and Notz 2014). However, this was not explored by Ricker et al (2021).
In this study, we evaluate the abrupt rise in the area of Arctic WSIG in the mid-2000s and its spatial distribution using satellite observations. Mean sea ice state and ice age, the patterns of the diagnosed ice advection and divergence items are combined to discuss the physical thermodynamic and dynamic contributions to the WSIG.
2. Data
2.1. Arctic sea ice data sets
Daily sea ice motion (Tschudi et al 2019a) and daily sea ice concentration (SIC) (Cavalieri et al 1996) products on a 25 km grid are obtained from the National Snow and Ice Data Center (NSIDC) and are used in the SIC budget analyses. Weekly sea ice age data on a 12.5 km grid from the NSIDC is also chosen to calculate the fraction of seasonal sea ice (or first-year ice). The ice age data is produced by using the sea ice motion product and tracking parcels in a Lagrangian sense (Tschudi et al 2019b). Due to the availability of ice age data starting in 1984, the analysis in this study is limited to the years 1985–2021.
2.2. Ancillary data sets
To further examine the dominate feature of large scale atmospheric circulation, two monthly gridded datasets are used to link the atmospheric variability to the SIC, including the fifth-generation global atmospheric reanalysis (Hersbach et al 2020), and the National Centers for Environment Prediction/Department of Energy (NCEP/DOE) reanalysis (Kanamitsu et al 2002). Monthly 10 m surface winds and sea level pressure (SLP) are derived from these two datasets. Monthly sea surface height (SSH) and speed of sea surface ocean currents are derived from Ocean Reanalysis System 5 (C3S-CDS 2021), to study the oceanic background of the WSIG.
3. Methods
3.1. Sea ice concentration budget
Following Holland and Kwok (2012), this study has diagnosed the concentration budget of WSIG (equation (1))
where  is SIC and
  is sea ice drift. The ice tendency (
 ) on the left-hand side is determined by the dynamic and residual processes. The residual term is mainly caused by thermodynamic melting/freezing and mechanical redistribution (Uotila et al
2014, Pope et al
2017). The dynamic process includes convergence/divergence (
) on the left-hand side is determined by the dynamic and residual processes. The residual term is mainly caused by thermodynamic melting/freezing and mechanical redistribution (Uotila et al
2014, Pope et al
2017). The dynamic process includes convergence/divergence ( ) and advection (
 ). The former is mass-unconserving, including convergence-caused (forming ridges or rafts by floes collision) and divergence-caused (cracking apart into leads) ice thickening or area increasing, which is only a very small fraction compared to thermodynamics (Holland and Kimura 2016, von Albedyll et al
2022).
). The former is mass-unconserving, including convergence-caused (forming ridges or rafts by floes collision) and divergence-caused (cracking apart into leads) ice thickening or area increasing, which is only a very small fraction compared to thermodynamics (Holland and Kimura 2016, von Albedyll et al
2022).
Although WSIG in volume reflect the actual ice growth, this volume increase is due to both the thickening of multiyear sea ice and the formation of seasonal sea ice. The concentration of WSIG can largely be regarded as the seasonal sea ice growth arising in open water after summer. Therefore, we choose to conduct the SIC budget analysis considering the climate effect of SIC will be more direct when the Arctic becomes ice-free in summer around the mid-2000s.
3.2. Construction of the concentration of WSIG
The concentration of WSIG ( ) in every grid cell is defined as the difference between the maximum SIC in March (
 ) and the minimum SIC in the preceding September (
 ). This method can give us more details about WSIG, especially on both temporal and spatial scale in the entire Arctic. This definition comes from the Arctic climatological SIC seasonality which generally reaches a minimum in September and a maximum in the following March (Haine and Martin 2017). As Arctic sea ice freezes in October–February, this preconditional ice growth accumulates, reaching the maximum in March. Accordingly
  can be approximated as follows:

where the last item is calculated as the time integration of daily ice tendency in October–February. This approach uses the daily SIC and excludes grid cells below the 15% threshold because the daily ice motion has a high uncertainty there (Tschudi et al
2019b). Combining equations (2) and (1), we construct the  and obtain its dynamic and thermodynamic contributions.
3.3. Area of WSIG and the fraction of first-year ice in winter
To understand the WSIG variability in the particular regions, we define the area of WSIG as the sum of the area of each grid cell multiplied by the  in the selected region. The extent of first-year ice is the sum of the ice age grid cells equal to 1 year in the given region. The fraction of the first-year ice extent in the total sea ice extent, averaged in October–March, is combined to discuss the sea ice state of the WSIG.
3.4. Statistical methods
The statistical significance is evaluated by the two-tailed student's test. The moving t-test method is used to detect the abrupt change in the WSIG variability.
4. Results
4.1. Abrupt rise and spatial features of the area of WSIG
Figure 1(a) shows the time series of the area of Arctic WSIG north of 60°N in the Arctic. The long-term mean area of Arctic WSIG has increased from 7.78 million km2 during 1985–2007 to 8.81 million km2 during 2008–2021. We use the moving t-test method to study the significant shift and the result is shown in figure S1. Spatially, the abrupt shift of WSIG occurs in the Arctic shelf edge zone (ASEZ) when comparing the distribution of WSIG during 1985–2007 and 2008–2021 (figures 1(e)–(g)). Because the WSIG accuracy is influenced by the SIC accuracy both in winter and summer, we mark the concentration contour at a value of 0.7 as a threshold for active WSIG when considering the largest SIC accuracy (15%, Cavalieri et al 1992). Since winter 2008, the outline of the active WSIG has extended poleward to the Arctic shelf edge (figures 1(e)–(g), black contours). This ASEZ, likewise, displays an apparent shift in the WSIG (figure 1(b)), contributing about 70% to the total change of Arctic WSIG, with a rapidly increasing trend of 0.028 million km2 per year at a 95% confidence level during 1985–2007, turning into an insignificantly rising trend of 0.009 million km2 per year during 2008–2021. In contrast, the southern Barents Sea and the Greenland Sea show reduced WSIG (figure 1(g), blue shading). Our results of winter sea-ice expansion in the ASEZ after winter 2008 are consistent with previous studies (Hao et al 2020).

Figure 1. Time series of the area of winter sea ice growth (WSIG) and fraction of first-year ice in the total sea ice in (a) Arctic, (b) Arctic shelf edge zone, (c) northwest Beaufort Gyre, and (d) northern Laptev Sea in winter (October–March). The red lines show the linear trend before and after winter 2008. The sub-panels in (b), (c), and (d) show that the abrupt shift of WSIG in three regions contributes 70%, 24%, and 12% of the abrupt increased WSIG in Arctic, respectively. Spatial distribution of WSIG concentration in (e) 1985–2007, (f) 2008–2021, and their difference in (g) (2008–2021 minus 1985–2007). The black outlines indicate a contour value at 0.7 of the WSIG over two periods. Yellow rectangles in figure 1(g) are defined as northwest Beaufort Gyre (74° N–79° N, 170° E–210° E) and northern Laptev Sea (78° N–82° N, 115° E–155° E).
Download figure:
Standard image High-resolution imageASEZ is also a transitional region between multiyear ice and first-year ice. Compared to the pan-Arctic, the fraction of the first-year ice in the total sea ice in winter in the ASEZ has increased dramatically from 31% in 1985–2007 to 75% in 2008–2021 (figures 1(a) and (b), lower panels). The rapidly increasing fraction means that ASEZ has transitioned from a multiyear, ice-dominated regime to a seasonal, ice-dominated regime. As notable examples among the ASEZ, we focus on the northwest Beaufort Gyre (BG) and northern Laptev Sea. The reasons are that the northwest of BG has experienced great dynamic change and summer melt (figure 1(c), bottom panel; Maslanik et al 2011, Kwok 2018, Bi et al 2020), and the northern Laptev Sea is considered an 'ice factory' in winter due to its oversized ice production (figure 1(d); Cornish et al 2022). Their locations are shown as yellow rectangles in figure 1(g). Furthermore, they are regionally controlled by the main Arctic Ocean gyre system, the BG, the Transpolar Drift, and the Laptev Gyre. One point should be noted that, when comparing the trend of WSIG during two periods, 1985–2007 and 2008–2021, northwest BG has transitioned to a quasi-stable state, while northern Laptev Sea still retains an insignificant rising in the latter period. To understand this geographic difference, we further evaluate the combined effects of thermodynamic and dynamic processes in a regional scale.
4.2. Dominant role of the thermodynamics and dynamics in the WSIG
To distinguish the relative thermodynamic and dynamics contributions to the WSIG variability, we diagnosed the concentration budget of Arctic WSIG from October to February during 1985–2021 (see section 3).
Figure 2 shows winter thermodynamic and dynamic growth in the Arctic WSIG. The residual term mainly represents the net concentration of WSIG from thermodynamic. Comparing the two periods of 1985–2007 and 2008–2021, the increased WSIG is dominated by thermodynamics in most parts of the Arctic seasonal ice zone (figures 2(b), (g) and (l)), particularly in Alaska and Siberia marginal seas (figure 2(l)). Notably, the thermodynamic-dominated pattern recedes near the central Arctic ice edge, for example, in the ASEZ (figure 2(l), black contours), and may have a source due to dynamics (figure 2(m), red shading).

Figure 2. Spatial pattern of the concentration budget items of the constructed WSIG in winter (October–Febuary) during (a)–(e) 1985–2007, (f)–(j) 2008–2021, and the difference between two periods (2008–2021 minus 1985–2007).  (first row), combined with the contribution from residual (primarily thermodynamic change, second row), dynamic (third row), advection (fourth row), and convergence/divergence (the last row) are also shown. Stippling in figure 2(k) indicates that the results are at the 95% confidence level. The outlines and boxes indicate ASEZ, northwest Beaufort Gyre, and northern Laptev Sea, the same as in figure 1(g). The mean ice speed from October to February is shown as black arrows in figures 2(c) and (h).
Download figure:
Standard image High-resolution imageThe dynamic term is divided into advection and convergence/divergence to illustrate the respective contribution of the dynamic process. Intensification of winter ice formation caused by strong divergence ( , positive value) extends in a zonal band westward from the Canadian Arctic Archipelago to the Laptev Sea (figures 2(e) and (j)). While convergence results in a negative WSIG in most regions, including off the coast of Alaska and Siberia, Baffin Bay, and the central polar region. Advection (
 ) counteracts WSIG only in areas of strong ice transport in concentration gradients, such as the Fram Strait, the Labrador Sea, and offshore Alaska (figures 2(d) and (i)). When comparing two periods, what stands out is the dominance of the divergent/convergent WSIG in the dynamic change (figures 2(m) and (o)). It reflects the maintenance of the newly formed ice and seem to be controlled by the strengthened sea ice drift of the anticyclonic BG, the Transpolar Drift, and the cyclonic Laptev Gyre (figures 2(c), (h) and (m) arrows).
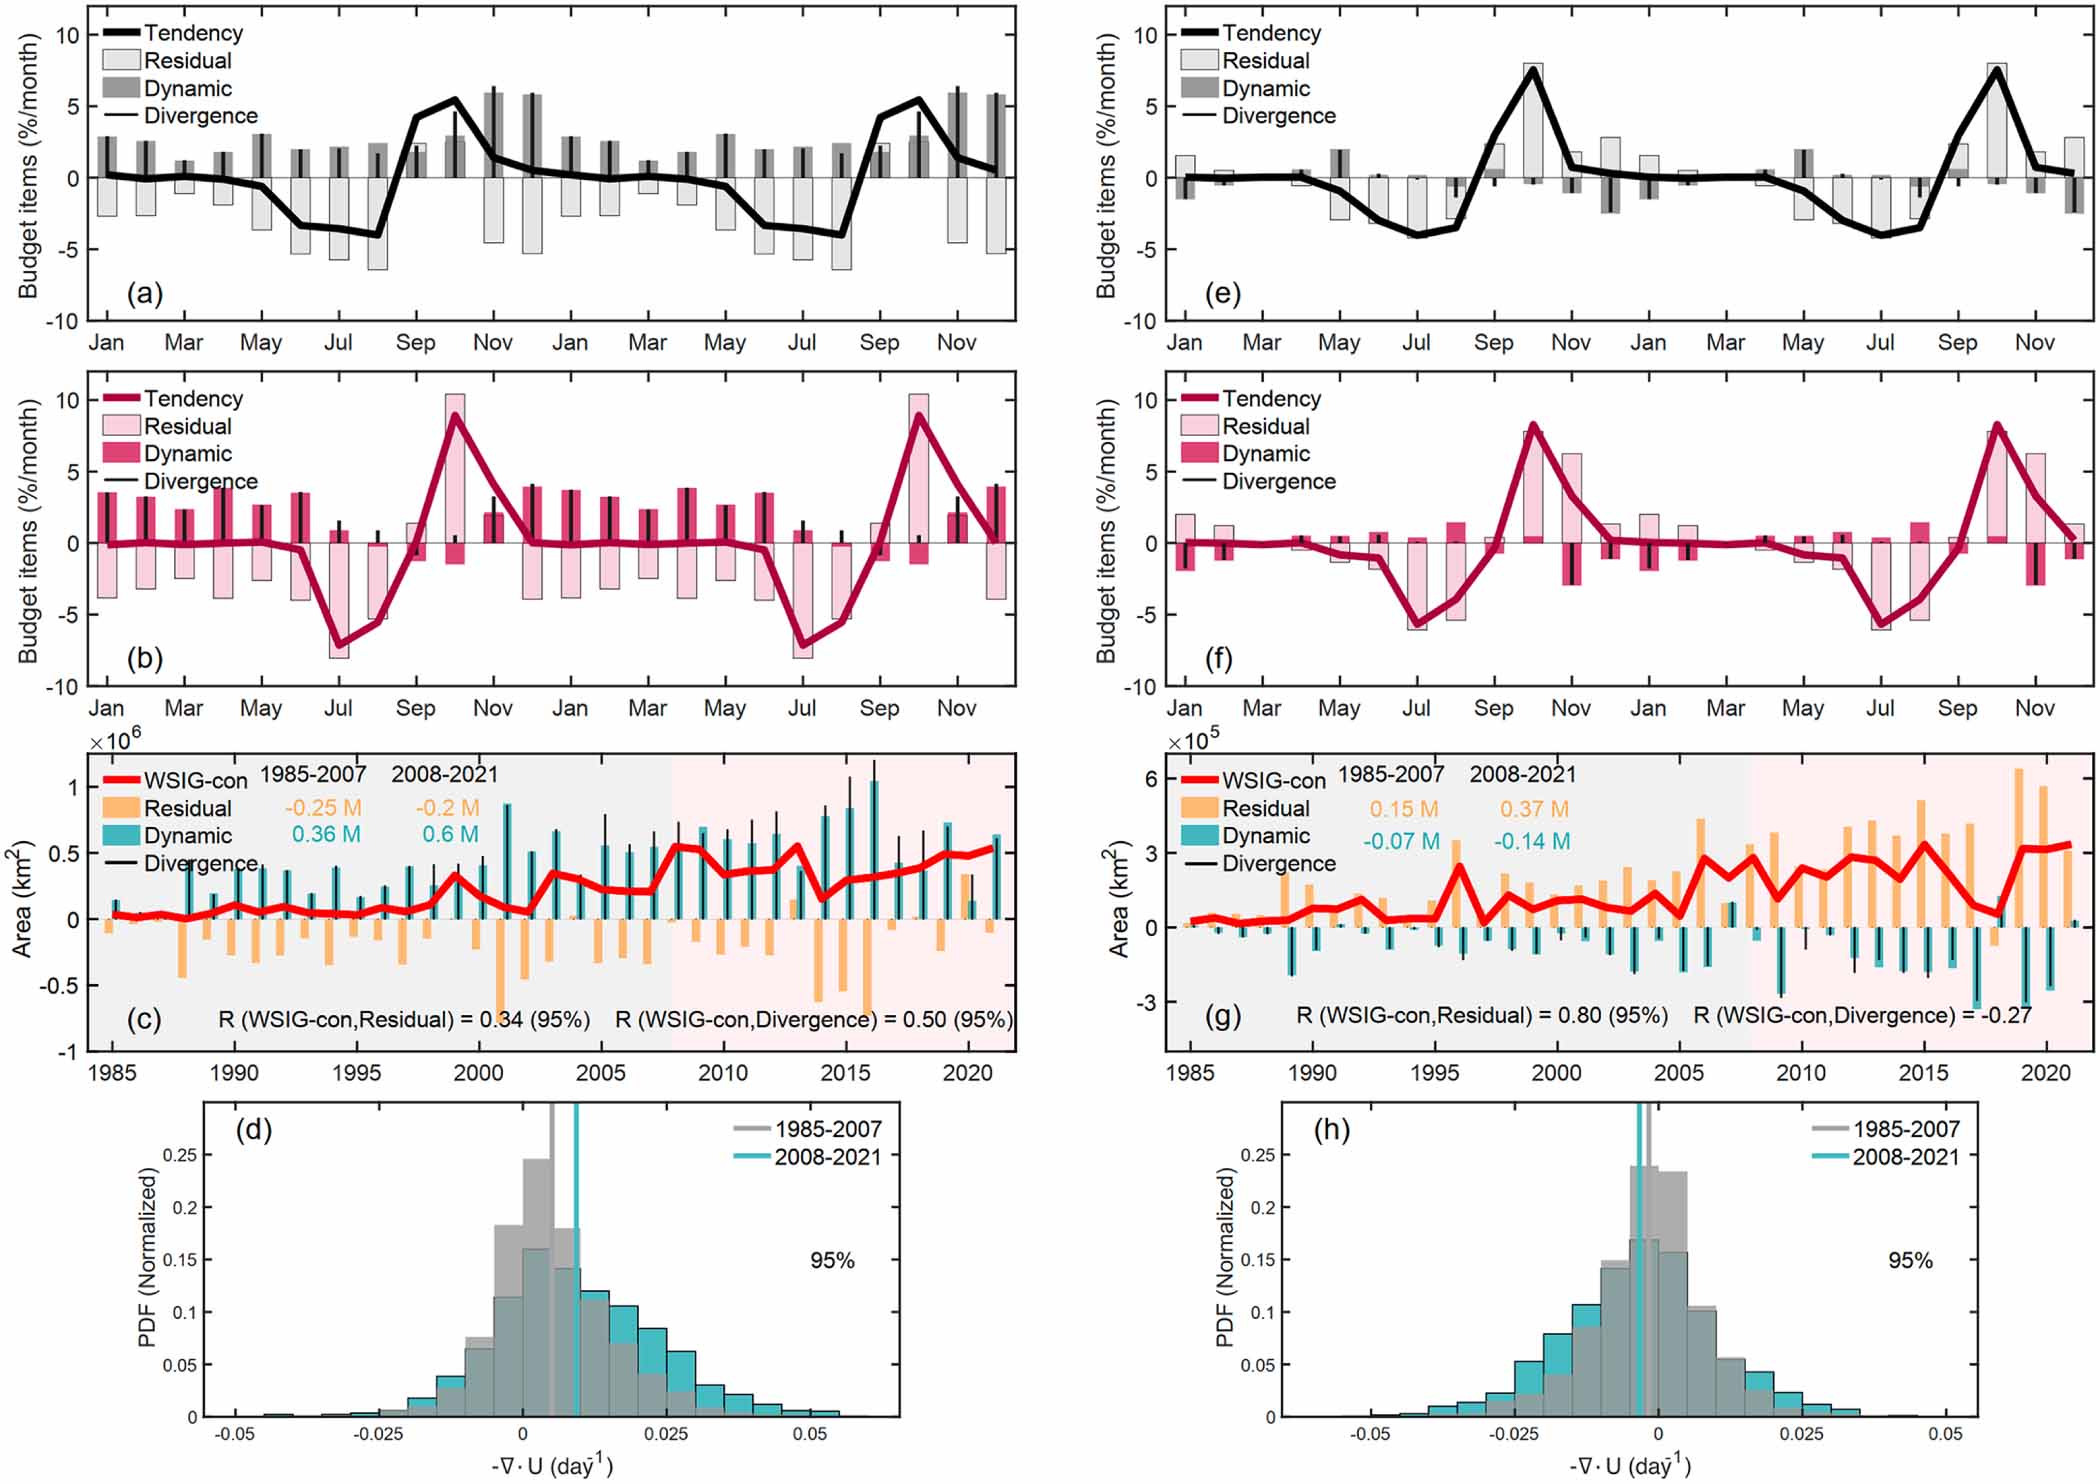
It is complex to interpret the thermodynamics and dynamics in ASEZ because the divergent gain can be offset by a convergent loss in concentration in a chosen region. As examples of good dynamic consistency, the monthly climatologies of the SIC budget items in northwest BG (figure 3(a)) and northern Laptev Sea (figure 3(e)) are compared in detail. There are many similarities between northwest BG and northern Laptev Sea. For example, they both start to melt in April and freeze in September during 1985–2007 (figures 3(a) and (e), bold line). After 2008, rapid summer ice loss and fall ice growth were observed, most frequently occurring in July–August and October–November, respectively (figures 3(b) and (f), bold line). The enhanced thermodynamic process plays a key role (figures 3(b) and (f), light bars), as the melting creates a precondition toward a thinner ice cover that freezes delayed and fast (Stroeve et al 2014), allowing subsequent WSIG to occur in early winter (figures 3(b) and (f)). In contrast to northern Laptev Sea, a thermodynamic-dominated ice growth region, the increase in extent of northwest BG is partly due to thermodynamic growth limited in October and partly to positive dynamic growth from October to the end of winter (figures 3(a) and (e)).

Figure 3. Concentration budget analysis of WSIG in the northwest Beaufort Gyre (left column) and northern Laptev Sea (right column). (a), (e) Monthly climatologies of sea ice concentration budget regional averaged from 1985 to 2007. (b), (f) Difference of the budget items between 1985–2007 and 2008–2021 (latter minus former). (c), (g) Time series of the budget items (bars) of the constructed area of WSIG index (red curve). (d), (h) Normalized histograms of daily ice motion divergence ( ) from November to February. The vertical lines are the long-term mean during 1985–2007 and 2008–2021. Their significance is at a 95% confidence level evaluated by the two-tailed student test.
Download figure:
Standard image High-resolution imageConsidering these preconditions of each month in winter, the constructed area of WSIG variability in northwest BG and northern Laptev Sea during two periods (1985–2007 and 2008–2021) is shown in figures 3(c) and (g). The constructed area of WSIG index (red curves) and the area of WSIG index (lower panel of figures 1(c) and (d), black curves) achieve a good agreement with the correlation coefficitions large than 0.91, though there is some difference in amplitude. The northern Laptev Sea reveals a simultaneous growth in the thermodynamic contribution and the constructed area of WSIG index (R = 0.80, P < 0.05). Mean area of the thermodynamic growth increase significantly from 0.15 to 0.37 million km2 in two periods (figure 3(g), yellow bars). Although thermodynamic growth has also strengthened in northwest BG, the dynamic contribution (mean area increased from 0.36 to 0.6 million km2) still predominantly facilitates significant intensification of WSIG in northwest BG, accounting for 84% of the abrupt rise in the area of WSIG. The probability distribution of daily ice motion divergence ( ) is more even since winter 2008, distributing towards stronger divergence (convergence) in the northwest BG (northern Laptev Sea) (figures 3(d) and (h)). This supports our interpretations of ice dynamics related to more mobile seasonal ice convergence/divergence in an emerging new Arctic.
Taken together, these results suggest that although thermodynamic ice growth has concurrently dominated the abrupt shift in WSIG in most ASEZ regions, such as northern Laptev Sea, the enhanced dynamic growth, mainly ice divergence, contributes 84% of the significant expansion of WSIG in northwest BG.
4.3. Possible source for the abrupt shift in the area of WSIG
The main feature of large-scale ice drift pattern of Arctic winter climatology during 1985–2021 is first explained (figures 2(c) and (h), arrows). Ice circulates as part of the BG and is transported out of the Arctic through the Fram Strait by Transpolar Drift. The two main wind-driven circulations are under the influence of two major meteorological systems, the Beaufort High and the Icelandic Low. The center of BG, characterized by a maximum in SSH and anticyclonic ocean currents, generally coincides with the overlying Beaufort High center, characterized by a maximum in SLP and anticyclonic winds, forcing the ice divergence/convergence via ocean-ice and air-ice stresses (Timmermans and Toole 2023).
Previous studies have indicated a significant amplification of the Beaufort High during summer and fall and attributed it to the intensification of the BG in the mid-2000s (Giles et al
2012, Moore 2012, Wu et al
2014, Regan et al
2019). Associated with the wind-driven spin-up of the BG, the gyre has expanded northwestward in recent decades (Armitage et al
2017, Regan et al
2019, Bertosio et al
2022). The mechanism of thermodynamic ice growth, attributed to an abrupt shift in the WSIG in the mid-2000s, has been studied in observations including the warming of the atmosphere (Ding et al
2017, Hao et al
2020, Wang et al
2023) and ocean (Timmermans 2015, Ricker et al
2021, Tsubouchi et al
2021, Zhong et al
2022). Hence, we focus on the dynamic change of WSIG as its responses to surface winds and oceanic forcings have increased significantly (e.g. the intensified ice convergence/divergence ( ) in figures 3(g) and (h)).
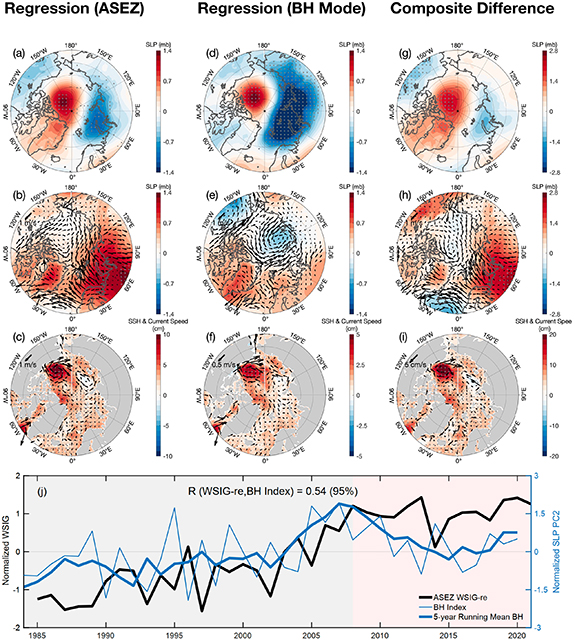
To determine the large-scale circulation that are associated with the WSIG, we regressed the synchronous atmospheric and oceanic anomalies with the normalized area of WSIG index in ASEZ (figure 4(j), black line) during 1985–2021 (October–February). Corresponding to the increase of WSIG in ASEZ, the positive SSH anomalies and anticyclonic ocean currents at BG are pronounced in figure 4(c). Figure 4(b) shows the enhanced easterly winds anomalies along the Alaska coast and northwesterly winds anomalies across the Laptev Sea, which could speed up the BG and Laptev Gyres. We also regressed the preceding summer (June–September) SLP anomalies with the normalized area of WSIG index in ASEZ during 1985–2021 (October–February, figure 4(a)). As expected, a positive SLP anomaly near the Canadian Arctic Archipelago extending from Greenland to the Beaufort Sea and a negative SLP anomaly overlying the Barents Sea is conducive to enhancing the anticyclonic BG and cyclonic Laptev Gyre in the following winter. Thus, these anomalous patterns indicate the enhanced ice advection off the Akaska coast upstream and the divergence of thinner and more mobile ice packs towards the northwest extent of BG. Meanwhile, the strengthened convergence in northern Laptev Sea and the compensated convergence by newly formed ice in the nearby shallow waters are prevalent.
Figure 4. Regression pattern of the (a) preceding summer (JJAS) SLP, (b) SLP (shading) and 10 m surface winds (arrow) during October–February, and (c) SSH (shading) and surface ocean currents (arrow) during October–February against the normalized WSIG index over ASEZ during 1985–2021. (d)–(f) Regression pattern of the same atmospheric and oceanic anomalies, but against the normalized Beaufort High (BH) index during 1984–2020. (j) Time series of the normalized WSIG and the preceding summer (JJAS) Beaufort High indices. (g)–(i) Composite difference of the same atmospheric and oceanic anomalies during two periods (2008–2021 minus 1985–2007). Stippling indicates that the results are significant at the 95% confidence level.
Download figure:
Standard image High-resolution image
This persistent Beaufort High pattern is one of the leading modes of atmospheric circulation, which can be defined as the second leading empirical orthogonal function (EOF) mode of the Arctic and contributes 11.61% of the total variance from 1984 to 2020 (figures 4(d) and S2). The time series of the summer Beaufort High mode exhibited a strengthening during 2005–2012 (figure 4(j)), consistent with the topic of locally strengthened summer anticyclonic circulation mode near the Canadian Arctic Archipelago (figure 4(g); Wang et al
2023). The correlation coefficient of the normalized Beaufort High index with the following normalized area of WSIG index in ASEZ is 0.54 (P < 0.05) during 1984–2020. While the first leading mode is the so-called Arctic Oscillation, it insignificantly correlates to the normalized area of WSIG index (figure S2, R =  0.22). Thus, the decadal change of the summer Beaufort High is speculated to be linked to the abrupt rise of WSIG over the ASEZ. To provide more evidence, we regressed the atmospheric and oceanic circulation during October–February to the preceding summer (June–September) Beaufort High index during 1985–2021 (figures 4(e) and (f)). As expected, the SSH and ocean currents response to summer Beaufort High variability shows general resemblances to these respondence to WSIG variability in ASEZ, but with half of the magnitude (figures 4(c) vs (f)). One exception is the winter surface wind pattern (figures 4(b) vs (e)). This suggests a short memory of the atmosphere and confirms the lasting memory of summer winds on winter ice through the ocean's memory (Wang et al
2021). We also use NCEP/DOE data sets to examine the SLP leading mode and quite similar results are shown in figure S3.
0.22). Thus, the decadal change of the summer Beaufort High is speculated to be linked to the abrupt rise of WSIG over the ASEZ. To provide more evidence, we regressed the atmospheric and oceanic circulation during October–February to the preceding summer (June–September) Beaufort High index during 1985–2021 (figures 4(e) and (f)). As expected, the SSH and ocean currents response to summer Beaufort High variability shows general resemblances to these respondence to WSIG variability in ASEZ, but with half of the magnitude (figures 4(c) vs (f)). One exception is the winter surface wind pattern (figures 4(b) vs (e)). This suggests a short memory of the atmosphere and confirms the lasting memory of summer winds on winter ice through the ocean's memory (Wang et al
2021). We also use NCEP/DOE data sets to examine the SLP leading mode and quite similar results are shown in figure S3.
Considering the background change in Arctic climatology, we displayed the composite differences of atmospheric and oceanic circulation between the 2008–2021 and 1985–2007 periods (figures 4(g)–(i)). By comparing three columns of figure 4, we found good agreement in spatial patterns, suggesting that the strong summer Beaufort High and anticyclonic winds (figure 4(g)), as well as the following wind-driven spin-up of BG (figure 4(i)) after 2008 may provide a beneficial background for the abrupt increase of WSIG.
5. Conclusion and discussion
Abrupt rise in the area of WSIG since winter 2008 and its spatial distribution in the Arctic are characterized by using satellite and reanalysis data sets during 1985–2021. Our results showed that since 2008 there is a notable winter sea-ice expansion poleward along the ASEZ. Like most of the ASEZ region, the northern Laptev Sea is a freezing-dominated ice growth region and is competitively driven to a small extent by the increasing ice convergence. While in northwest BG, the combined effects of freezing and ice divergence have both enhanced since 2008, and the dynamics contribute 84% to the significant WSIG intensification there. Furthermore, the amplified summer Beaufort High mode and its long-lasting impact on the wind-driven strengthened BG are suggested to force the enhanced ice divergence in northwest BG and ice convergence in northern Laptev Sea, partially responsible for the increased WSIG in ASEZ after 2008. These results may be helpful for improving the seasonal prediction of WSIG due to the persistence of ocean memory.
Recent studies have shown that the increased multiyear ice melt in the Beaufort Sea impedes sea ice from gyre-transporting, thickening and aging (Babb et al 2022, 2023, Sumata et al 2023). These signals are also confirmed by the enhanced ice advection off the Alaska coast upstream and the divergence of thinner and more mobile ice packs towards the northwest extent of BG. Our comparison of thermodynamic and dynamic contributions emphasized that the winter sea-ice expansion is influenced not only by winter freeze, but also by convergence/divergence relative to newly formed thinner and mobile ice. Although the loss of thicker multiyear ice may boost dynamic growth of WSIG like northwest BG, it relies on the new ice formation in early winter and will one day be rendered by the continued warming.
Our results show that the fraction of first-year ice in winter in ASEZ is approaching 80% in recent decade (figure 1(b)), a hint of most of the ice can not survive the following summer, leaving a quite wide open water for winter growing. In thermodynamic-dominated regions like northern Laptev Sea, we assume that the WSIG may reach a peak in the coming years under the continued Arctic warming in these region (Cornish et al 2022). While in regions like northwest BG, a quasi-stable state has been reached since 2020, the shape of which is extending northward shift toward the central Arctic (Bertosio et al 2022). Without the redistribution of strong ice divergence, the northwest BG will likely exhibit a decreasing WSIG in the coming decade. Furthermore, given the ongoing winter growth and recovery of sea ice, we propose to better investigate the interannual variability of WSIG in future research. We suggest that possible drivers have to be analyzed with respect to the effect of the ocean heat transport or atmospheric forcing due to warming and locally or remotely driven circulation changes (Woods and Caballero 2016, Lind et al 2018, Luo et al 2023).
Acknowledgments
This study was supported by the National Key Research and Development Program of China (Grant No. 2022YFE0106800), the National Natural Science Foundation of China (NSFC) (Nos. 42306011 and 42230603), the Research Council of Norway funded project (MAPARC, No. 328943), the Innovation Group Project of the Southern Marine Science and Engineering Guangdong Laboratory (Zhuhai) (No. 311020001), the Natural Science Foundation of Guangdong Province (No. 2022A1515110914).
Data availability statements
The NSIDC ice age version 4.1 (V4.1) data is freely distributed at https://nsidc.org/data/nsidc-0611/versions/4. The NSIDC ice motion V4.1 and sea ice concentration V1.1 products are used for the sea ice budget analyses and can be downloaded at https://nsidc.org/data/nsidc-0116/versions/4 and https://nsidc.org/data/nsidc-0051/versions/1, respectively. Open access monthly oceanic and atmospheric reanalysis: ORAS5 (www.copernicus.eu/en/access-data/copernicus-services-catalogue/reanalysis-oras5), ERA5 (www.ecmwf.int/en/forecasts/datasets/browse-reanalysis-datasets), NCEP/DOE R2 (https://psl.noaa.gov/data/gridded/data.ncep.reanalysis2.html). All data were accessed 18 August 2023.
All data that support the findings of this study are included within the article (and any supplementary files).
Supplementary data (1.2 MB DOCX)