

Abstract
Humans have drastically disrupted the global sediment cycle. Suspended sediment flux and concentration are key controls over both river morphology and river ecosystems. Our ability to understand sediment dynamics within river corridors is limited by observations. Here, we present RivSed, a database of satellite observations of suspended sediment concentration (SSC) from 1984 to 2018 across 460 large (>60 m wide) US rivers that provides a new, spatially explicit view of river sediment. We found that 32% of US rivers have a declining temporal trend in sediment concentration, with a mean reduction of 40% since 1984, whereas only 2% have an increasing trend. Most rivers (52%) show decreasing sediment concentration longitudinally moving downstream, typically due to a few large dams rather than the accumulated effect of many small dams. Comparing our observations with modeled 'pre-dam' longitudinal SSC, most rivers (53%) show different patterns. However, contemporary longitudinal patterns in concentration are remarkably stable from year to year since 1984, with more stability in large, highly managed rivers with less cropland. RivSed has broad applications for river geomorphology and ecology and highlights anthropogenic effects on river corridors across the US.
Export citation and abstract BibTeX RIS

Original content from this work may be used under the terms of the Creative Commons Attribution 4.0 license. Any further distribution of this work must maintain attribution to the author(s) and the title of the work, journal citation and DOI.
1. Introduction
The flux and concentration of suspended sediment shapes rivers and their ecosystems. While suspended sediment flux, or mass per time moving past a point, is a critical measure of erosion and a river's ability to do geomorphic work (Leopold et al 1964), suspended sediment concentration (SSC), or mass per volume, has an important influence on river ecosystems. SSC is a major control of sunlight availability in rivers and therefore impacts plant and algal growth (Kirk 1994, Julian et al 2008, Bernhardt et al 2022), influences habitat suitability, and carries carbon, nutrients, and contaminants (Droppo 2001, Wotton 2007). In large rivers, suspended sediment can be a locus for biogeochemical activity (Gardner and Doyle 2018, Wang et al 2022). Two rivers can have the same suspended sediment flux but differences in concentration and thus feature different light, nutrient, and disturbance regimes, leading to different ecosystems. Despite the significance of SSC to both river ecosystems and their morphology, we do not know how human activities change downstream SSC patterns and how shifting SSC patterns affect ecosystems.
Past work has largely focused on sediment flux, trends in flux over time, and basin scale controls over long-term mean flux. These studies have significantly advanced our understanding of riverine sediment transport (Walling and Fang 2003, Syvitski and Kettner 2011). Many rivers around the world are experiencing changes in sediment flux as well as SSC (Li et al 2020, Murphy 2020). Declines are often linked to sediment trapping behind dams and increases in SSC linked to deforestation and agricultural expansion (Syvitski et al 2005, Dethier et al 2022) leading to widespread changes in coastal delta extent (Syvitski et al 2009, Dunn et al 2019, Nienhuis et al 2020). However, SSC trends and their consequences in river ecosystems are rarely discussed despite the fact that characteristic annual variability in SSC influences river habitat suitability, algal growth and phenology, and floodplain development (Wohl et al 2015). Similarly, spatial variability in SSC along rivers and how these patterns have changed due to human activities represent important properties of river ecosystems.
A major roadblock toward greater spatial understanding of riverine sediment dynamics is the scarcity of SSC measurements. While in-situ sensors can yield insights into high frequency dynamics (Zarnaghsh and Husic 2021), long-term SSC records are rare and spatial SSC coverage is severely lacking. Less than 10% of Earth's largest rivers have SSC monitoring sites (Syvitski et al 2005). In the US, only nine sites located on seven different rivers have SSC records longer than 50 years (Wohl et al 2015). Satellites provide a potential solution for developing long-term, spatial SSC observations. Optical satellites, such as the Landsat series, have been used for over 50 years to observe SSC in rivers using empirical, data-driven approaches that convert remote sensing reflectance into SSC (Ritchie and Cooper 1991, Mertes et al 1993, Pavelsky and Smith 2009). Empirical approaches for retrieving SSC from satellites are often site-specific (Topp et al 2020), and other than a recent dataset covering 414 major river outlets to the ocean (Dethier et al 2022), there are currently no remotely sensed SSC databases at continental to global scales.
Here, we present longitudinal patterns and long-term trends in SSC over 34 years (1984–2018) along 108 000 continuous kilometers of large (>60 m wide) US rivers using satellite remote sensing and machine learning (ML). Our SSC database, RivSed, was built using 234 747 Landsat 5, 7, and 8 images (Gardner et al 2020) and a single ML algorithm trained on >21 000 coincident field and satellite observations and validated on >2000 observations based on AquaSat (Ross et al 2019). Our algorithm performs as well or better than previous local, Landsat-based models but is applicable to rivers across the contiguous US. The result is a coherent 34 year record of spatially reach-averaged SSC across reaches with a median length of ∼2.6 km. RivSed is nearly two orders of magnitude larger (∼15.9 million observations) than all previous publicly available SSC data in the US combined (∼700 000 observations). Here, we use RivSed to address questions including: How is SSC changing over time in US rivers? What are the typical longitudinal SSC patterns along rivers (referred to as SSC profiles)? How do historical and contemporary human activities alter the shape and stability of SSC profiles?
2. Methods
Generating RivSed required two major steps: developing a generalizable ML algorithm to estimate SSC from Landsat surface reflectance (Rs) and a database of Landsat Rs over rivers to apply the SSC algorithm. Building on previous efforts (Ross et al 2019, Gardner et al 2020, Topp et al 2021), we applied our algorithm to a Rs database (RiverSR, Gardner et al 2020) that aggregates river pixels to reaches defined by National Hydrography Dataset, NHDplusV2 (Moore and Dewald 2016), with a median reach length of 2.6 km. We used the USGS Collection 1 Tier 1 Landsat Surface Reflectance product (T1-SR) because it was the best available product at the time of analysis, prior to the recent release of Collection 2 (Schmidt et al 2013, Claverie et al 2015, Vermote et al 2016), and we will release a Collection 2 update in future work.
2.1. SSC algorithm
ML is increasingly used in remote sensing of inland water quality because of its robust predictions, low computational costs, and the challenges of applying physically-based models in optically complex waters (Peterson et al 2018, Pahlevan et al 2020, Sagan et al 2020). AquaSat was designed as an inclusive database, therefore we performed additional quality control to identify matchups for algorithm development (see SI). We generated a diverse and representative training dataset across space, time, SSC values, and waterbodies (e.g. estuaries, lakes/reservoirs, and rivers). The resulting training-validation dataset had 21 671 match-ups with 2407 set aside as test hold-outs (10% of all match-ups) across the contiguous United States (CONUS) with SSC concentrations ranging from 0.1 to 2228 mg l−1 (figure S1).
To reduce overfitting, spatial-temporal bias, and to develop a parsimonious model, we used forward feature selection (FFS) to select the optimal SSC predictors, combined with leave-location-leave-time out cross validation (Meyer et al 2018, 2019) within an Xgboost generalized linear regression ML algorithm using the CAST (Meyer et al 2018), CARET (Kuhn 2008), and Xgboost packages in R (Chen et al 2015). FFS found ten optimal features (figure S2). The Xgboost regression model hyper-parameters were tuned using a grid search constrained to conservative values to avoid overfitting and produce the final model (Topp et al 2021). We calculated error metrics such as root mean square error (RMSE), mean absolute error (MAE), bias, and relative bias (Dethier et al 2020). We focus on MAE and relative bias, as they are the preferred metrics for remote sensing of water quality validation, particularly since SSC spans nearly six orders of magnitude (Seegers et al 2018).
2.2. Data analysis
We quantified trends in mean annual SSC over time using the non-parametric Mann–Kendall test, which is robust to outliers. We analyzed trends at 28 397 river reaches with representative data, only including reaches that had more than four SSC observations per year sampled across two or more seasons for more than 15 years. Seventy-five percent of reaches had a time series of 30 years or more. Significant trends were identified if the p-value was <0.05. SSC rates of change (mg l yr−1) were quantified using the Theil–Sen slope estimator (Sen 1968).
We identified longitudinal SSC patterns using the Mann–Kendall trend test as a robust and conservative test. We calculated the long-term mean SSC for reaches with representative data that had more than 50 SSC observations collected over at least 15 years. We restricted analysis to rivers with dense spatial observations and filtered to rivers that had more than 100 km of spatially continuous SSC observations, resulting in 244 unique rivers (53% of the rivers in RivSed). The SSC patterns were categorized as increasing downstream, decreasing downstream, or no pattern depending on if the slope was significantly positive, significantly negative, or not statistically significant. To test the impact of dams on longitudinal SSC patterns, we calculated metrics that represent the average and cumulative effect of dams along the 244 rivers, including median dam height (m), median dam storage (mm), and cumulative reservoir water storage (mm). Storage metrics were converted to mm by normalizing volume to basin area to enable comparisons across river basins with different sizes and climates. Dam density was calculated as the number of dams divided by the total length of the river (dams km−1). Dam characteristics were derived from the National Anthropogenic Barriers Database (NABD) (Ostroff et al 2013) and US Army Corps of Engineers National Inventory of Dams (NID). We tested if rivers with longitudinal SSC increases versus rivers without longitudinal increases had differences in dam metrics using the non-parametric Kruskal–Wallis test using an alpha of 0.05.
To analyze the impact of widespread damming of US rivers over the last century (Graf 1999) on longitudinal SSC patterns, we compared our observed to modeled longitudinal SSC patterns from a global sediment transport model, WBMsed (Cohen et al 2013, 2014). To isolate the impacts of dams, we used a model simulation without dams but kept other contemporary hydrological and geomorphic conditions. Similar to observed data, we classified rivers in the 'no dam' scenario as having decreasing, increasing, or no longitudinal patterns. We then compared how the fraction of rivers with different downstream patterns changed between observed and modeled 'no dam' scenarios. For more information about the model structure, inputs, and post-processing see Cohen et al (2022).
We quantified temporal stability in SSC profiles along major rivers by comparing the shape of mean annual SSC profiles to the shape of the long-term mean SSC profile within each river. For data consistency and representativeness, we filtered RivSed to river reaches with more than four observations per year across all 34 years and used the same reaches across all years to represent mean annual SSC profiles leaving 190 unique rivers (41% of rivers in RivSed, figure S3). To isolate differences in only SSC profile shapes, we log transformed SSC because SSC can span several orders of magnitude along a river and then detrended temporal changes in SSC. The normalized distance between annual SSC profiles and the long-term mean SSC profile within each river was calculated using dynamic time warping, which is widely used to quantify the similarity between two ordered sequences with high variability, such as time series, sound waveforms, or animal movements (Giorgino 2009, Cleasby et al 2019). For clarity, we refer to normalized distance as 'stability,' where higher values represent similar profile shapes, or more stability, and low values approaching 0 represent dissimilar profile shapes, or less stability (figure S4). We then examined human and natural factors related to the SSC profile stability value for each river using dam and basin properties from NID and StreamCat (Hill et al 2016), such as drainage area (km2) at the outlet of each major river, percent cropland cover within the drainage area, and the median dam height (m) along major rivers.
3. Results and discussion
3.1. Model validation
Our model performed as well or better than most Landsat-based empirical SSC models (table S1) with error metrics of MAE = 12 mg l−1, RMSE = 29 mg l−1, and relative bias = 0.59 (figure 1). Published models use various error metrics and showed RMSE ranging from 16 to 286 mg l−1, MAE 10–12 mg l−1, and relative bias of 0.73. We examined error metrics stratified by latitude, longitude, and time period and found no evidence of spatial or temporal biases (figure S5). Our model differs from most published models in three major ways. First, it can predict across Landsat 5, 7, and 8 while only one other Landsat-based SSC model was found with this capability (Du et al 2020). Second, our model was trained on and can predict over a diverse set of US rivers, lakes, and estuaries, whereas most models were only trained over a small region or a particular waterbody type, except for a global river model by Dethier et al (2020) and a global, largely coastal-based model by Balasubramanian et al (2020). Third, our model is ML based, as is Peterson et al (2018), and can extract complex relationships that classic regression techniques cannot. However, ML models are limited to the range of the training data, here 0.1–2228 mg l−1. Further limitations and future improvements of our SSC model are discussed in supplemental information.
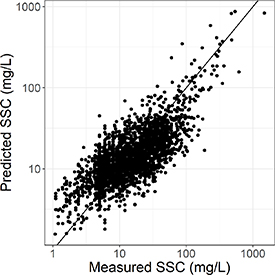
Figure 1. Hold out test results (n = 2407) of the ML algorithm trained on 21 617 SSC-Landsat matchups from rivers, lakes, and estuaries across the US showing a root mean square error (RMSE) of 29 mg l−1, mean absolute error (MAE) of 12 mg l−1, bias of 4.2 mg l−1, and relative bias of 0.59.
Download figure:
Standard image High-resolution image3.2. Multi-decadal SSC trends and potential ecosystem consequences
Mapping long-term trends in SSC since 1984, we found declining SSC not only at basin outlets but rather throughout entire river networks. Mean annual SSC decreased in 32% of US rivers by length, increased in 2%, and had no significant trend (p > 0.05) in the remaining 66% (figure 2). Rates of decline ranged from 0.02 to 15.6 mg l yr−1 with a mean decline of 0.52 mg l yr−1 (figure S6). Using the annual percent decline to estimate total change over the 34 year period showed a mean SSC reduction of 40% across all declining rivers with a range of 9%–98%. Our results agree with analysis of in-situ data on the magnitude of SSC reductions, which found a mean SSC reduction of 37% across 140 sites in the US (Murphy 2020). The similar magnitudes of SSC reduction suggest our image-based database accurately captures SSC changes. However, we found fewer declining SSC trends with 33% (n = 28 397) of river reaches declining compared to 58% (n = 140 sites) (Murphy 2020). The disparity in percent declining SSC trends suggests a small sample of in-situ observations is not fully representative of the large scale trends in SSC that we can obtain through remote sensing (Stanley et al 2019). We also attribute these differences to different record lengths, from 1992 to 2012 in Murphy (2020) compared to 1984–2018 reported here.
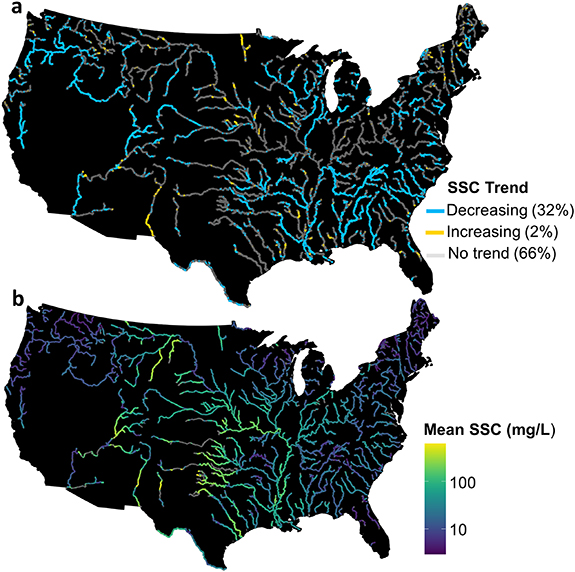
Figure 2. (a) Map of trends in mean annual SSC from 1984 to 2018 showing the percent of US river kilometers affected by decreasing, increasing, or no significant trend. Note, rivers that did not meet data quality criteria for trend analysis are visualized as no trend for visual clarity, but not included in calculations. (b) Map of the long-term mean SSC. Rivers in gray did not have enough observations for computing representative long-term means.
Download figure:
Standard image High-resolution imageThe consequences of widespread SSC declines for river ecosystems have not been studied at this scale but could lead to cascading changes in biogeochemical cycles and habitat. As SSC is the main driver of light attenuation in rivers (Davies‐Colley and Nagels 2008), entire rivers are potentially becoming more clear, which might lead to increased primary productivity and photodegradation of carbon (Cory and Kling 2018). High SSC also stimulates nitrogen removal through denitrification occurring on particles, as well as production of nitrous oxide, a potent greenhouse gas (Liu et al 2013, Reisinger et al 2016), as most nitrous oxide emissions in rivers are produced in the water column (Gardner et al 2016, Wang et al 2022). Declines in SSC could therefore lead to more bioavailable nitrogen due to decreased denitrification, more algal blooms due to the combined impact of increased light and nitrogen availability, and, under extreme SSC reductions, increased vegetation or algal growth on river bottoms. Such changes would represent a major shift in the ecology of large rivers. In some cases, declines in SSC might point to successful management and reduction of soil erosion (Meade and Moody 2010). However, prior to widespread damming starting in the early 1900s, suspended sediment loads in North American rivers were 23%–167% higher on average than modern sediment loads (Dethier et al 2022, Syvitski et al 2022). SSC was likely much higher a century ago, suggesting some rivers might have already undergone ecosystem regime shifts in part due to SSC reductions.
3.3. Longitudinal SSC patterns along rivers
SSC increased downstream in 117 rivers (48%), decreased downstream in 68 rivers (28%), and had no significant pattern (p > 0.05) in 59 rivers (24%). Rivers with longitudinal decreases or no longitudinal pattern had greater spatial variability in SSC on average than rivers with longitudinal SSC increases, likely due to effects of dams and flow barriers (figures 3 and S7). Dams and their reservoirs were larger on average on rivers with longitudinal decreases or no pattern compared to rivers with longitudinal SSC increases, with a 5.6 m taller median dam height of 16.6 m compared to 11 m (p = 0.009, Kruskal–Wallis test) and double the median reservoir water storage of 0.96 mm compared to 0.46 mm (p = 0.008). However, there were no differences in cumulative metrics along rivers such as total reservoir water storage (p = 0.56), and dam density was surprisingly higher in rivers with longitudinal SSC increases, 0.012 compared to 0.009 dams km−1 (p = 0.02; figure S8). Our results suggest a few large storage dams, rather than many smaller dams, are linked to progressive longitudinal SSC decreases.

Figure 3. Examples of annual SSC profiles along six major US rivers. Major dams are shown in black triangles. Temporal SSC declines from 1984 to 2018 along entire rivers can be seen along the Mississippi and Columbia Rivers. Note, the Colorado River has missing data due to poor remote sensing data quality.
Download figure:
Standard image High-resolution imageA majority of rivers now have different longitudinal SSC patterns than they did before the onset of widespread river damming in the early 1900s. Modeled SSC profiles were available for 66 rivers. Of the 66 rivers, 53% changed longitudinal patterns comparing modeled no-dam profiles to contemporary observed profiles (figure 4). Notably, the Colorado, Snake, and Rio Grande Rivers showed longitudinal SSC increases before damming, but now show rapid longitudinal decreases. In contrast, the Potomac, Willamette, Cumberland Rivers showed longitudinal SSC decreases before damming, but are now increasing downstream. In addition to the observed association between large dams and longitudinal SSC decreases, shifts in longitudinal SSC patterns between no-dam simulations and current observations is further evidence that dams alter SSC patterns along entire rivers, often leading to longitudinal SSC decreases. Since the onset of widespread damming, about half of large US rivers and their biota likely encountered different longitudinal SSC patterns.

Figure 4. (a) Proportion of longitudinal SSC trends that shifted between decreasing, increasing, and no longitudinal trend comparing simulations without dams to observed SSC profiles. (b) Long-term mean modeled and observed SSC profiles along the Yellowstone River, example of river without dams. (c) The Potomac River, example of a shift from decreasing to increasing. (d) The Colorado River, example of a shift from increasing to decreasing. Triangles on (b)–(d) are major dams.
Download figure:
Standard image High-resolution image3.4. Stability in annual SSC profiles
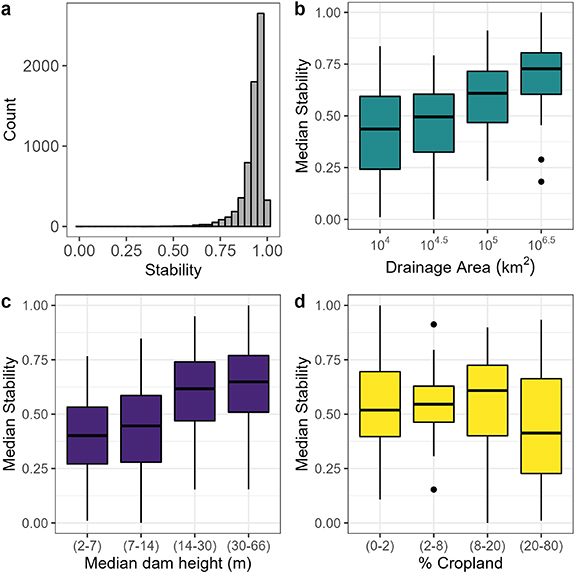
While many rivers may have different longitudinal SSC patterns than they would without dams, the shape of observed SSC profiles are remarkably similar from year to year within a river since 1984 (figure 3). SSC profile stability values are skewed toward high, more stable values (figure 5). Less stable SSC profiles are slightly more likely to occur during the most extreme high or low flows, but all other flows showed no differences in stability (figure S9). Despite the stochastic nature of river hydrology and sediment transport, the shape of SSC profiles is consistent over time for a given river, with persistent locations of high and low SSC along rivers.
Figure 5. Inter-annual stability in SSC profiles and factors that influence median stability. (a) Histogram of stability from all years and all rivers where values have been normalized to 0–1 (1 = most stable, 0 = least stable). (b) Median stability within each river versus drainage area. Drainage area grouped into four groups with approximately equal sample size with axis labels showing the maximum drainage area in each group for clarity. (c) Median stability within each river versus median dam height along each river. (d) Median stability within each river versus the % cropland cover.
Download figure:
Standard image High-resolution image
Examining human and natural factors related to the stability of SSC profiles, we found 41% of the variation in the mean stability was explained by drainage area (p < 1 × 10⁻¹⁶), median dam height along the river (p = 0.0002), and percent cropland in the drainage area (p = 0.0008) using multiple linear regression. Larger basins with minimal agriculture and tall storage dams have the most stable SSC profiles on average (figure 5). Drainage area can be interpreted as a first order control over SSC profile stability, which is modified by secondary human influences of land use and dam size. SSC in large basins that generate larger rivers with higher flows are more resistant to changes in concentration from additional sediment inputs, therefore larger basins show greater SSC profile stability. The inverse correlation between cropland cover and stability suggests that cropland is a sediment source due to soil erosion (Walling and Webb 1996). The effect of cropland is complex, with potential threshold effects (figure 5(d)). At high cropland cover, and likely high connectivity to agricultural land, sediment is mobilized at different locations and times along a river network, leading to less stable SSC profiles from year to year. In contrast, dams and river management stabilize SSC profiles due to both reduced flow variability (Poff et al 2007) and reservoirs acting as sediment sinks, creating consistent zones of sediment erosion and deposition along rivers (Kondolf 1997, Vörösmarty et al 2003). The influence of dams and land use suggests humans are an important force in determining the shape of SSC profiles along rivers.
4. Conclusion
One-third of large US rivers have declining SSC trends, with a mean reduction of 40% since 1984, while only 2% of rivers show increases. Our spatially continuous view provides the most comprehensive accounting of SSC trends to date. We can pinpoint where rivers are changing and examine potential impacts on riverine ecosystems. While both dams and agricultural expansion are known to cause decreases and increases in SSC and flux over time, our results also link dams and land use to the shape and stability of SSC profiles. Modern rivers with at least a few large dams now have different, yet stable, SSC profile shapes compared to historical patterns before dams. River biota and their ecosystems might be forced to adapt to particular longitudinal SSC patterns similar to how river biota adapt to natural flow and SSC regimes over time (Poff et al 1997, Wohl et al 2015). RivSed has broad applications in river geomorphology, hydrology, and ecology and we are expanding the database to a global scale. With global SSC observations combined with river flow from the NASA Surface Water Oceanography and Topography mission (Biancamaria et al 2016), we will gain an unprecedented view of suspended sediment movement through Earth's rivers.
Acknowledgments
Thank you to members of the Global Hydrology Lab at University of North Carolina-Chapel Hill for many discussions about this data.
Data availability statement
SSC database and associated data (river flowlines, matchup database, training data, and SSC algorithm) are available in an open access Zenodo repository. https://zenodo.org/record/4900563#.ZGJo3XbMKUk
All other data used to generate this database and conduct scientific analyses presented are publicly available including:
Aquasat: https://doi.org/10.6084/m9.figshare.c.4506140.v2
RiverSR (River Surface Reflectance): https://doi.org/10.5281/zenodo.4304567
NABD: www.sciencebase.gov/catalog/item/56a7f9dce4b0b28f1184dabd
NID: www.sciencebase.gov/catalog/item/56a7f9dce4b0b28f1184dabd, https://nid.sec.usace.army.mil/#/
NHDPlusV2: www.epa.gov/waterdata/nhdplus-national-hydrography-dataset-plus,
StreamCat: www.epa.gov/national-aquatic-resource-surveys/streamcat-dataset
Landsat: images accessed via Google Earth Engine (www.usgs.gov/land-resources/nli/landsat/landsat-collection-1?qt-science_support_page_related_con=1#qt-science_support_page_related_con)
The data that support the findings of this study are openly available at the following URL/DOI: 10.5281/zenodo.4900563.
Code availability
Code used to create and analyze data are available at https://github.com/johngardner87/riverTSS and https://github.com/johngardner87/riverSR.
Funding
J R G was supported by NSF-EAR Postdoctoral Fellowship #1806983. S N T was supported by NASA NESSF Grant 80NSSC18K1398. S C was partly funded by NOAA through the Cooperative Institute for Research to Operations in Hydrology (CIROH), Award Number A22-0307-S003. The authors declare no conflicts of interest.
Supplementary data (1.0 MB PDF)