

Abstract
Seeking food security, contemporary Chinese agriculture has followed a trajectory of overfertilization and associated environmental problems, hence the need for nitrogen-balancing practices that do not compromise yield and quality. Here we present a national meta-analysis using 224 studies with 1972 comparisons to quantify the potential to reduce nitrogen (N) fertilization to improve environmental outcomes while maintaining yield and grain protein. We calculated a nitrogen reduction ratio (NRR), as 100 × (NC − NT)/NC; where N is N fertilizer rate and subscripts indicate farmer practice (C) and reduced N rate treatment (T). Our meta-analysis showed that the NRR that maintained yield and grain protein content at the level of current practice was up to 10% in wheat and up to 30% in maize and rice. Larger yield-neutral NRR could be achieved in more fertile, heavier-textured soils, and with practices including enhanced-efficiency N fertilizer, combined application of organic and inorganic N fertilizer, and incorporated straw. Assuming a reduction in N fertilizer usage by 10% for wheat and by 30% for maize and rice in the current cropping area, there is a potential to save 5.7 Mt N yr−1; reduce loss of reactive nitrogen by 1.26 Mt N yr−1, equivalent to 63% of annual total Nr losses for rice in China, reduce N-related greenhouse emissions by 75.2 Mt CO2-eq yr−1, equivalent to 14.5%–25% of the emissions associated with the N fertilizer chain in China; and improve N use efficiency by 23%. Our results highlight the feasibility of maintaining yield and grain protein, and achieving substantial environmental benefits with reduced fertilization rate, and the environmental and agronomic scenarios where these outcomes are more likely.
Export citation and abstract BibTeX RIS

Original content from this work may be used under the terms of the Creative Commons Attribution 4.0 license. Any further distribution of this work must maintain attribution to the author(s) and the title of the work, journal citation and DOI.
1. Introduction
Wheat (Triticum aestivum L.), maize (Zea mays L.) and rice (Oryza sativa L.), the focus of this study, are the cornerstone of global food security, supplying more than 42% of all calories and 37% of the protein consumed by the global population (FAO 2016, Ricepedia 2020). These crops accounted for 57% of the acreage and 91% of total grain production in China in 2020 (NBSC 2021). Over the last six decades, the yield of crops in Chinese farms has increased at 1.38% yr−1 for wheat, 1.15% yr−1 for rice and 1.32% yr−1 for maize (Liu et al 2021). Increasing rates of N fertilizer have been a major driver of these gains (Yu et al 2019, He et al 2022). Between 1980 and 2020, the use of N fertilizer has increased nearly two-fold, reaching approx. 18.3 Mt (NBSC 2021), of which 30% was lost to the environment (Zhang et al 2020). Excess reactive nitrogen (Nr) in the system has serious environmental consequences (Cui et al 2018); hence yield- and protein-neutral practices are needed to reduce N rate, Nr pollution and N related greenhouse gas emissions.
In 2015, the Ministry of Agriculture in China announced a 'Zero Increase Action Plan' aimed at reducing fertilizer use (Liu et al 2016, Xia et al 2017). In response to this, many trials have compared farmer's practice with lower fertilizer rates across China. For example, reducing N rate by about 25% did not affect rice yield and mitigated N loss by 24%–47% in a fertile soil but reduced yield by 10% in poor soils (Wang et al 2012, Xue et al 2014). Liu et al (2020) found that 25%–50% N reductions did not affect or increased maize yield in most of the years in Eastern China. In the North China Plain, a nitrification inhibitor could improve the synchronization of N supply and crop N demand, decrease N usage by 37%, improve wheat yield by 9%, and reduce N2O emissions by 27% (Xia et al 2017, Bhandari et al 2020). Based on N gradient experiments from 2005 to 2015, and a farmer survey in 2008 for wheat, maize and rice across China, Ren et al (2022) reported that farmer's conventional N rate could be reduced by 15%–19% without changing farmers' operational practices, crop yield could increase by 10%–19%, N surpluses could drop by 40% and thus, NUE (the efficiency of all N inputs transferring to harvested crop N) could improve by 32%–46%. Owing to a myriad of soil, crop and management influences, the long-term implications of these findings are uncertain. Additionally, previous studies have not assessed the effects of reduced N usage on grain quality and N-related greenhouse gas emissions.
Previous meta-analyses have focused on aspects of N management in China (Huang et al 2016, Xia et al 2017, Ding et al 2018, Zhang et al 2020, Hou et al 2021, Mi et al 2022), and elsewhere (Linquist et al 2013, Li et al 2018, Huddell et al 2020, Hu et al 2021). Less research has been done on the simultaneous evaluation of the productive (yield and quality) and environmental consequences of reduced rates of N fertilizer relative to farmers' practice at national scale.
Here we present a national meta-analysis using 224 studies with 1972 comparisons to (i) quantitatively summarize the effects of N fertilizer reduction ratios on wheat, maize and rice yield and grain protein, (ii) identify the maximum reduction ratio that maintains crops yield and grain protein at the level of current practice, and its long-term implications, and (iii) assess the extent of N surplus, N fertilizer saving, and the reduction in both the release of Nr and N related greenhouse gas (N-GHG) emissions under alternative N-reduction scenarios.
2. Materials and methods
2.1. Data collection and selection criteria
We searched the peer-reviewed literature for publications reporting the effects of N fertilizer reduction on grain yield and grain protein content of wheat, maize and rice in China. Papers published until March 2023 were collected from the Web of Science (http://apps.webofknowledge.com/) and China National Knowledge Infrastructure (www.cnki.net/). Specific search terms were combined, related to crops (wheat, maize and rice), N fertilizer application rate (N rate, reduced N rate, N management, optimal N management), and productivity and grain protein (grain yield, grain protein, grain N removal and aboveground N removal). To minimize bias, the articles included in this study were screened based on four criteria:
- (1)studies were conducted in field-grown wheat, maize and rice, with locations reported clearly (e.g. longitude and latitude), excluding inter-cropping, greenhouse, lysimeter and pot experiments;
- (2)studies included side-by-side comparisons of farmers' conventional N rate (control, investigated by researchers) and reduced N rate (treatment) with otherwise similar conditions (i.e. phosphorus and potassium fertilizer, cultivar, etc.); for multi-year and/or multi-site studies, all data were used;
- (3)studies reported at least grain yield or grain protein (or grain nitrogen content) measured at maturity, and the experiment had at least three replications.
- (4)data from the same experiment but reported in more than one publication were not repeated; the publication with the most complete dataset or combination of data from different periods was used.
Based on these criteria, 224 published papers were included in our analysis returning 492 (yield) and 75 (protein) pairwise comparisons for wheat; 554 (yield) and 91 (protein) comparisons for maize; and 617 (yield) and 143 (protein) comparisons for rice. The figure 1 shows their geographic distribution.

Figure 1. Distribution of experimental sites.
Download figure:
Standard image High-resolution imageThe mean (M), sample size (N), and standard deviation (SD) or standard error (SE) for both control and treatment were derived from tables or digitized from figures (Getdata Graph Digitizer http://getdata-graph-digitizer.com/), or calculated from related variables. In addition to grain yield and grain protein, we extracted crops N removal (grain N removal and aboveground N removal), experiment location, experiment duration, N fertilizer type, tillage practice, mean annual precipitation (MAP), mean annual temperature (MAT), soil texture, pre-sowing soil nutrient status including organic matter, mineral N, available phosphorus and available potassium. N fertilizer type included conventional chemical nitrogen fertilizers (i.e. urea and compound fertilizer), alternatives to modulate the release of N including slow- or control-released N fertilizers, and conventional N fertilizers with nitrification or urease inhibitor, and combining application of inorganic and organic N fertilizers. To investigate the long-term consequences of N fertilizer reduction, the number of years since the initiation of N fertilizer reduction experiment was recorded for each observation. Observations were excluded from the analysis of experiment duration when mean yield across years were presented.
2.2. Data analysis
We calculated N fertilizer reduction ratio (NRR) as:
where N is N fertilizer rate and subscripts indicate farmer practice (C) and reduced N rate treatment (T). Then, NRR (%) data were divided into seven groups, i.e. NRR 5%–10% (NRR10), 10%–20% (NRR20), 20%–30% (NRR30), 30%–40% (NRR40), 40%–50% (NRR50), 50%–60% (NRR60) and 60%–80% (NRR80) for further meta-analysis. We merged NRR 60%–70% and NRR 70%–80% into NRR 60%–80% due to shortage of data in these groups.
The effects of NRR on grain yield were categorized for crop species, regions, experiment duration, N fertilizer type, tillage practice, MAP, MAT, soil texture, and pre-sowing soil nutrient status (supplementary table S1). The smaller data set for grain protein only allowed for comparisons between crop species (supplementary table S1).
The effect size was calculated as the natural log (ln R) of response ratio (Hedges et al 1999):
where M is the mean grain yield or grain protein content and subscripts indicate reduced N treatment (T) and farmer control (C).
The variance (V) of ln R was calculated as:
where SD is standard deviation and N sample size, with subscripts indicating treatment (T) and control (C).
For studies that only reported SE or coefficient of variation (CV) and not SD, the SD was calculated as follows:


where M is the mean of the treatment or control. In 53% of the studies that did not report SD, SE or CV, we assumed SD = 10% of the mean (Gattinger et al 2012, Zhao et al 2017).
Weighted means were used since individual experiments often differ in their statistical precision (Curtis and Wang 1998). The weighted mean log ratio (ln  ) was used, which produced the greatest precision, and calculated using the following equations:
where the weighting factor  is the reciprocal of the total variance of
  .
.
Mean effect sizes and the 95% bootstrapped confidence intervals were generated by a bootstrapping procedure with 9999 iterations using METAWIN 2.1. Inverse variance statistical methods were adopted for the meta-analysis. To facilitate interpretation, the percentages of changes in grain yield and grain protein content were calculated by (R − 1) × 100%. As the Kolmogorov–Smirnov test indicated that the distributions of grain yield of overall, wheat and maize were not normal (P < 0.01, figure S1), we used the resampling method (bootstrapping) as described above to generate means and 95% bootstrapped confidence intervals for overall, wheat and maize grain yield, as well as subsets of grain yield (Shcherbak et al 2014). Results were considered significant if the 95% bootstrapped confidence intervals did not overlap with zero, and means were considered to be significantly different from each other if their 95% bootstrapped confidence intervals did not overlap (Hedges et al 1999).
2.3. Estimation of N surplus (Nsur) and N use efficiency (NUE)
In this study, the main external N inputs (Ninput, kg N ha−1) included N fertilizer, atmospheric deposition and biological N fixation. N input from irrigation and seed were not considered. N output (Noutput, kg N ha−1) comprised two scenarios: (1) N output included the N harvested in grain without considering straw (Nhar, kg N ha−1), i.e. 100% straw return; (2) N output included the N harvested in grain and straw, i.e. 100% straw removal. The Nsur and NUE were calculated as follows:

N input from biological N fixation was assumed at 5 kg N ha−1 for wheat and maize, and 25 kg N ha−1 for rice (Zhang et al 2019, Ren et al 2022). N input from atmospheric deposition was obtained from the seasonal average N deposition summarized by Ren et al (2022) who reported regional N deposition rate for wheat, maize and rice in China (supplementary table S2).
Some experiments did not report grain N removal, aboveground N removal or crop N content. Thus, grain N removal was estimated by multiplying grain yield by grain N content, using the values reported by Ren et al (2022), i.e. 2.3% for wheat, 1.4% for maize and 1.9% for rice. The aboveground N removal was estimated from the relationship between aboveground N uptake and grain yield as reported by Yin et al (2021), as follows:


where Nuptake is aboveground N uptake (kg N ha−1) and Y is grain yield (Mg ha−1).
2.4. Estimation of reactive N loss and N-related greenhouse gas emission
The reduction of N input per unit area was calculated as the farmer's conventional N rate in each region multiplying the maximum allowable NRR for each crop, i.e. 10% for wheat and 30% for maize and rice (table 1, supplementary table S4).
Table 1. The potential to reduce nitrogen input and reactive nitrogen (Nr) loss and N-related greenhouse gas (N-GHG) emissions in response to yield- and protein-neutral nitrogen fertilizer reduction ratios for wheat, maize and rice in six regions in China: north-east (NE), north-west (NW), north-central (NC), the middle and lower reaches of Yangtze River (MLYR), south-west (SW) and south (S).
| Crop | NRR (%) | Region | Planting area (M ha) | Reduction in N input | Reduction in Nr loss | Reduction in N-GHG | |||
|---|---|---|---|---|---|---|---|---|---|
| kg N ha−1 yr−1 | Mt yr−1 | kg N ha−1 yr−1 | Mt yr−1 | kg CO2-eq ha−1 yr−1 | Mt CO2-eq yr−1 | ||||
| Wheat | 10 | NC | 12.6 | 26 | 0.32 | 7.5 | 0.095 | 363 | 4.6 |
| NW | 3.4 | 24 | 0.08 | 4.5 | 0.015 | 342 | 1.2 | ||
| MLYR | 6.4 | 24 | 0.15 | 5.2 | 0.034 | 338 | 2.2 | ||
| SW | 1.1 | 18 | 0.02 | 3.6 | 0.004 | 260 | 0.3 | ||
| Total | 23.6 | 25 | 0.58 | 6.3 | 0.15 | 350 | 8.2 | ||
| Maize | 30 | NE | 13.6 | 65 | 0.89 | 5.5 | 0.075 | 923 | 12.6 |
| NC | 13.2 | 77 | 1.01 | 27.6 | 0.365 | 1085 | 14.3 | ||
| NW | 7.9 | 84 | 0.66 | 7.6 | 0.060 | 1186 | 9.4 | ||
| MLYR | 3.0 | 98 | 0.30 | 34.3 | 0.104 | 1382 | 4.2 | ||
| SW | 4.7 | 76 | 0.36 | 19.9 | 0.094 | 1081 | 5.1 | ||
| Total | 43.3 | 76 | 3.28 | 16.4 | 0.71 | 1074 | 46.5 | ||
| Rice | 30 | NE | 5.2 | 55 | 0.29 | 6.8 | 0.035 | 611 | 3.2 |
| MLYR | 15.1 | 66 | 1.00 | 16.5 | 0.249 | 733 | 11.1 | ||
| S | 4.4 | 53 | 0.23 | 10.5 | 0.046 | 584 | 2.6 | ||
| SW | 3.9 | 63 | 0.25 | 12.9 | 0.051 | 701 | 2.8 | ||
| Total | 29.9 | 62 | 1.85 | 13.3 | 0.40 | 685 | 20.5 | ||
| Total | 5.70 | 1.26 | 75.2 | ||||||
Note: planting area of wheat, maize and rice were from NBSC (National Bureau of Statistics of China) online 2022 database (NBSC 2022). At national scale, the mean reduction in N input (kg N ha−1) or Nr loss (kg N ha−1) was calculated by taking the summation of 'reduced N input (or Nr loss) times crop planting area at each region' divided by 'the sum of crop planting area at each region'. Nr loss was the sum of NH3 volatilization, N2O emissions, nitrate leaching, and N runoff. The reduction in N-GHG (kg CO2-eq ha−1 yr−1 or Mt CO2-eq yr−1) = the reduction in N input (kg N ha−1 yr−1 or Mt yr−1) × 14.2 for wheat and maize, and ×11.1 for rice.
Based on regional Nr loss models in China reported by Cui et al (2018) (supplementary table S3), we calculated the total Nr losses (the sum of NH3 volatilization, N2O emissions, nitrate leaching, and N runoff) for all three crops under farmers' conventional N rate and reduced N usage in each region. The reduction in Nr loss was calculated as the difference between Nr loss with farmers' conventional N rate and with reduced N usage (table 1, supplementary table S4).
The total reduction in N input or Nr loss per year was derived from multiplying reduction of N input or Nr loss per unit area by the acreage of the crop from NBSC online 2022 database (NBSC 2022).
The estimate of N-related greenhouse gas (N-GHG) emissions was based on a life cycle assessment approach with a coefficient 14.2 t CO2-eq per ton of N fertilizer manufactured and used on upland crops, and 11.1 t CO2-eq per ton of N fertilizer manufactured and used on paddy rice systems in China (Zhang et al 2013). The emissions had five components: fossil fuel used for fertilizer production, transport of fossil fuel, fertilizer synthesis, fertilizer transport and distribution, and gaseous emissions (direct and indirect) when fertilizers were applied to farmland. We calculated the reduction in N-GHG emission (kg CO2-eq ha−1 yr−1 or Mt CO2-eq yr−1) as the product of the reduction in N fertilizer input and the factor 11.1 for rice and 14.2 for wheat and maize (table 1, supplementary table S4).
3. Results
3.1. Overview
A total of 224 experimental sites spanned 24 provinces and six regions, and returned 1663 pairwise comparisons for yield and 309 pairwise comparisons for protein (figure 1, supplementary table S1). In 238 out of the 309 pairwise grain protein comparisons, we used the reported grain protein content; in the remaining 71 comparisons, grain protein was calculated using reported grain N content and conversion factors: 5.7 for wheat, 6.25 for maize, and 5.95 for rice (Mariotti et al 2008).
Most experiments (83%) spanned less than 3 years and 17% had a duration of 3–10 years. The average N rate with farmer's practice was 246 kg N ha−1 (range 183–256 kg N ha−1) for wheat, 267 kg N ha−1 (range 217–324 kg N ha−1) for maize, and 217 kg N ha−1 (range 175–220 kg N ha−1) for rice (supplementary figure S2). The average yield with farmer's N rate was 7.1 t ha−1 for wheat, 9.9 t ha−1 for maize and 8.2 t ha−1 for rice (supplementary figure S3).
3.2. Yield and grain protein of wheat, maize and rice in response to N fertilizer reduction
Based on discrete categories of N reduction ratio, the N reduction by 20%–30% (NRR30) was neutral for crops yield, and yield declined with N reductions above 30% (figure 2(a)). The responses of grain yield to NRR varied with crop species, region, N fertilizer type, tillage practice, precipitation, temperature, soil texture and pre-sowing soil nutrient status (figures 2 and 4–9). Grain yield was unaffected or increased with N reductions up to 20% (NRR20) in wheat, and up to 30% (NRR30) in both maize and rice (figures 2(b)–(d)).
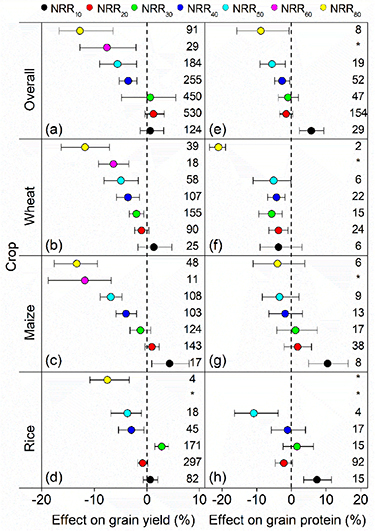
Figure 2. Effect of nitrogen fertilizer reduction ratios (NRR) on grain yield and grain protein content for the pooled crops (a) and (e), wheat (b) and (f), maize (c) and (g) and rice (d) and (h). Error bars are 95% bootstrapped confidence intervals. The number of comparisons is presented on the right side of error bar. '*' denotes no available data. Colored circles indicate nitrogen fertilizer reduction ratios.
Download figure:
Standard image High-resolution imageFor data pooled across crops, grain protein content was unaffected with N reduction up to 30% (NRR30) (figure 2(e)). Grain protein content was not affected with N reductions up to 10% (NRR10) in wheat, up to 50% (NRR50) in maize, and up to 40% (NRR40) in rice (figures 2(f)–(h)). Thus, compared with current practice, N rates can be reduced up to 10% (NRR10) for wheat, and up to 30% (NRR30) for maize and rice, with neutral effects on both yield and grain protein content.
The variation in grain yield in response to NRR10 for wheat and NRR30 for both maize and rice was stable for short and longer-term experiments (figures 3(a)–(c)). For example, the NRR10 did not affect wheat yield within three years (figure 3(a)), and NRR30 was largely neutral or slightly positive for maize and rice yield as experimental duration increased (figures 3(b)–(c)).
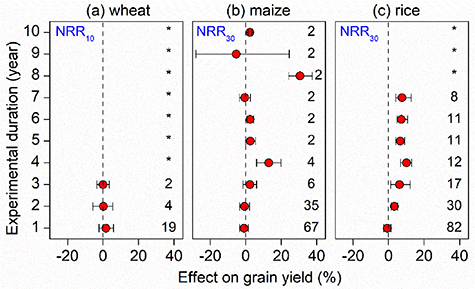
Figure 3. Effects of yield- and protein-neutral NRR on yield of wheat (a), maize (b) and rice (c) with different experimental durations. Yield- and protein-neutral NRR was NRR10 for wheat and NRR30 for both maize and rice. Error bars are 95% bootstrapped confidence intervals. The number of comparisons is presented on the right side of error bar. Red circles indicate the experiment duration.
Download figure:
Standard image High-resolution imageThe N reductions up to 40% were neutral or fractionally positive for crop yield in the northeast, north-central, and south regions, but more than 30% N reduction decreased crop yield in the northwest, southwest and the middle and lower reaches of Yangtze River, except for wheat in the northwest where a N reduction up to 50% was neutral for grain yield (figure 4). Averaged across crop species, grain yield was unaffected with N reduction up to 50% (NRR50) using enhanced-efficiency N fertilizers (figure 5(b)), and up to 40% (NRR40) under combined application of inorganic and organic N fertilizers (figure 5(c)), but declined with N reductions above 30% using conventional N fertilizer (figure 5(a)). Crop yield was unaffected with NRR30 under conventional tillage and no tillage (figures 6(a) and (b)), and with NRR50 under straw incorporated (figure 6(d)), but declined with N reductions above 20% with straw or plastic film mulching (figure 6(c)).

Figure 4. Effects of nitrogen fertilizer reduction ratios (NRR) on yield for the pooled crops, wheat, maize and rice in cropping regions of China: north-east (NE), north-west (NW), north-central (NC), the middle and lower reaches of Yangtze River (MLYR), south-west (SW) and south (S). Error bars are 95% bootstrapped confidence intervals. The number of comparisons is presented on the right side of error bar. '*' denotes no available data. Colored circles indicate nitrogen fertilizer reduction ratios.
Download figure:
Standard image High-resolution image
Figure 5. Effects of nitrogen fertilizer reduction ratios (NRR) on crop yield under conventional nitrogen fertilizer (i.e. urea and compound fertilizer) (a), enhanced-efficiency nitrogen fertilizers (i.e. slow- or control-released nitrogen fertilizers, or conventional nitrogen fertilizers plus nitrification or urease inhibitor) (b), and combining application of organic and inorganic N fertilizer (c). Error bars are 95% bootstrapped confidence intervals. The number of comparisons is presented on the right side of error bar. '*' denotes no available data. Colored circles indicate nitrogen fertilizer reduction ratios.
Download figure:
Standard image High-resolution image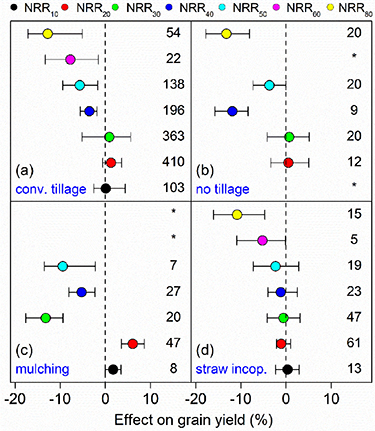
Figure 6. Effects of nitrogen fertilizer reduction ratios (NRR) on crop yield under conventional tillage (a), no tillage (b), straw or plastic film mulching (c) and straw incorporated (d). Error bars are 95% bootstrapped confidence intervals. The number of comparisons is presented on the right side of error bar; '*' denotes no available data. Colored circles indicate nitrogen fertilizer reduction ratios.
Download figure:
Standard image High-resolution imageThe maximum NRR that maintained crop yield at the level of current practice was lower in cold (MAT <7 °C) and dry climates (MAP <400 mm) than in warmer, wetter climates with temperature and rainfall above these thresholds (figure 7). On sandy soil, reducing N application rate decreased crop yield (figure 8(a)), but crop yield was unaffected with N reduction up to 30% (NRR30) on loam soil and up to 50% (NRR50) on clay soil (figures 8(b) and (c)). Larger N reduction ratios that maintained crop yield at the level of current practice were found on soils with higher content of organic matter, mineral N, available phosphorus and available potassium irrespective of crop species (figure 9). For example, the N reduction by 30%–40% (NRR40) was neutral or positive for crop yield when soil organic matter was above 15 g kg−1, mineral N above 30 mg kg−1 and available phosphorus above 15 mg kg−1, but grain yield declined with N reductions over 20% or 30% below these thresholds (figure 9).

Figure 7. Effects of nitrogen fertilizer reduction ratios (NRR) on crop yield under different mean annual precipitation (MAP) and mean annual temperature (MAT) gradient. Error bars are 95% bootstrapped confidence intervals. The number of comparisons is presented on the right side of error bar; '*' denotes no available data. Colored circles indicate nitrogen fertilizer reduction ratios.
Download figure:
Standard image High-resolution image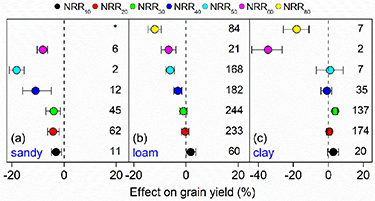
Figure 8. Effects of nitrogen fertilizer reduction ratios (NRR) on crop yield on soils with sandy, loam and clay texture. Error bars are 95% bootstrapped confidence intervals. The number of comparisons is presented on the right side of error bar; '*' denotes no available data. Colored circles indicate nitrogen fertilizer reduction ratios.
Download figure:
Standard image High-resolution image
Figure 9. Effects of nitrogen fertilizer reduction ratios (NRR) on crop yield on soils with different content of organic matter (a) and (b), mineral nitrogen (c) and (d), available phosphorus (e) and (f) and available potassium (g) and (h). Error bars are 95% bootstrapped confidence intervals. The number of comparisons is presented on the right side of error bar; '*' denotes no available data. Colored circles indicate nitrogen fertilizer reduction ratios.
Download figure:
Standard image High-resolution image3.3. N surplus, NUE, Nr loss and N-GHG emission in response to the yield- and protein-neutral NRR
The N surplus varied from 107 to 124 kg N ha−1 for wheat at NRR10, from 59 to 107 kg N ha−1 for maize and from 55 to 63 kg N ha−1 for rice at NRR30 under different straw management. Compared with farmers' N rate, NRR10 for wheat and NRR30 for maize and rice reduced N surplus by 14%–46% under complete straw return, and by 16%–54% under complete straw removal (figures 10(a) and (b)), improved NUE by 8%–32%; the NUE of all the three crops at the yield- and protein-neutral NRR was between 54% and 66% (figure 10(c)).

Figure 10. The nitrogen surplus (a) and (b) and nitrogen use efficiency (NUE) (c) for farmers' conventional nitrogen application rate (FN) and yield- and protein-neutral nitrogen reduction (NRR10 for wheat and NRR30 for maize and rice) under different straw management (a, straw return; b, straw removal). Straw return, return all straw to soil, i.e. nitrogen output included the nitrogen harvested in cereal grain without considering straw; straw removal, removal all straw after crop harvest, i.e. nitrogen output included the nitrogen harvested in cereal grain and straw. The solid lines and green circle in the boxes indicate the median and mean, respectively. The box boundaries indicate the 75% and 25% quartiles, and the whisker caps indicate the 95th and 5th percentiles. The mean of nitrogen surplus and NUE is also presented above the boxes. The dashed lines are drawn at nitrogen surplus = 0 (a) and (b).
Download figure:
Standard image High-resolution image
For the yield- and protein-neutral, the reductions in N input and Nr loss and N-GHG varied with crop specie and region. For example, the saving of N and the reductions in Nr loss and N-GHG emissions were higher in maize than in rice and wheat (table 1). Larger reductions in N input and Nr loss and N-GHG for wheat were found in north-central region, and for rice in the middle and lower reaches of Yangtze River. The reduction in N input and Nr loss and N-GHG of per unit area for maize were greater in the middle and lower reaches of Yangtze River than in the other four regions, but total reduction per year was higher in the north-central region due to larger acreage (table 1). The annual total reduction in N input was 0.58 Mt for wheat, 3.28 Mt for maize and 1.85 Mt for rice, a total of 5.7 Mt. The annual total reduction in Nr loss was 0.15 Mt for wheat, 0.71 Mt for maize and 0.4 Mt for rice, a total of 1.26 Mt. The annual total reduction in N-GHG emission was 8.2 Mt CO2-eq for wheat, 46.5 Mt CO2-eq for maize and 20.5 Mt CO2-eq for rice, a total of 75.2 Mt CO2-eq (table 1).
4. Discussion
4.1. Yield and grain protein in response to N fertilizer reduction
To meet the food demand of a larger and wealthier Chinese population, policies were implemented to encourage crop production and use of fertilizer during the last three-four decades. Consequently, over-fertilization of grain crops is widespread (Chen et al 2014, Cui et al 2018, Zhang et al 2019, He et al 2022). We found an average N rate with farmer's practice of 246 kg N ha−1 for wheat, 267 kg N ha−1 for maize and 217 kg N ha−1 for rice (supplementary figure S2), that compare with the optimal N application rate reported by Ren et al (2022), i.e. 178 kg N ha−1 for wheat, 184 kg N ha−1 for maize and 170 kg N ha−1 for rice. Several drivers underlie the over-use of fertilizer: (i) low fertilizer price and government subsidies to boost grain production (Ju et al 2009, Sun et al 2012, Zhang et al 2013, Wu et al 2018); (ii) no individual liability for environmental damage (Zhang et al 2013, 2019, Wu et al 2018); (iii) small holdings, farmer education, time, and labor constraints; and (iv) risk-averse decisions and short-term perspectives (Smith and Siciliano 2015, Vollan et al 2016, Cui et al 2018, Wu et al 2018, van Wesenbeeck et al 2021). In this context, yield- and protein-neutral N reduction is critical for China's response to the multiple challenges from crop self-sufficiency, environmental protection, and farmer livelihood. The benefits of yield- and protein-neutral N reduction arise from improved farmer income due to lower N input (Zhang et al 2018, Mi et al 2022), and reduced risk of environmental pollution from N loss; for example, the N stored in soil would be depleted in some regions with high N residue, which would further reduce the risk of N leaching (Ju et al 2009, Zhou et al 2016, Xia et al 2017, Zhang et al 2019).
Compared with farmers' conventional N rate, we found a N reduction up to 10% in wheat, and up to 30% in maize and rice was neutral for both yield and grain protein content. The potential to reduce N fertilizer input can be attributed to substantial N accumulation in the soil profile due to long-term overfertilization (Zhou et al 2016, Huang et al 2017, Zhang et al 2019), and current fertilizer inputs exceeding the need for the attainable yield (Ju et al 2009, Liu et al 2020). The depletion of soil N reserves is therefore important for the long-term implementation of N saving practices.
Larger N reduction ratios that maintained yield at the level of current practice were found in the northeast, north-central and south regions, which might be attributed to higher soil fertility with strong N supply potential in the northeast and south regions (Yu et al 2006, Liang et al 2019) and greater N fertilizer inputs in the north-central region (Cui et al 2018, Wang et al 2018, Zhang et al 2019, 2020). Consistent with this interpretation, N reduction potential was generally larger with combined application of inorganic and organic N fertilizers (figure 5(c)), and on soils with higher content of organic matter, mineral N, and available phosphorus and potassium (figure 9).
Modulating the release of N fertilizer is effective to decrease the input of mineral N fertilizer, such as using enhanced-efficiency N fertilizers (Ding et al 2018, Li et al 2021, Zhang et al 2022). We found that practices that improved synchronization between crop N demand and N supply during the growing season have larger potential of N reduction in all three crops. The benefit of enhanced-efficiency N fertilizers arises from improved crop yield and N use efficiency, reduced N loss, and saved labor due to one-time application (Huang et al 2016, Xia et al 2017, Zhang et al 2019, Mi et al 2022). However, the higher price and immaturity of the technology has limited the adoption of enhanced-efficiency N fertilizers in China (Zhou 2020). For example, China's consumption of slow- or control-released fertilizers in 2015 was about 2 Mt, accounting for about 1% of the total fertilizer use (Zhou 2020). Incentives are needed for the adoption of this technology.
The potential to reduce N fertilizer for all three crops was lower under straw or plastic film mulching than for crops under conventional tillage. This might be associated with higher yield and shoot biomass, hence higher N demand under mulch (Ren et al 2019, Chen et al 2020). The higher N reduction ratio in crops with soil incorporated stubble might be ascribed to improved soil fertility (Wang et al 2015, Qin et al 2021), and enhanced microbial activity that modulates N transformations in soil and improved synchrony between N supply and crop demand (Liang et al 2013). Reducing N usage significantly decreased crop yield on sandy soil, probably a reflection of low soil fertility and poor N retention (Arora et al 1993, Liu et al 2022). Thus, reducing N losses while maintaining crop yield and protein on sandy soils would require other practices such as using enhanced-efficiency N fertilizers (Li et al 2018) and split N application (Hu et al 2021).
Reducing N input up to 10% did not reduce wheat yield after three years, and reducing N input up to 30% did not affect maize yield after ten years and rice yield after seven years (supplementary figure S4). The longevity for this practice could be ascribed to high soil nitrogen and N surplus in the system. In these N reduction experiments, the mean content of soil mineral N in the plough layer was 45 mg kg−1 for wheat, 38 mg kg−1 for maize, and 54 mg kg−1 for rice, which indicated that N reduction potential was larger on these soils (soil mineral N >30 mg kg−1, figure 9(d)).
4.2. N surplus and NUE in response to the yield- and protein-neutral NRR
At the yield- and protein-neutral NRR, wheat had the largest N surplus (N surplus >100 kg N ha−1) and the lowest NUE. This is because the yield- and protein-neutral NRR was lower in wheat (NRR10) than in maize and rice (NRR30). Moreover, maize showed higher N surplus and lower NUE compared with rice, which was attributable to the greater N input (supplementary figures S2 and S3) and less N output due to the lower grain N content compared with rice (Zhang et al 2019).
The NUE of all three crops was between 50% and 90% at the yield- and protein-neutral NRR, and below 50% at farmers' practice (supplementary figures S5 and 10). The former is close to the benchmark set by the EU Nitrogen Expert Panel (2015). Consistently, NRR30 for maize and rice under straw removal returned a N surplus (55–59 kg N ha−1) below the 80 kg N ha−1 suggested by the EU Nitrogen Expert Panel. Since 2000, the Chinese government has banned straw burning and implemented economic incentives to return straw to fields (Zhang et al 2019). Thus, NRR30 for maize and rice is unlikely to mine soil N under straw return. Nevertheless, a few cases of negative N balance were found at the yield- and protein-neutral NRR (figure 10), which suggest long-term monitoring is necessary to avoid shifting the system to a N-mining phase (Jobbágy and Sala 2014, Angus and Grace 2017).
4.3. Total Nr loss and N-GHG emission in response to the maximum allowable NRR
The annual reduction in N input and the reductions in total Nr loss and N-GHG emission were higher in maize than in wheat and rice, partially due to the difference between crops in both acreage and current N input (supplementary figures S2 and S3; table 1). The lower reduction in Nr loss per unit area in the northwest and northeast might relate to lower temperature, less rainfall and irrigation (Cao et al 2014, Huddell et al 2020, Hou et al 2021, Zhang et al 2021).
Many factors, outlined above, have favored overfertilization. If these factors were removed, and assuming all the area was to reduce N fertilizer usage by 10% in wheat and by 30% in maize and rice, the annual amount of N saved would be 0.58 Mt for wheat, 3.28 Mt for maize and 1.85 Mt for rice, a total of 5.7 Mt. This amount of saved N is larger than the total annual agricultural N fertilizer consumption in some countries, like Brazil (4.9 Mt), Pakistan (3.5 Mt), Indonesia (2.9 Mt), and Canada (2.6 Mt) (FAO 2021). The total Nr loss would be decreased by 0.15 Mt for wheat, 0.71 Mt for maize and 0.4 Mt for rice, a total of 1.26 Mt, which would be equivalent to 63% of annual total Nr losses for rice in China (2 Mt) (Cai et al 2023). The N-GHG emission would be reduced by 8.2 Mt CO2-eq for wheat, 46.5 Mt CO2-eq for maize and 20.5 Mt CO2-eq for rice, a total of 75.2 Mt CO2-eq, which would be equivalent to 14.5%–25% the emissions associated with the N fertilizer chain in China (295–517 Mt CO2-eq) in 2020 (Zhang et al 2013). Reducing N fertilizer rate in cereals would contribute to achieving China's goals of peak carbon emission by 2030 and carbon neutrality by 2060 (Liang et al 2021).
4.4. Study limitations
Our study is limited by a smaller data set in some categories (e.g. grain protein). Important variables affecting N fertilizer reduction potential include cropping system, soil pH, and N fertilization method (Mi et al 2022, Ren et al 2022). However, these variables were rarely reported and were not included in the present meta-analysis. The Nr losses were calculated based on regional Nr loss models, which maybe another source of bias. At national scale, we estimated the Nr loss and N-GHG emission based on a blanket reduction in N rates by 10% in wheat and by 30% in maize and rice, which might only be a rough assessment of emission reduction potential. The maximum allowable NRR that maintained yield and grain protein content at the level of current practice varied with region, N fertilizer type, tillage practice, soil texture, and soil nutrient status, which can inform targeted reductions. Therefore, to reduce emissions and ensure yield and protein are at least maintained, practices are needed that account for variation in soil, climate and cropping system.
5. Conclusions
We showed that farmers' conventional N rate can be reduced substantially with neutral effect on yield and grain protein in wheat, maize and rice, and associated improvement in environmental outcomes. This finding is necessary but not sufficient to elicit practice change. Implementation of reduced fertilization would require revised fertilizer price and government subsidies, legislating individual liability for environmental damage, addressing time and labor constraints, and continuous farmer education. Long-term monitoring is necessary to avoid shifting the system to a N-mining phase, especially for the region with lower soil fertility.
Acknowledgments
This study was financially supported by National Key R&D Program of China (2021YFD1900700), the Fundamental Research Funds for the Central Universities (2452020247), and Special funds for the operation and maintenance of scientific research facilities of Ministry of Agriculture and Rural Affairs of P.R. China (G2022-07-2).
Data availability statement
All data that support the findings of this study are included within the article (and any supplementary files).
CRediT authorship contribution statement
Changlu Hu, Shulan Zhang: Conceptualization. Changlu Hu, Wenting Du, Xiaoxiao Lei, Maolin Yang, Zhaodong, Wang, Panxin Zhang, Junmei Liu and Guoyan Lu: Data curation and Formal analysis. Changlu Hu, Victor O. Sadras and Longcai Zhao: Method. Changlu Hu, Victor O. Sadras and Shulan Zhang: Writing-original draft preparation, with input from all authors. All authors read and approved the final manuscript.
Conflict of interest
The authors declare that they have no known competing financial interests or personal relationships that could have appeared to influence the work reported in this paper.