

Abstract
Input–output analyses are increasingly used to estimate consumption-based environmental footprints. The potential of estimates of social, economic, and ecosystem consequences of lifestyle interventions can be improved by detailing the complex way that final demand arises from patterns of household activities, i.e. from how households choose to use their time. We perform a systematic literature review by searching three scientific databases and using backward citation snowballing to clarify how input–output models have been used to analyse household activity patterns. We discuss the prospects of the used methods for estimating environmental footprints associated with households' time uses in activities. We identified 48 relevant studies, each contributing with motivations and methods that are important for household activity-level environmental footprint accounting. When linked with the market economy and environmentally extended, input–output tables detailing the use of time and money across household types provide a clear picture of the connections between the economy, the social sphere, and the environment. Realistic expenditure and time-use data structures quantify the production and consumption activities that occur in households and the associated household inequalities in time use and expenditure patterns. Household activity-level environmental footprints differ notably across household activities. The reviewed studies provide the foundation for detailed and complete environmental footprint data at the household activity level to support policy decisions targeting everyday life. The current research on the topic is patchy with only one study modelling multiple countries and only one country being modelled across years. The research needs to be harmonised and scaled up to allow for comprehensive analyses. Ideally, future modelling should cover more countries with continuous data series and harmonised data collection and analysis methods.
Export citation and abstract BibTeX RIS

Original content from this work may be used under the terms of the Creative Commons Attribution 4.0 license. Any further distribution of this work must maintain attribution to the author(s) and the title of the work, journal citation and DOI.
1. Introduction
Prior to the sixth assessment report of the Intergovernmental Panel on Climate Change (IPCC), researchers across countries and disciplines called for an improved, many-sided, and comprehensive understanding of demand-side solutions to climate change mitigation targeting human consumption behaviour and lifestyles (Creutzig et al 2018). Aligned with this wish for more demand-side research, input–output analyses are increasingly used to estimate consumption-based environmental footprints (Malik et al 2019, Heinonen et al 2020) by linking environmental extensions of the input–output tables to the final user. Input–output tables are widely used within national economic and environmental accounting due to their advantageous double-entry accounting, enhancing consistency, balancing product flows, and ensuring a complete economy representation. The same advantages exist for social accounting matrices, an extension of the input–output tables, adding a more detailed characterisation of the role of labour and households (Miller and Blair 2009). 1
Traditional input–output tables (more precisely referred to as direct requirement tables) provide a comprehensive record of the flows of products between activities in the economy (Miller and Blair 2009, Weidema et al 2009), often representing households solely as a vector of final demand. However, the literature on household consumption-based footprints is burgeoning and recent studies detail the final demand by household or geographical segments, e.g. Baiocchi et al (2022), Lee et al (2021), Oswald et al (2020), and Ottelin et al (2019). While these studies show who drives the total consumption, they do not show how they consume. I.e. they do not detail the complex way that final demand arises from the requirements of specific household activities. The final demand and the associated environmental footprint can be detailed further by showing household material and time use in household activities. Because traditional input–output models are demand-driven, i.e. the exogenous demand from households drives production (Miller and Blair 2009), it is remarkable that there has been little focus on providing a detailed understanding of the interactions between different household activities and between household activities and market activities. This study systematically reviews input–output literature detailing household activities. We use the term household activity to denote unpaid undertakings by household members using an input of human time and expenditures on goods and services. Household input–output models (modelled together with the market economy or on their own) provide this complex understanding of the internal structure of household activities (Ironmonger 1995, Eurostat 2003).
In the recent Sixth Assessment Report of the IPCC Working Group III, households' time use is considered an important component of household behaviour and as affecting emissions (Dhakal et al 2022). An important input to household (and market) activities is humans' time, enabling and restricting human activities and footprints on the planet. Time use patterns, in the literature often overshadowed by expenditure patterns, provide a comprehensive picture of behavioural choices restricted by an endowment of 24 h per day. In addition to consumption activities 2 , households perform production activities producing goods and services for households' own final use and contributing to total production in the economy. After the formalisation of households' productive behaviour in the 1960s by Becker and Lancaster, interest in analysing household production activities using input–output modelling arose (Gershuny 1987a, Ironmonger and Sonius 1989). To an input–output practitioner interested in sustainability, household activities ought to be as interesting as market activities (Minx and Baiocchi 2009).
The objective of this paper is to investigate how input–output tables have been used to analyse the patterns of household activities from which final demand arises. We conducted a systematic literature review (see the search in appendix
- (1)What motivates researchers to analyse household activity patterns using input–output tables?
- (2)Which methods and assumptions are needed to use input–output tables to analyse household activity patterns?
- (3)Which data sources are used for the input–output analyses and what are the advantages and limitations of these?
Other approaches, including process-based life cycle assessment, exist to analyse the impacts of our activity patterns. We review studies using input–output tables to focus on studies with a broad household activity coverage, structuring data for as much of the daily 24 h as possible. The aim of complete coverage of input–output tables makes them suitable for answering a broad range of questions and for the addition of new extensions. An input–output table is a complex way of utilising time-use measures to show household activities in detail and can be linked to the labour market supply in national accounts (Eurostat 2003). Environmental intensities (footprint per monetary or time unit) from input–output models are for the entire lifecycle (indirect intensities) compared to simple, process (direct) intensities.
Within the area of consumption-based footprint accounting, recent studies have reviewed the household-level mitigation potentials of transport, food, and housing consumption (Ivanova et al 2020), the potential role of work-time reductions in reducing environmental footprints (Antal et al 2020), the spatial aspects of footprint accounting (Heinonen et al 2020), expenditure and income elasticities of carbon emissions (Pottier 2022), and the evolution of multi-regional input–output tables (Malik et al 2019). The reviews were either limited to or primarily focused on input–output analyses. In addition to reviewing the interrelation between socio-economic factors and urban form and its impact on the climate footprint, Wiedenhofer et al (2018) reviewed studies on the impact of household time use patterns on the climate footprint. At the time of the review, they only found one study to be fully relevant. A need for compiling what has been done and identifying prospects of consumption-based environmental footprint accounting still exists when it comes to the input–output literature analysing households at a detailed activity level. The interest of this review is not limited to input–output models with environmental extensions since studies with other objectives can also guide future research on environmental footprints and add aspects that contribute to a complete picture of the environmental and economic dynamics.
Section 2 presents the review methods, section 3 includes the results, and section 4 discusses and suggests areas for further research. Finally, section 5 concludes.
2. Methods
To answer the research questions, a systematic literature review was conducted based on Boolean database searches and backward snowballing. Searches were in the English language and conducted in Scopus, Web of Science, and Proquest on 8 September 2022, using the Aalborg University subscriptions. The search string (appendix
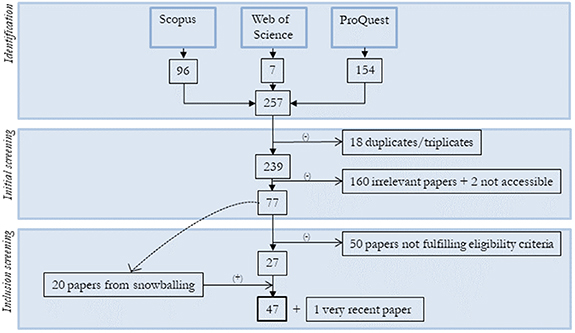
Figure 1. Diagram of steps to identify, screen, and include documents in the literature review.
Download figure:
Standard image High-resolution imageTable 1. Eligibility criteria applied to the 77 papers that passed the initial screening and papers identified from backward snowballing.
| Inclusion criteria | Exclusion criteria | |
|---|---|---|
| Setting | No geographical or temporal restrictions. Studies are not required to focus specifically on environmental impacts. | Not applied |
| Content | Analyses of household production and consumption activities using input–output models (or social accounting matrices). Thus, studies that specified at least one household activity (a non-market activity) in their analysis were eligible. Studies were allowed to build upon results from existing input–output analyses and were not limited to those that construct new input–output tables with household activity accounts. No restriction on the unit of measurement (time, monetary, physical) in the activity accounts.Theoretical or empirically founded suggestions on how to implement household activity accounts in input–output tables or activity accounts in time units. | Input–output analyses of household consumption that do not model different household activities. Thus, studies that detailed household expenditures or types, but not household activity patterns were excluded. Several studies analysed the purchase of leisure services using input–output models but not how the services were part of an activity. These studies were excluded.Several studies passing the initial screening based their analysis on differing work hours or employment status between people. These models were excluded because they model more types of households (distinguished by time used at work) rather than more types of activities. Analyses of other parts of the non-observed economy not referring specifically to household production. |
| Study types and quality | No restrictions on the material type or language but using English language words or phrases for the search.As this review focuses on motivations and applied methods rather than results, we do not place quality requirements on the studies. Instead, we discuss the advantages and disadvantages of the applied methods. | Theoretical and review papers that do not add new theoretical contributions to how input–output models can be used to analyse household activity patterns. |
Based on a through reading and evaluation against the inclusion and exclusion criteria (table 1) of the 77 papers, 27 passed the inclusion screening and were included in the final review (figure 1). For each of the 77 papers that passed the initial screening, backward snowballing was conducted, leading to the inclusion of 20 additional papers also fulfilling the inclusion criteria (figure 1). Several of the papers identified from backward snowballing were published in non-peer-reviewed outlets in the 1990s and did not appear in the searched databases. A relevant study was published towards the end of the study, and it was included in the review though not identified through the systematic process (figure 1). Appendix
3. Review results
The studies included in the review can be categorised by four main factors (figure 2). The newest (factor 1) studies are often motivated by environmental concern (factor 2). Most of the studies motivated by environmental concern cover many household activities or the entire day (factor 3), and, except for one, they rely on input–output tables that did not originally detail household activities (factor 4). A second group of studies from year 2000 and onwards estimate economy-wide effect of the engagement in a selected household activity or very aggregate household activities. Most of these created social accounting matrices for the purpose of the analysis. The oldest studies form a last group, usually concerned with household production activities and their contribution to household welfare and total production or inequalities in household activity patterns. The studies present original input–output tables.

Figure 2. Historical overview and classification of included studies. Each study is represented by the first characters of the first author's name and the publication year. The symbol shape indicates the activity coverage and the colour the motivation. Studies using input–output tables created for the specific analysis are to the left of the timeline, reviews and theoretical contributions on the line, the rest to the right.
Download figure:
Standard image High-resolution image
The burgeoning interest in estimating consumption-based environmental footprints at the household activity level, also now for Asia (Yu et al 2019, Jiang et al 2022) makes it plausible that future modelling of environmentally extended input–output tables will detail household activities. Scrutinising the old household input–output literature that aims at providing complete and detailed structures of households' use of time and products is an obvious starting point. Input–output's complete nature makes each table useful for multifaceted analyses. The idea of creating input–output tables detailing market and household activities and keeping accounts of time use and emissions is not new; C. Stahmer presented it in 2000 (not accessible) and presented the idea in Stahmer (2010) with further analysis in Minx and Baiocchi (2009). The input–output tables are complete in their human activity coverage and are necessary to analyse social, economic, and environmental aspects of sustainability in conjunction (Stahmer 2010). As part of the revision of the UN's System of National Accounts (SNA), a broader framework capturing economic activities, well-being, and sustainability is created (Hoekstra 2020). This requires the synthetisation of existing data and an integrated use of accounts of physical and monetary flows, time-use, and spatial ecosystem accounts among others (Hoekstra 2020).
3.1. Motivation for using input–output to model household activity patterns
This section goes through motivations for using input–output models to analyse household production (a) and household activities in general (b), and for measuring human activities in time units (c).
3.1.1. Motivation for modelling household production activities: estimating contributions to total economic welfare and the links to the market economy
Household production is most often distinguished from other household activities based on the third-person criterion. This implies that production activities are those another person can be hired to do (Reid 1934)* 3 as opposed to consumption activities, covering leisure and self-care and maintenance activities. Household production of goods and services for own use is further distinguished from production for a market. Household production is part of the non-observed economy. None of the reviewed input–output models covering only household production was environmentally extended, but they provide structures of economic flows of products which enable such extensions.
Household production is essential to economic welfare (Ironmonger and Sonius 1989, Aslaksen et al 1995, 1996). Input–output tables of household activities make the role of households as a major contributor to economic outputs visible, along with the interactions between households, the market, and the public sector (Ironmonger 1995). In the US, only 12% of the conventional estimates of final consumption expenditures were directly consumed while the remainder went through a household production activity (Landefeld and McCulla 2000). In the late 1980s and 1990s, input–output analyses focusing specifically on household production were performed for Australia, Finland, Norway, and the US (Aslaksen et al 1995, 1996, Ironmonger 1997, Ironmonger and Sonius 1989, Landefeld and McCulla 2000, Vihavainen 1995). For Germany and the Netherlands, the modelling was done along with that of the market economy (Kazemier and Exel 1992, Stahmer and Ewerhart 1999). 4 While Ironmonger (1997) and Vihavainen (1995) compared the household production value to the national gross domestic product (GDP), other researchers argued that methodical issues were too extensive to estimate comparable values (Kazemier and Exel 1992, Stahmer and Ewerhart 1999).
Time intensities and commodity intensities 5 provide clear pictures of the everyday life of household members that are comparable across household types and production activities (Aslaksen et al 1996). In Finland and Australia, labour inputs were responsible for respectively 76% and 70% of the estimated value of household production (Ironmonger and Sonius 1989, Vihavainen 1995).
Input–output tables detailing household production activities are relevant to investigate inequalities across and within households (Schaffer 2007b, Hoekstra 2020). Schaffer (2007a) developed a model distinguishing the producer and consumer associated with a household activity, viewing households as consisting of interacting individuals. This showed that seniors receive the highest monetary value of household production. Women's share of production in the German economy, and thereby their relative contribution to the satisfaction of consumers' needs, increased notably when household production was accounted for (Schaffer 2007b).
When households are detailed in the input–output table along the market economy, as opposed to in a separate household satellite account as suggested in the UN's 1993 SNA, the model can operate as an analytical tool allowing interactions between the market and the household (Carrasco and Serrano 2011). Among the studies interested in the interaction between a specific type of household production and the national economy, Choi and Johnson (2014) estimated the value of non-observed childcare (including household and communal production) in Kansas and, by estimating economic multiplier effects, the total effect of the non-observed childcare on the economy. Multipliers are used to assess the effect of an exogenous change on the economy, such as the effect of a change in employment in a specific activity on employment in the entire economy (Miller and Blair 2009)*. Mainar‐Causapé et al (2020) included household production in a social accounting matrix for Kenya to account for the full economic effect of households as agricultural producers. Mosa et al (2020) modelled water fetching and firewood collection in a social accounting matrix for Ethiopia to study the economy-wide effects of freeing labour from these household production activities.
3.1.2. Motivation for modelling household activities in general: providing a comprehensive view of everyday life, inequality, and environmental footprints
Modelling production and consumption activities alongside each other provide a comprehensive view of everyday life. How our time is distributed across different activities can be a source of inequality; two households with equal income but different amounts of consumption time will experience different living standards (Ironmonger and Richardson 1991, Fontana 2004). Understanding interactions between behaviour inside and outside the household is crucial to predicting the full effects of structural changes in the market economy and labour market policies (Gershuny 1987b, Fontana 2004). Two broad categories of household activities, production and consumption, were included in social accounting matrices of Bangladesh, Zambia, and Pakistan to investigate the effect of economic reforms and foreign trade on women's wages and jobs (Fontana and Wood 2000, Fontana 2001, 2002, Siddiqui 2005).
A few studies focused exclusively on consumption activities. Consumption activities do not provide an output of goods or services but provide fulfilment of needs. Motivated by gender equality issues, Ironmonger and Richardson (1991) investigated consumption time and commodity intensities by gender. Aall (2011) estimated environmental footprints of leisure activities defined as the activities with the largest experienced freedom. None of the studies modelled the by-product of capital formation that might arise from consumption activities and is used as an input to production activities, e.g. shown as increased school grades from playing music (Hille and Schupp 2015)* or math performance from being physically active (Singh et al 2019)*.
Many studies investigating household activity patterns compared the environmental footprint across activities and used environmentally extended input–output tables. Household production required more inputs both per unit of time and money than consumption activities (Minx and Baiocchi 2009). While women overall had a slightly higher carbon footprint than men, driven by more time spent in household production activities, men had higher carbon footprints for their consumption activities specifically when not controlling for other individual or household characteristics (Druckman et al 2012). As discussed in several studies on household production activities, household production is not final consumption, and ideally it can be identified to what extent the production activities provide an input to male and female consumption activities. By using carbon footprint obtained from Druckman et al (2012), Isham et al (2019) showed that activities with high environmental impacts were associated with lower levels of the feeling of flow (a feeling of concentration, enjoyment, intrinsic motivation, and challenge/skill matching). Creating the link between feelings and environmental footprints is important to identify options for reducing footprints or increasing well-being without compromising the other factor. Studies have furthermore compared resource use and emissions per activity across countries (showing the lowest carbon intensities in China) (Yu et al 2019), across different areas of a country (Heinonen et al 2013a, 2013b), weekdays (showing the highest carbon footprints of weekends) (Jiang et al 2022), years (showing increasing energy footprints over time) (Jalas 2005, Aall 2011, Jalas and Juntunen 2015), and household sizes (Jalas 2005).
A complete picture of how humans spend their time can guide the discussion about whether work time reductions can provide a strategy to reduce footprints (Nässén and Larsson 2015). The result depends on the extent to which reduced work time, giving more consumption time and the option to substitute to alternative products, offsets the primary effect of a reduced income as well as the macro-economic feedback effects (Nässén and Larsson 2015, Antal et al 2020). The estimated effects of reduced worktime come with high uncertainty from the attempt to match separately collected time use and expenditure data (Antal et al 2020). Like reduced work hours, information and communication technology liberate time for other activities (Bieser and Hilty 2020).
3.1.3. Motivation for modelling in time units: a complete coverage of human activities & avoiding wage discrimination
In the same way as accounting labour input in time units is relevant for industrial statistics, detailed accounting of the rest of our daily 24 h is relevant to provide a complete picture of all human activities (Stahmer 2010). A comprehensive picture of household welfare can be created by combining patterns of time use, income, and consumption (Aslaksen et al 1995, 1996). While one study showed how time flows from one age group to other age groups (from production to consumption activities) (Schaffer 2007a), none of the identified studies distinguish gender in such an analysis, though this is relevant from a gender inequality perspective.
In addition to the budget constraint, the time constraint is important when estimating consumption rebound effects (Jalas 2002, Takase et al 2005). As opposed to economic wealth, we all have the same daily time endowment, thus accounting in time units provides a better representation of people with small incomes and expenditures (Jalas and Juntunen 2015). Measuring in time units is often perceived as an alternative to measuring in monetary units and removes the bias that arises when wages from typically female-dominated jobs are assigned to household activities (Ironmonger and Sonius 1989, Carrasco and Serrano 2011). Tracing back where human labour inputs to a specific product come from is more transparent in a model in time units compared to a model in monetary units where wage differences blur the results. Measured in time units, the household production was respectively 1.5 and 1.4 times larger than market production in the Netherlands and Australia (Kazemier and Exel 1992, Ironmonger 1995).
To include as many perspectives as possible of our daily lives, some studies constructed more versions of the same household input–output table; one in physical units, one where household labour had zero economic value, and one where all labour inputs were measured in time units (Kazemier and Exel 1992, Stahmer and Ewerhart 1999, Stahmer 2010). Together, the three versions provided an almost complete representation of economic activities, but for many analyses, it was relevant to merge two or more of the tables in a hybrid unit table (Stahmer 2010).
3.2. Applied methods to model household activities
The section discusses the classification of household activities (a), the valuation of activity outputs and intermediate inputs (b), and how inputs are allocated to activities (c).
3.2.1. Activity classification
There are almost as many ways to distinguish activities as there are papers on the topic. Classifying activities is partly a question of terminology but designing relevant activity categories is essential for ensuring that the activities fulfil a uniform need of the consumers such that interventions have a uniform effect on an activity. Usually, it is relevant to distinguish between production and consumption activities. Often, the term leisure has been used to cover all consumption activities. The term 'committed time' is also used to refer to household production and is opposed to 'personal time' (including sleeping, and eating), 'contracted time' (employment and education), 'free time', and 'mobility time' (Minx and Baiocchi 2009, Wiedenhofer et al 2018, Smetschka et al 2019). Travel to paid work and self-education do not comply with the third-party criterion but do not seem to be consumption activities either (Ironmonger 1996). While Gershuny (1987b) defined education as consumption, Stahmer (2010) treated education as fixed capital formation, implying that more hours of education increase educational capital. Schaffer (2007a) argued that education is consumed by the producer but indirectly influences society, making it relevant to distinguish education from consumption activities that only benefit the participating individuals. In practice, by-products of consumption activities might also benefit society.
One study ranked activities on a scale of experienced freedom (Aall 2011). Household production activities were associated with the lowest level of freedom, followed by work, school, and leisure (Aall 2011). Bound and unbound activities were defined for each of the different levels of experienced freedom. The classification contradicts the third-party criterion, e.g. by considering gardening and accompanying children to sports activities as leisure. The terminology 'contracted time', 'committed time', and 'free time' used in Minx and Baiocchi (2009), Smetschka et al (2019), and Wiedenhofer et al (2018) also has some notion of freedom underpinning it. Except for classifying pet care as 'free time', the resulting classifications were consistent with the third-party criterion.
The communal production system, which includes activities in voluntary organisations, babysitting circles etc, has in a few studies been distinguished from household production activities (Gershuny 1979, Kazemier and Exel 1992, Ironmonger 2001). In these activities, money exchange is not used as an indicator of the value exchange (Gershuny 1979*, Kazemier and Exel 1992). Several of the reviewed papers perceive communal production activities as being part of household production. Further, activities can be characterised by their location (Heinonen et al 2013a, 2013b). Household production for consumption and investment can be distinguished following the GDP conventions, implying that the production of housing should be considered an investment (National Research Council 2005)*.
Based on available activity descriptions, most studies cover some activities in more detail than others or exclude some activities. For example, Stahmer (2010) and Stahmer and Ewerhart (1999) included mass media as a separate activity but no other culture or leisure activities (such as reading) and Aslaksen et al (1995, 1996) included knitting as a very narrow activity (see table 2, an excerpt of appendix C). Appendix C shows a detailed overview of the activities modelled in the reviewed papers based on the International Classification of Activities for Time Use Statistics (ICATUS) 2016. The activities in 'Unpaid domestic services for household and family members' were detailed in both Aslaksen et al (1995, 1996) and Druckman et al (2012), while caregiving activities were not detailed in any of the three studies in table 2. Many studies (e.g. Druckman et al 2012 in table 2; but see also appendix C in the supplementary material) included activities that went across major ICATUS divisions, illustrating how different perceptions are on how to design meaningful activity categories. Choi and Johnson (2014) grouped childcare produced by different agents together, including paid childcare (ICATUS major division 1), household-produced (ICATUS major division 4), and voluntary childcare (ICATUS major division 5). Stahmer (2010) and Stahmer and Ewerhart (1999) distinguished ten studying activities and Mainar‐Causapé et al (2020) distinguished 18 agricultural activities. In contrast to the Kenyan study, most reviewed studies did not include activities corresponding to the ICATUS major division '2 Production of goods for own final use' (appendix C), reflecting that most studies were from countries where subsistence production is rare.
Table 2. Three examples of reviewed classifications of activities mapped on the ICATUS classification.
| (Aslaksen et al 1995, 1996) | (Druckman et al 2012) | (Stahmer and Ewerhart 1999, Stahmer 2010) | |
|---|---|---|---|
| Country: ICATUS activities | Norway | UK | Germany |
| 1 Employment and related activities | X | ||
| 18 Travelling and commuting for employment | X | X | |
| 2 Production of goods for own final use | A | ||
| 211 Growing of crops and kitchen gardening for own final use | B | ||
|
222a Knitting
| X | ||
| 25 Travelling, moving, transporting or accompanying goods or persons related to own-use production of goods | A | ||
| 3 Unpaid domestic services for household and family members | X | A | |
| 31 Food and meals management and preparation | X | ||
| 32 Cleaning and maintaining of own dwelling and surroundings | X | ||
| 324 Upkeep of indoor/outdoor plants, hedges, garden, grounds, landscape, and so on | B | ||
| 33 Do-it-yourself decoration, maintenance and repair | X | B | |
| 34 Care and maintenance of textiles and footwear | A | ||
| 36 Pet care | X | ||
| 37 Shopping for own household and family members | X | X | |
| 380 Travelling, moving, transporting or accompanying goods or persons related to unpaid domestic services for household and family members | A | ||
| 4 Unpaid caregiving services for household and family members | X | X | A |
| 44 Travelling and accompanying goods or persons related to unpaid caregiving services | A | ||
| 5 Unpaid volunteer, trainee, and other unpaid work | |||
| 6 Learning | X | X | |
| 7 Socializing and communication, community participation and religious practice | X | ||
| 71 Socializing and communication | X | ||
| 72 Participating in community cultural/social events | C | ||
| 8 Culture, leisure, mass media and sports practices | X | ||
| 82 Cultural participation, hobbies, games and other pastime activities | X | ||
| 83 Sports participation and exercise, and related activities | X | ||
| 81 Attending/visiting cultural, entertainment and sports events/venues | C | ||
| 84 Mass media use | X | X | |
| 841 Reading for leisure | X | ||
| 9 Self-care and maintenance | X | ||
| 91 Sleep and related activities | X | ||
| 92 Eating and drinking | X | ||
| 93 Personal hygiene and care | A | ||
| 94 Receiving personal and health/medical care from others | A |
X indicates that the study includes the ICATUS activity; other letters indicate that the ICATUS activity is grouped with activities marked with the same letter. All nine major divisions of the ICATUS are listed but only used divisions and groups. a Not specified in the ICATUS.
Ironmonger (1997) argued that instrumental activities (e.g. cleaning and transportation) that support household production activities should be distinguished from the actual production activities. Investigating the consequences of technological improvements reducing time spent on firewood collection is relevant even though it is an instrumental activity to meal preparation and accommodation of many rural households in Ethiopia (Mosa et al 2020). Several studies chose to create separate travelling categories per activity, reflecting their instrumental character (Druckman et al 2012, Jalas and Juntunen 2015, Yu et al 2019). Carbon footprints changed notably when transportation was allocated to the associated activities (Druckman et al 2012, Smetschka et al 2019).
3.2.2. Valuing activity outputs and intermediate inputs
Two broad approaches exist to value outputs of household production: the output-based and the input-based. These value the household production respectively by the price of an equivalent market product and by costs of the inputs, including imputed wages. In contrast with the general preference for the output-based approach, the input-based is the most common (Ironmonger 1996, Goldschmidt‐Clermont and Pagnossin‐Aligisakis 1999). The output-based approach reflects that the product satisfies the same need as an equivalent market product, it avoids making the value dependent on the effectiveness of the producer, and it ensures that the double-entry bookkeeping that is fundamental for accounting is maintained (Goldschmidt‐Clermont and Pagnossin‐Aligisakis 1999, National Research Council 2005)*.
All reviewed studies that value activity outputs economically use the input-based method and use either an opportunity cost approach or one of two market replacement approaches to value time. The opportunity cost approach values time by the income that a person could alternatively obtain on the market (Ironmonger and Sonius 1989, Fontana and Wood 2000, Agbahey et al 2020, Mosa et al 2020). An economy-wide opportunity cost of labour shows how much the market output level would rise if one full-time equivalent unit of non-paid time were instead dedicated to market work at the margin (Pratt 2007, 2009). This method does not value household labour in a way comparable to market pricing but is a market indicator on its own, thus less relevant in this context. With the opportunity cost methods, the value of household production depends on the individual's market occupation, transferring income inequalities to the household and contradicting the usual assumption that the value of production depends on the productivity of the performer of the household activity (Bittman and Ironmonger 2011). The generalist market replacement approach assigns the value of a generalist (a housekeeper) to time spent in unpaid household production (Vihavainen 1995, Aslaksen et al 1996, Stahmer and Ewerhart 1999, Schaffer 2007a, 2007b). Alternatively, a task-specific specialist cost can be used (Choi and Johnson 2014). Both replacement costs make accounting for multitasking and differing qualities of work difficult. The latter point could lead to an overestimation of the value of household labour (Landefeld and McCulla 2000, Choi and Johnson 2014) while the fact that replacement costs are typically based on female-dominated jobs could lead to an underestimation (Schaffer 2007a, Carrasco and Serrano 2011).
In most studies, neither the input of time units nor the output of consumption activities is valued in monetary units. E.g. Ironmonger and Richardson (1991) accounted time inputs to consumption activities in time units and other inputs to the consumption activities in monetary units. However, the studies on Zambia, Bangladesh, and Pakistan used a gender-specific opportunity cost of consumption time (Fontana and Wood 2000, Fontana 2001, 2002, 2004).
Other inputs to household production were valued by their national market price. Consumer durables can be considered investments, implying that they depreciate over time, reflecting service flows to household production (National Research Council 2005, Schaffer 2007b). Landefeld and McCulla (2000) suggested that services from durable goods are valued by their actual rental prices, including both the depreciation and the return the asset owner would otherwise earn from investing the money elsewhere.
3.2.3. Allocating market and household-produced inputs to household activities
Inputs to household activities are distributed across activities based on their expected use. The allocation of inputs to activities has been based on purely a priori reasoning (Gershuny 1987b) and with the exclusion of expenditures that were difficult to allocate (Yu et al 2019). Jiang et al (2022) found only limited sensitivity of the carbon footprint to three different ways of matching expenditures and time use. Kazemier and Exel (1992) considered all durable goods as inputs to household production. Several studies used the time-use method which allocates expenditures to activities proportionately to the time spent in each activity where the good is an input (e.g. Ironmonger and Sonius 1989, Aslaksen et al 1995, Yu et al 2019). The method suffers from allocating disproportionate value to activities that take much time. Jiang et al (2022) used specific surveys on the use of electricity and water to allocate utilities. Druckman et al (2012) allocated most expenditures to activities partly using the time-use method and e.g. assumed a certain heating level during the night. Smetschka et al (2019) allocated all expenditures to activities and, in line with Aslaksen et al (1995), distributed some expenditures equally over activities, giving disproportionate weight to activities of short duration. Landefeld and McCulla (2000) also used the time-use method to allocate flows of services from the government to the households. In Finland, items that were impossible to allocate to a particular activity, like clothing, furniture, and housing, were allocated to a consumption category called 'household infrastructure' that did not require a time use (Jalas 2005).
Jiang et al (2022) noted that some household expenditures, such as clothes, are consumed in the worktime, but not included in the workplace's expenditure statistics. Therefore, the relevant expenditures should also be distributed partly to paid work time (Jiang et al 2022). While household activities use intermediate inputs produced in the households (Landefeld and McCulla 2000, Stahmer 2010), most studies did not include this activity structure.
3.3. Data sources
The studies on household production activities combine national time-use surveys (usually diary-based) with national household budget survey data to create original input–output tables. Many of the models that also cover consumption activities use the same sources for consumption and time use data but take outset in environmental footprints from existing national input–output tables. To obtain environmental footprints of household expenditure categories, Smetschka et al (2019) used the Eora multi-region input–output table and Yu et al (2019) used the World Input–Output Database for other countries than China. The German study developed an original model (Stahmer and Ewerhart 1999). Mosa et al (2020), Fontana (2002), Fontana (2001), and Agbahey et al (2020) took outset in their previous work creating social accounting matrices for Bangladesh, Ethiopia, Pakistan, and Zambia. Finding suitable time-use data was challenging for some of the developing countries and they relied, among other data sources, on labour force and agricultural practice surveys (Fontana 2001, 2002, Siddiqui 2005, Mainar‐Causapé et al 2020).
Studies usually aggregated the activities in time-use surveys into broader categories, but the Japanese study maintained the time-use survey's original 85 categories (Jiang et al 2022). Studies differ in what share of the day they cover; the Finnish studies covered 18.7, 19.3, and 23.0 h for the three different years (Jalas 2005, Jalas and Juntunen 2015), while the Austrian and Japanese studies covered all 24 h (Smetschka et al 2019, Jiang et al 2022).
A few data challenges became evident from the review. The quality of data currently suffers from household consumption and time use data being collected separately, creating problems with input allocation. Data is mainly collected by national statistical agencies. When separately collected, making these time use, household expenditure, and input–output data compatible requires efforts by agencies to characterize households by a multitude of consistent factors. Further, the separately collected data makes causality difficult to establish, because time-use surveys include some income effect (people with more free time most likely work and earn less), and expenditure surveys include a time-use effect (higher expenditures are often a result of long work time) (Antal et al 2020). Collecting longitudinal time use and expenditure data from the same households is a solution (Antal et al 2020). Ironmonger (1997) suggested the implementation of household output surveys, asking respondents for the volume of household production. This has, to our knowledge, not been done. Finally, time use is usually surveyed during a single period of the year, creating problems when accounts are compared to market accounts that usually cover an entire year (Hoekstra 2020).
4. Discussion
In ordinary input–output tables, 'the products purchased disappear into a "black hole", because their further uses in household activities are not described' (Stahmer 2010, p 632). However, the input–output approach can be used to detail households' use of the products and the associated environmental, social, and economic implications as it provides 'a framework through which we can investigate the interactions between a whole range of activities and expenditure on commodities' (Ironmonger and Richardson 1991, p 19). Only 19 of the reviewed studies were partly or only motivated by environmental concerns, but they all provided a structure that is fundamental to household activity-level environmental footprint accounting and a comprehensive reflection of the structures of our daily life that enable and restrict our activity patterns. Through the matching of time use, expenditure, and input–output data, the reviewed papers present input–output models that reform the traditional input–output literature in that they:
- (1)Disaggregate the household final demand vector in the input–output tables into more detailed activities that describe how products are consumed.
- (2)Distinguish household consumption activities from household production activities and extend the production boundary to include all household production activities, deepening the understanding of how products are produced.
- (3)Introduce measurement in time units so that human inputs to activities are accounted for in their natural unit.
Behind the tables lies a huge effort in matching the different data sources. Results depend on allocative assumptions, which brings inevitable uncertainty to the results with the current data collection efforts.
Available time governs the everyday decision-making of individuals regarding consumption, in parallel to what available money does (Smetschka et al 2019). Therefore, for a policy-oriented analysis, adding time use to input–output tables is needed (Stahmer 2010). Strategies to reduce time spent in firewood collection or water fetching would release time to both consumption and market production activities (Mosa et al 2020). While limiting firewood use alone reduces the environmental footprint, the released time might have a counteracting effect, pointing to the importance of an integration of time use data.
4.1. Policy relevance of household activity-level environmental footprints
The reviewed models underline that our behavioural choices affect our total resource use and carbon emission. From a policy perspective, the most important contribution of the reviewed studies is the provision of detailed and complete environmental footprint data at the household activity level to support decisions targeting everyday life. Policies targeting household environmental footprints can either target the structure of activity patterns (reducing the time spent in carbon-intensive activities) or the consumption during the activities (Yu et al 2019). Demand-side solutions to climate change intersect with everyday life and culture and identifying policy instruments that can reduce demand-side footprints is an ongoing effort (Creutzig et al 2018). Policymakers and individuals might be more tractable when the carbon reduction policies go hand in hand with other policy objectives. Studying and sports activities have low carbon emissions and increasing time spent in these activities might be well aligned with lifelong learning (Jiang et al 2022) or health policies. Results from the reviewed studies nuance the debate on whether labour policies promoting work time reductions can reduce environmental footprints while enhancing well-being by showing that the footprint depends on household characteristics and which non-paid activities people shift to (Druckman et al 2012). Modelling the inequalities in the distribution of time and products between household types is necessary to estimate the relevance of and the responses to policies targeting our activity patterns. Furthermore, people's consumption and activity choices are strongly tied to the surrounding urbanisation and car ownership (Heinonen et al 2013b).
Environmental footprints of household production activities can guide policymakers as to whether to encourage or discourage these activities compared to market production from an environmental perspective, e.g. through the campaigns for catering centres or tax deductions for hiring of a workman or cleaner. Associating travel footprints with each activity can provide an informed basis for governments or local government on how to improve infrastructure to reduce emissions: is local or long-distance public transport most important to improve?
Estimating the social and environmental effects of interventions targeted towards specific activities and consumption patterns requires knowledge on activity substitution and rebound effects (Jalas 2002, Takase et al 2005). Jalas (2002) argued that activities fulfilling basic needs only to a limited extent are substitutable with other activities. Thus, using the input–output results to guide decision-making requires insights from other social science disciplines.
4.2. Methodical and conceptual issues
Economically valuing outputs of productive activities is relevant to quantify environmental intensities. Environmental intensities can also be expressed per input quantity, e.g. the carbon footprint per unit of time spent in an activity. Maintaining inputs of time in its original unit, both to production and consumption activities, is the clearest way to show what people do, avoiding any value assumptions. Measuring outputs of household production in monetary values equivalent to market products puts household production in line with formal production activities, underlining the economic contribution by households. Consumption activities (which do not have a market-like value) can be valued economically if the value reflects the activity benefit, the experienced well-being (and not a market-like value). None of the reviewed studies included activity benefits in the monetary valuation of household activities.
While most reviewed studies did not allocate public goods provided by the government as inputs to specific household activities, and Gershuny (1987b) even argued that this would be impossible to do, services provided by the government are produced for and consumed by households and contribute to their environmental footprints. E.g. health care is partly supplied by the government but consumed by the households. While there is a household time use associated with receiving health care, this is not true for all government services. If not possible to identify as inputs to specific activities, services provided by the government could be moved to a time-independent activity like the 'household infrastructure' category suggested by Jalas (2005). It seems most natural to allow some products to be consumed independently of time (e.g. an insurance or the national Defence). Also, distributing the service flow from the dwelling across activities will not make the lifestyle clearer. To be in line with the output-based method that we advocate, service flows from durable goods should be valued by their rental prices.
The third-party criterion is applied in most studies to distinguish production and consumption activities. More relevant distinctions have not emerged from the review. To avoid the confusion arising from leisure sounding enjoyable and thereby the misunderstanding that well-being is an indicator of whether an activity is consumption or production, we used the terminology 'consumption activities' vs 'production activities'. As an addition to this, experienced freedom in an activity, as suggested by Aall (2011), is a relevant parameter for designing policy recommendations that people will act upon. Most people obtain an activity benefit both from consumption and production (Ironmonger 1996, Jalas 2002), and production activities are valuable both because of the product provided and the experienced well-being.
Input–output tables have not yet been comprehensively used to establish the relationship between well-being and consumption (Minx and Baiocchi 2009). Non-market activities play a major role in well-being which could be incorporated into the input–output tables (Minx and Baiocchi 2009). Isham et al (2019) met this wish and linked the feeling of flow with carbon footprints from the UK. This can guide environmental policies in considering experienced well-being. It should be mentioned that the feeling of well-being is likely not linearly related to the time spent on an activity.
The distinction between instrumental and non-instrumental activities is relevant for linking activities and inputs in a way that best reflects reality, thus giving more accurate environmental footprints. Most studies did not model the instrumental nature of household production activities as providers of products to household activities. While cooking is usually considered instrumental to eating (Jalas 2002), the well-being from cooking might, in some instances, exceed that of eating. Which activity is then instrumental? Method-wise, this could be modelled as a case of co-production where either the produced food or the well-being is a by-product of the other, but data on people's motivation is necessary to identify the determining activity. Cooking for fun and because your family is hungry might even be two distinct activities. Another relevant issue is whether shopping is instrumental to other activities or encourages additional purchases, implying that there are final resource uses associated specifically with shopping (Ropke and Godskesen 2007). The answer to this question might exist in the literature on the interplay between consumer characteristics, shopping planning, and in-store decision-making, e.g. Inman et al (2009) and Davydenko and Peetz (2020). Capital formation is the main output of most formal educational activities, while experienced well-being might be the main output of some informal educational activities. The capital formation arising from education is an input to production. In that sense, formal education is market work with a postponed payment.
4.3. Suggestions for future research
We suggest integrating household activity accounts and time use measurements into traditional input–output tables. We propose an embedded approach rather than modelling a separate satellite account as suggested by Eurostat (2003), which would not allow for feedback effects. While this enables the estimation of household activity-level environmental footprints that can provide an informed basis for the pressing request for policies targeting consumer behaviour (Creutzig et al 2018), we, as additional steps, suggest that the model should be:
- (1)A comprehensive socioeconomic model, detailing the role of paid labour and the remainder of household time use. Social accounting matrices, based on the SNA, allow for comprehensive environmental, economic, and social policy analysis.
- (2)Multiregional, following the general trend for consumption-based footprint accounting (Malik et al 2019). Since consumption in one country affects export from production in another, it also affects the time allocation of foreign employees (Gershuny 1987b, Fontana 2004). This requires harmonised classifications of activities and allocation methods and enables comparison of the effect of environmental policies or technologies between the same household activities across countries.
- (3)Continuously updated.
Ideally, statistical agencies would collect household expenditure and activity data in the same population sample and the survey would include questions on motivation to improve the quality of activity classification. As a minimum, compatibility of expenditure and time use surveys should be ensured.
5. Conclusion
This paper systematically reviewed studies analysing household activity patterns using input–output models. Some models were used to estimate household activity-level environmental footprints while others provided an underlying data structure useful for this. Beyond providing activity-level environmental footprints, the models investigate complexities of everyday life, welfare, the links between the market economy and household production, and lifestyle inequalities across individuals and households. These dimensions are important in their own right and provide the context affecting and being affected by environmental footprint reduction interventions. The complete coverage aim of input–output tables makes them ideal for a multifaceted analysis of market and household activities, which is possible when integrating time use and expenditure data. While data is usually obtained from similar national data sources, methods for structuring the data differ across studies. The number of ways of grouping activities and allocating inputs to household activities is almost as high as the number of studies. Thus, the methods also vary within studies with the same motivation. Harmonisation will make results comparable across time and countries. Allocating inputs to activities in a way that best reflects reality and subsequently targeting policies towards the activities that drive household behaviour requires that data structures reflect how some activities are instrumental to others.
Household input–output tables depict the detailed and complex way that final consumption arises from the patterns of household activities. The number of studies using input–output models to analyse household activities is limited but, at present, the discipline is gaining ground when it comes to estimating household activity-level environmental footprints. With improved and intensified data collection across countries that ensures compatibility of household expenditure and time use data, comprehensive environmental, social, and economic analyses, using a continuously updated harmonised multi-regional model, will be possible. In a time where climate change and biodiversity loss are high on the political agenda, detailing activities of everyday life will enhance the policy relevance of environmentally extended input–output models by going beyond who to target to what part of their everyday life to target. Distinguishing different household types makes the models useful for assessing social inequalities in everyday life and the environmental footprints associated with the inequalities.
Acknowledgments
This work was supported by the KR Foundation. We would like to thank the two anonymous reviewers for their constructive comments.
Data availability statement
No new data were created or analysed in this study.
Appendix A: Database search
Search in Scopus:
(ALL ('input–output' OR 'social accounting matrix') AND ALL ('expenditure survey' OR 'budget survey*' OR 'consumer survey*' OR 'consumption survey*' OR 'household survey*' OR 'family survey*' OR 'household-level survey*' OR 'household level survey*' OR 'time-use survey*' OR 'time use survey*' OR 'labour force survey') AND TITLE-ABS-KEY ('household production*' OR 'home production*' OR 'household producing' OR 'home producing' OR 'household productive' OR 'home productive' OR 'produced at home' OR 'production for consumption' OR 'subsistence product*' OR 'informal work' OR 'informal economy' OR 'grey economy' OR 'non-observed economy' OR 'unobserved economy' OR 'own produc*' OR ('production' W/3 'home*') OR ('production' W/3 'household*') OR 'domestic work' OR 'home-made' OR 'home-cooked' OR 'home made' OR 'home cooked' OR 'Homemade' OR 'homecooked' OR 'non-market' OR 'non market' OR 'nonmarket' OR 'household work' OR 'home work' OR 'household activit*' OR 'unpaid work' OR 'housework' OR 'time-use' OR 'time use*' OR 'time spen*' OR chore OR leisure OR 'time consum*'))
Search in Web of Science:
'input–output' OR 'social accounting matrix' (All Fields) and 'expenditure survey' OR 'budget survey*' OR 'consumer survey*' OR 'consumption survey*' OR 'household survey*' OR 'family survey*' OR 'household-level survey*' OR 'household level survey*' OR 'time-use survey*' OR 'time use survey*' OR 'labour force survey' (All Fields) and 'household production*' OR 'home production*' OR 'household producing' OR 'home producing' OR 'household productive' OR 'home productive' OR 'produced at home' OR 'production for consumption' OR 'subsistence product*' OR 'informal work' OR 'informal economy' OR 'grey economy' OR 'non-observed economy' OR 'unobserved economy' OR 'own produc*' OR ('production' NEAR/3 'home*') OR ('production' NEAR/3 'household*') OR 'domestic work' OR 'home-made' OR 'home-cooked' OR 'home made' OR 'home cooked' OR 'Homemade' OR 'homebook' OR 'non-market' OR 'non market' OR 'nonmarket' OR 'household work' OR 'home work' OR 'household activit*' OR 'unpaid work' OR 'housework' OR 'time-use' OR 'time use*' OR 'time spen*' OR 'time manage*' OR chore OR leisure OR 'time consum*' (Topic)
Search in ProQuest:
('input–output' OR 'social accounting matrix') AND ('expenditure survey' OR 'budget survey*' OR 'consumer survey*' OR 'consumption survey*' OR 'household survey*' OR 'family survey*' OR 'household-level survey*' OR 'household level survey*' OR 'time-use survey*' OR 'time use survey*' OR 'labour force survey') AND noft(('household production') OR ('home production' OR 'home productions') OR 'household producing' OR 'home producing' OR 'household productive' OR 'home productive' OR 'produced at home' OR 'production for consumption' OR ('subsistence production') OR 'informal work' OR 'informal economy' OR 'grey economy' OR 'non-observed economy' OR 'unobserved economy' OR 'own produc*' OR ('production' W/3 'home*') OR ('production' W/3 'household*') OR 'domestic work' OR 'home-made' OR 'home-cooked' OR 'home made' OR 'home cooked' OR 'Homemade' OR 'homecooked' OR 'non-market' OR 'non market' OR 'nonmarket' OR 'household work' OR 'home work' OR ('household activities') OR 'unpaid work' OR 'housework' OR 'time-use' OR ('time use' OR 'time used' OR 'time user' OR 'time users' OR 'time uses') OR ('time spencer' OR 'time spend' OR 'time spending' OR 'time spent') OR chore OR leisure OR ('time consumed' OR 'time consumer' OR 'time consuming' OR 'time consumption'))
Databases for search in ProQuest:
ABI/INFORM Collection
Ebook Central
EconLit
International Bibliography of the Social Sciences (IBSS)
Periodicals Index Online
Politics Collection
Publicly Available Content Database
Research Library
SciTech Premium Collection
Social Science Database
Sociology Collection
Appendix B: Reviewed papers
Aall C 2011 Energy use and leisure consumption in Norway: an analysis and reduction strategy J. Sustain. Tour. 19 729–45
Agbahey J, Siddig K and Grethe H 2020 Implications of labor supply specifications in CGE models: a demonstration for employment of Palestinian labor in Israel and its impact on the West Bank economy Econ. Anal. Policy 68 265–84
Antal M, Plank B, Mokos J and Wiedenhofer D 2020 Is working less really good for the environment? A systematic review of the empirical evidence for resource use, greenhouse gas emissions and the ecological footprint Environ. Res. Lett. 16 013002
Aslaksen I, Fagerli T and Gravningsmyhr H 1996 An estimation of time and commodity intensity in unpaid household production in Norway Fem. Econ. 2 81–91
Aslaksen I, Fagerli T and Gravningsmyhr H A 1995 Measuring household production in an input-output framework: the Norwegian experience Stat. J. U.N. Econ. Comm. Eur. 12 111–31
Bieser J C T and Hilty L M 2020 Conceptualizing the impact of information and communication technology on individual time and energy use Telemat. Inform. 49 101375
Bittman M and Ironmonger D 2011 Valuing time: a conference overview Soc. Indic. Res. 101 173–83
Carrasco C and Serrano M 2011 Lights and shadows of household satellite accounts: the case of Catalonia, Spain Fem. Econ. 17 63–85
Choi E-Y and Johnson T G 2014 Economic impact of the informal childcare sector in Kansas J. Reg. Anal. Policy 44 20–35
Druckman A, Buck I, Hayward B and Jackson T 2012 Time, gender and carbon: a study of the carbon implications of British adults' use of time Ecol. Econ. 84 153–63
Fontana M 2001 Modelling the Effects of Trade on Women: A Closer Look at Bangladesh (No. 139) (Sussex: Institute of Development Studies)
Fontana M 2002 Modelling the Effects of Trade on Women: The Case of Zambia (No. 155) (Sussex: Institute of Development Studies)
Fontana M 2004 Modelling the effects of trade on women, at work and at home: comparative perspectives Econ. Prospect. 3 49–80
Fontana M and Wood A 2000 Modeling the effects of trade on women, at work and at home World Dev. 28 1173–90
Gershuny J 1987 Time use and the dynamics of the service sector Serv. Ind. J. 7 56–71
Heinonen J, Jalas M, Juntunen J K, Ala-Mantila S and Junnila S 2013a Situated lifestyles: I. How lifestyles change along with the level of urbanization and what the greenhouse gas implications are—a study of Finland Environ. Res. Lett. 8 025003
Heinonen J, Jalas M, Juntunen J K, Ala-Mantila S and Junnila S 2013b Situated lifestyles: II. The impacts of urban density, housing type and motorization on the greenhouse gas emissions of the middle-income consumers in Finland Environ. Res. Lett. 8 035050
Hoekstra R 2020 SNA and beyond: towards a broader accounting framework that links the SNA, SDGs and other global initiatives Stat. J. IAOS 36 657–75
Ironmonger D 1995 International development of household input-output tables Invited Paper Presented to 50th Session of the Int. Statistical Institute
Ironmonger D 1996 Counting outputs, capital inputs and caring labor: estimating gross household product Fem. Econ. 2 37–64
Ironmonger D 1997 National accounts of household productive activities Invited Paper Presented to the US Bureau of Labor Statistics and MacArthur Foundation Network Conf. on Time Use, Non-Market Work and Family Well-Being
Ironmonger D 2001 Household Production and the Household Economy (No. 833; Research Papers) (Department of Economics, University of Melbourne)
Ironmonger D and Richardson E 1991 Leisure: An Input-Output Approach (No. 16; Research Discussion Papers) (Centre for Applied Research on the Future, University of Melbourne)
Ironmonger D and Sonius E 1989 Household productive activities Households Work ed D Ironmonger (Sydney: Allen and Unwin)
Isham A, Gatersleben B and Jackson T 2019 Flow activities as a route to living well with less Environ. Behav. 51 431–61
Jalas M 2002 A time use perspective on the materials intensity of consumption Ecol. Econ. 41 109–23
Jalas M 2005 The everyday life context of increasing energy demands: time use survey data in a decomposition analysis J. Ind. Ecol. 9 129–45
Jalas M and Juntunen J K 2015 Energy intensive lifestyles: time use, the activity patterns of consumers, and related energy demands in Finland Ecol. Econ. 113 51–59
Jiang Y, Motose R and Ihara T 2022 Estimating the carbon footprint of household activities in Japan from the time-use perspective Environ. Sci. Pollut. Res. 30 22343–74
Kazemier B and Exel J 1992 The allocation of time in the Netherlands in the context of the SNA; a module (Central Bureau of Statistics, Department of Socio-cultural Statistics) (NA-052)
Landefeld J S and McCulla S H 2000 Accounting for nonmarket household production within a national accounts framework Rev. Income Wealth 46 289–307
Mainar‐Causapé A J, Boulanger P, Dudu H and Ferrari E 2020 Policy impact assessment in developing countries using social accounting matrices: the Kenya SAM 2014 Rev. Dev. Econ. 24 1128–49
Minx J C and Baiocchi G 2009 Time use and sustainability: an input-output approach in mixed units Handbook of Input-output Economics in Industrial Ecology ed S Suh (Berlin: Springer) pp 819–46
Mosa A, Grethe H and Siddig K 2020 Economy-wide effects of reducing the time spent for water fetching and firewood collection in Ethiopia Environ. Syst. Res. 9 1–18
Nässén J and Larsson J 2015 Would shorter working time reduce greenhouse gas emissions? An analysis of time use and consumption in Swedish households Environ. Plan. C 33 726–45
Pratt J E 2007 An input-output approach to valuing non-market household time Int. J. Econ. Dev. 9 239–68
Pratt J E 2009 The regional economic value of market household production time: combining an IO framework with time use data J. Reg. Anal. Policy 39 86–98
Ropke I and Godskesen M 2007 Leisure activities, time and environment Int. J. Innov. Sustain. Dev. 2 155–74
Schaffer A 2007a Sozioökonomische input-output-Tabellen für Deutschland in zeitlicher, monetärer und räumlicher Dimension Jahrb. Fur Reg. 27 1–22
Schaffer A 2007b Women's and men's contributions to satisfying consumers' needs: a combined time use and input–output analysis Econ. Syst. Res. 19 23–36
Siddiqui R 2005 Modelling gender dimensions of the impact of economic reforms on time allocation among market, household, and leisure activities in Pakistan Pak. Dev. Rev. 44 615–39
Smetschka B, Wiedenhofer D, Egger C, Haselsteiner E, Moran D and Gaube V 2019 Time matters: the carbon footprint of everyday activities in Austria Ecol. Econ. 164 106357
Stahmer C 2010 The magic triangle of input-output tables World Rev. Polit. Econ. 1 619–51
Stahmer C and Ewerhart G 1999 Ökonomie, in Zeit aufgelöst 3. Berliner Kolloquium Zur Weiterentwicklung Der Volkswirtschaftlichen Gesamtrechnungen
Takase K, Kondo Y and Washizu A 2005 Consumers' behavior and environmental impact of time use: an analysis by the waste input-output model and a consumer model 2005 4th Int. Symp. on Environmentally Conscious Design and Inverse Manufacturing pp 70–73
Vihavainen M 1995 Calculating the Value of Household Production in Finland in 1990: The Input-output Table (No. 6) (Statistics Finland)
Wiedenhofer D, Smetschka B, Akenji L, Jalas M and Haberl H 2018 Household time use, carbon footprints, and urban form: a review of the potential contributions of everyday living to the 1.5 C climate target Curr. Opin. Environ. Sustain. 30 7–17
Yu B, Zhang J and Wei Y-M 2019 Time use and carbon dioxide emissions accounting: an empirical analysis from China J. Clean. Prod. 215 582–99
Footnotes
- 1
In general discussions throughout the paper, the term 'input–output' will also refer to social accounting matrices.
- 2
Referred to as leisure in many papers.
- 3
Papers marked with an asterisk (*) are references that are not part of the systematically identified papers.
- 4
Household input–output tables for Sweden and Canada developed in the 1990s have not been possible to access.
- 5
Here understood as the share of time and commodities in the economic value of household production.
Supplementary data (<0.1 MB XLSX)