

Abstract
Mangrove forest plays a key role in regulating climate change, earth carbon cycling and other biogeochemical processes within blue carbon ecosystems. Therefore, mangrove forests should be incorporated into Earth system climate models with the aim of understanding future climate change. Despite multiple carbon stock and flux assessments taking place over the past couple of decades, concrete knowledge of carbon source/sink patterns is largely lacking, particularly in the biodiversity-rich Asia-Pacific (AP) region with its 68 493 km2 of mangrove area. Thus, to understand the gaps in mangrove blue carbon research in the AP region, we summarize a recent decade-long inventory of carbon stock pools (aboveground, belowground and soil) and biogeochemical flux components (burial, export/import, soil-air and water-air CO2 flux) across 25 AP countries to understand the current knowledge and gaps. While carbon stock assessments of individual components are available for all 25 countries, whole ecosystem carbon stocks—including live and standing dead aboveground and belowground, downed woody debris and soil carbon stocks—are often lacking, even in highly researched countries like Indonesia. There is restricted knowledge around biogeochemical carbon fluxes in 55% of the countries, suggesting poor carbon flux research across the region. Focusing on flux components, reports on sediment-to-sea carbon exports are extremely limited (coming from just nine countries in the AP region). There is notable scarcity of data on carbon export fluxes in Indonesian mangroves. Given the key role AP mangroves play in climate change mitigation worldwide, more detailed and methodologically comparable investigation of biogeochemical source/sink processes is required to better understand the role of this large carbon source in global carbon stocks and fluxes, and hence, global climate.
Export citation and abstract BibTeX RIS

Original content from this work may be used under the terms of the Creative Commons Attribution 4.0 license. Any further distribution of this work must maintain attribution to the author(s) and the title of the work, journal citation and DOI.
1. Introduction
Mangroves colonizing the tropical and subtropical margins between land and sea are carbon-rich ecosystems. Asia-Pacific (AP) mangroves make up around 48% of the 15 million ha of mangroves that cover the Earth's surface; the remainder is located in the Atlantic East Pacific region (Jahnke 2010). Despite this fairly equal distribution, the AP region is known to have the highest mangrove biodiversity, harboring around 69 species of true mangrove species (Saenger et al 2019). Recent discussions have highlighted the important role mangroves play in mitigating climate change, through the sequestration of atmospheric and oceanic carbon dioxide (CO2), and the storage of organic carbon within mangrove biomass and sediment for centuries to millennia. Mangroves are therefore globally recognized as carbon-rich ecosystems (also known as 'blue carbon' ecosystems) that exceed 2.5–5 times the mean carbon stock density (1023 ± 88 Mg C ha−1) of tropical upland, temperate and boreal forests (Donato et al 2011). Mangrove carbon cycle research has evolved significantly since the stock assessment by Donato et al (2011). Studies over the last decade have shown divergent trends, depending on their focus, context and methodology. This means they cannot be easily generalized, as they typically focus on distinct contexts, like carbon dynamics across intact or pristine, restored and degraded mangrove forests (Bullock et al 2011, Hoque et al 2011, Hong et al 2011, Su et al 2021). However, a comprehensive synthesis that considers both carbon stocks and biogeochemical flux estimates is still lacking, particularly for the AP; this is critical knowledge if we are to fully understand and recognize the role of mangroves in climate change mitigation (Sharma et al 2022).
Literature is available on mangrove carbon stock assessments (live and standing dead aboveground and belowground, as well as downed woody debris, and sediment) in countries like Indonesia, India, Bangladesh, Vietnam and Thailand; however, flux estimates are very limited for these and other AP countries (Kauffman et al 2020). With growing interest in resolving the carbon budget, the specific contribution of AP mangroves has yet to be fully highlighted and reframed in the context of climate change mitigation or blue carbon (Santos et al 2021). Such a synthesis for the biodiversity hotspot of AP mangroves would accelerate mangrove-focused blue carbon research at global, regional and local levels, helping to identify research trends and gaps. It would also support policy guidance and action in biodiversity conservation and other relevant domains like climate change mitigation.
It is important to understand whether a particular mangrove forest is acting as a net source or sink of carbon so that its role in mitigating climate change can then be evaluated (Soper et al 2019). This means it is key to examine the biogeochemical fluxes that are associated with the global carbon cycle (Alongi 2014). Previous evidence has revealed mangroves can export significant amounts of dissolved/particulate organic and inorganic carbon to the sea (Dittmar et al 2006, Reithmaier et al 2020, Ray et al 2021a), emit CO2 by enhancing heterotrophic respiration in combination with autotrophic respiration (Bouillon et al 2008, Leopold et al 2015, Hien et al 2018), and accumulate the fraction of organic carbon pool that escapes degradation or export, at a depth of a few meters, on a long-term basis (Twilley et al 1992, Lallier-Verges et al 1998, Dittmar and Lara 2001). Yet the magnitude of changes in mangrove-derived carbon fluxes is very uncertain, mainly because of variability in tidal and seasonal patterns (Maher et al 2013, Taillardat et al 2018), as well as differences in sampling points and geomorphic settings (Ray and Weigt 2018, Twilley et al 2018, Call et al 2019) and in mangrove stand structure and productivity (Ray and Weigt 2018). If mangroves are degraded or deforested, their carbon sink capacity is lost or adversely affected, and any organic carbon stored is released, resulting in CO2 emissions. Conversion of mangroves to different land-use types—like aquaculture ponds, paddy fields and pasture—has resulted in blue carbon stocks two to eight times lower than those of intact mangrove forests (Murdiyarso et al 2015, Kauffman et al 2018, Sasmito et al 2019, Sharma et al 2020). Quantifying blue carbon is therefore an important task that increases the value of wetland restoration and carbon credits (Su et al 2021). However, the lack of comprehensive carbon pool data for AP hampers the creation of a systematic database on blue carbon budgets.
Here we conduct a literature survey to examine the status of the blue carbon budget in AP mangroves, with a particular focus on (1) creating a country-level blue carbon database based on stock and flux assessments, and (2) identifying gaps to understand a source/sink pattern and way forward in the AP region.
2. Material and method
We were able to extract blue carbon related data from 25 of the 41 AP countries, which we classified into four sub-regions: East Asia (EA), Southeast Asia (SEA), South Asia (SA) and Pacific Ocean (PO). We used Web of Science and Mendeley Pangea, personal datasets, published reports and book chapters to generate the most extensive dataset to date on mangrove carbon stocks (sediment and biomass) and biogeochemical fluxes (including export/import, burial, soil-air and water-air emissions) in the region. Aboveground carbon (AGC) includes live and standing dead tree carbon, and belowground carbon (BGC) means live and dead tree root carbon. In our analyses, ecosystem carbon stock is the sum of aboveground, belowground and sediment carbon (table 1). Export or import fluxes include three carbon forms: dissolved organic carbon (DOC), particulate organic carbon (POC) and dissolved inorganic carbon (DIC) (table 2).
Table 1. Number of studies (%) on aboveground, belowground, soil and ecosystem carbon stocks in a literature survey on Asia-Pacific countries. Bold numbers indicates the highest number of studies (%) for AGC, BGC, SOC and ecosystem carbon stocks from Asia-Pacific countries.
| Region/Subregion | Country | AGC stocks | BGC stocks | SOC stocks | Ecosystem carbon stocks |
|---|---|---|---|---|---|
| East Asia | China | 4 (1.9%) | 4 (3.1%) | 7 (3.0%) | 4 (3.4%) |
| East Asia | Japan | 2 (0.9%) | 2 (1.6%) | 2 (0.8%) | 2 (1.7%) |
| East Asia | 6 (2.8%) | 6 (4.7%) | 9 (3.8%) | 6 (5.0%) | |
| Southeast Asia | Indonesia | 79 (36.9%) | 23 (18.0%) | 75 (31.8%) | 17 (14.3%) |
| Southeast Asia | Malaysia | 7 (3.3%) | 7 (5.5%) | 11 (4.7%) | 7 (5.9%) |
| Southeast Asia | Myanmar | 1 (0.5%) | 1 (0.8%) | 1 (0.4%) | 1 (0.8%) |
| Southeast Asia | Timor-Leste | 3 (1.4%) | 3 (2.3%) | NA | NA |
| Southeast Asia | Philippines | 24 (11.2%) | 25 (19.5%) | 30 (12.7%) | 24 (20.2%) |
| Southeast Asia | Singapore | 1 (0.5%) | 1 (0.8%) | 1 (0.4%) | 1 (0.8%) |
| Southeast Asia | Thailand | 15 (7.0%) | 10 (7.8%) | 16 (6.8%) | 10 (8.4%) |
| Southeast Asia | Vietnam | 15 (7.0%) | 15 (11.7%) | 17 (7.2%) | 15 (12.6%) |
| Southeast Asia | Cambodia | 7 (3.3%) | 7 (5.5%) | 7 (3.0%) | 7 (5.9%) |
| Southeast Asia | Brunei | NA | NA | 1 (0.4%) | NA |
| Southeast Asia | 152 (71.0%) | 92 (71.9%) | 159 (67.4%) | 82 (68.9%) | |
| South Asia | India | 9 (4.2%) | 8 (6.3%) | 15 (6.4%) | 7 (5.9%) |
| South Asia | Bangladesh | 3 (1.4%) | 2 (1.6%) | 4 (1.7%) | 4 (3.4%) |
| South Asia | Sri Lanka | 1 (0.5%) | 1 (0.8%) | 1 (0.4%) | 1 (0.8%) |
| South Asia | Pakistan | 1 (0.5%) | 1 (0.8%) | 1 (0.4%) | 1 (0.8%) |
| South Asia | 14 (6.5%) | 12 (9.4%) | 21 (8.9%) | 13 (10.9%) | |
| Pacific Ocean | Micronesia | 14 (6.5%) | 2 (1.6%) | 14 (5.9%) | 2 (1.7%) |
| Pacific Ocean | New Caledonia | NA | NA | 3 (1.3%) | NA |
| Pacific Ocean | Papua New Guinea | NA | NA | 1 (0.4%) | NA |
| Pacific Ocean | Australia | 10 (4.7%) | 1 (0.8%) | 7 (3.0%) | 1 (0.8%) |
| Pacific Ocean | New Zealand | 3 (1.4%) | NA | 1 (0.4%) | NA |
| Pacific Ocean | Fiji | 12 (5.6%) | 12 (9.4%) | 12 (5.1%) | 12 (10.1%) |
| Pacific Ocean | Hawaii | 3 (1.4%) | 3 (2.3%) | 3 (1.3%) | 3 (2.5%) |
| Pacific Ocean | Tuvalu | NA | NA | 6 (2.5%) | NA |
| Pacific Ocean | 42 (19.6%) | 18 (14.1%) | 47 (19.9%) | 18 (15.1%) | |
| Asia-Pacific Region | 214 (100%) | 128 (100%) | 236 (100%) | 119 (100%) |
Note: AGC, aboveground carbon; BGC, belowground carbon; SOC, soil organic carbon.
Table 2. Number of studies (%) on dissolved organic carbon (DOC), dissolved inorganic carbon (DIC), particulate organic carbon (POC), sediment carbon burial rates, sediment CO2 flux and water-atmosphere CO2 flux in a literature survey on Asia-Pacific countries. Bold numbers indicates the highest number of studies (%) for DOC, DIC, C burial rates, sediment CO2 flux and water-atmosphere CO2 flux from Asia-Pacific countries except for POC, where only single study found from AP countries.
| Region/ subregion | Country | DOC export | DIC export | POC export/import | Carbon burial rate | Sediment CO2 flux | Water CO2 flux |
|---|---|---|---|---|---|---|---|
| East Asia | China | NA | NA | NA | 3 (9%) | 4 (13%) | NA |
| Japan | NA | 1 (13%) | NA | 1 (3%) | NA | 2 (18%) | |
| Taiwan | 1 (14%) | 1 (13%) | 1 (17%) | NA | NA | NA | |
| Hong Kong | NA | NA | NA | NA | 1 (3%) | NA | |
| East Asia | 1 (14%) | 2 (25%) | 1 (17%) | 4 (13%) | 5 (17%) | 2 (18%) | |
| Southeast Asia | Indonesia | NA | NA | NA | 10 (31%) | 7 (23%) | 1 (9%) |
| Philippines | 1 (14%) | 1 (13%) | 1 (17%) | 2 (6%) | 3 (10%) | NA | |
| Malaysia | NA | NA | NA | 1 (3%) | NA | NA | |
| Thailand | NA | NA | NA | 2 (6%) | 1 (3%) | NA | |
| Vietnam | 1 (14%) | 1 (13%) | NA | 2 (6%) | 4 (13%) | 1 (9%) | |
| Cambodia | NA | NA | NA | 1 (3%) | NA | NA | |
| Southeast Asia | 2 (29%) | 2 (25%) | 1 (17%) | 18 (56%) | 15 (50%) | 2 (18%) | |
| South Asia | India | 1 (14%) | 1 (13%) | 1 (17%) | 1 (3%) | 3 (10%) | 4 (36%) |
| Pacific Ocean | Australia | 2 (29%) | 2 (25%) | 1 (17%) | 3 (9%) | 2 (7%) | 2 (18%) |
| New Zealand | NA | NA | NA | 2 (6%) | 3 (10%) | NA | |
| Palau | 1 (14%) | 1 (13%) | 1 (17%) | 2 (6%) | NA | NA | |
| Hawaii | NA | NA | NA | 1 (3%) | NA | NA | |
| Tuvalu | NA | NA | NA | 1 (3%) | NA | NA | |
| Papua New Guinea | NA | NA | 1 (17%) | NA | NA | 1 (9%) | |
| New Caledonia | NA | NA | NA | NA | 2 (7%) | NA | |
| Pacific Ocean | 3 (43%) | 3 (38%) | 3 (50%) | 9 (28%) | 7 (23%) | 3 (27%) | |
| Asia-Pacific region | 7 (100%) | 8 (100%) | 6 (100%) | 32 (100%) | 30 (100%) | 11 (100%) |
Note: NA, data not available.
Using a systematic review protocol (Sasmito et al 2016), we employed the following keywords to retrieve the dataset: 'mangrove carbon stock', 'mangrove biomass', 'mangrove carbon burial/sedimentation rate', 'mangrove sediment/soil flux', 'mangrove water flux', 'mangrove dissolved organic carbon', 'mangrove particulate organic carbon' and 'mangrove dissolved inorganic carbon'. We utilized only data relating to AP countries, discarding unrelated data if this was also part of the studies. Data was compiled on burial fluxes of sedimentary organic carbon, soil-air/water-air emissions of CO2, the latitude and longitude of sample locations, percent organic carbon content of sediment, and maximum sediment core depth. Occasionally, the original data was presented as an average across multiple sites; in these cases, the GPS coordinates of the middle point were used. For a few countries, particularly island nations, we also verified the individual data against country-level data that was available. For data on carbon stocks, we focused on data between 2011 and 2020; however, if data was missing from certain countries, we used data from 1980 to 2020 if available. Data for carbon export/import and fluxes was generated from a search focus on 1980–2020, due to the lack of available data in more recent years.
Overall, we collated AGC data from 214 studies in total from 20 countries across the AP region (figure S1(a); table 1). Most AGC data was generated from the SEA sub-region (152), followed by the PO (42), SA (14) and EA (6) sub-regions (table 1). BGC stock includes biomass from live and standing dead trees. In total, we collected 128 BGC data from 19 countries across the AP region (figure S1(b); table 1). The largest amount of BGC data came from the SEA subregion (92), followed by the PO (18), SA (12) and EA (6) subregions (table 1). We collected 236 pieces of data on soil organic carbon (SOC) stocks from 23 AP countries (figure S2; table 1). Most of this SOC stock data (67.4%) related to SEA, with almost a third (31.8%) relating to Indonesia (table 1). Out of 24 countries, only one country—Timor-Leste—had no SOC stock data (table 1). We found 119 pieces of data on ECS from 18 countries across AP (figure S3; table 1). Most of the ECS data (69%) related to SEA, with 20% of the data relating to the Philippines (table 1). The lowest amount of ECS data (5%) came from the EA subregion (table 1); while the PO and SA subregions contributed 15% and 11% of the ECS data for AP, respectively (table 1).
Among the 25 countries considered in the region, just 5 reported DOC flux estimates (figure S4; table 2); 43% of the related data came from the PO subregion (table 2). Seven AP countries reported DIC exports/imports (figure S5; table 2). The PO region contributed 38% of the DIC data (figure S5; table 2). Export or import fluxes of POC were reported for six countries (figure S6; table 2). We collected data from 14 AP countries to estimate the carbon accumulation rate (CAR) of the region's mangroves (figure S7; table 2). Sediment-air CO2 flux data was available for 10 of the 25 AP countries (figure S8; table 2). The SEA subregion contributed half (50%) of this sediment CO2 flux data, with Indonesia contributing 23% of all regional data (table 2). Data on water-air CO2 fluxes was obtained from six AP countries, based on literature surveys (figure S9; table 2). We used one-way ANOVA ('analysis of variance') to compare mean values for aboveground, belowground, soil and ECS, and soil depth among the EA, SEA, SA and PO subregions. All values were represented in average ± SE.
3. Results and discussion
3.1. Carbon stock assessment
Mangroves grow in diverse coastal environmental settings in tropical and subtropical climates. They provide several ecosystem services, including storing significant blue carbon in sediment and biomass, thus contributing to climate change mitigation. To evaluate blue carbon stocks in mangroves, we included aboveground, belowground and sediment carbon pools; total ECS equate to the sum of all the carbon pools.
AGC stocks include pools from live, standing dead trees and downed woody debris. BGC stocks include root biomass from live and standing dead trees. We extracted estimates of AGC and BGC stock and sediment carbon stock (SCS) from 20 countries in the AP region; this includes 2 countries in EA, 10 in SEA, 4 in SA and 4 in the PO (table 1). Indonesia ranked top in quantifying AGC, BGC and SCS from mangrove locations within the archipelago. However, carbon stock data were completely missing from low-lying island PO countries like Tonga, Tuvalu, Kiribati, Nauru, Samoa, Solomon Islands and Vanuatu. Although these island nations have low mangrove coverage, as low-lying countries their role in providing ecosystem services could be substantial at country scale, as greater organic deposition from uplands may enhance blue carbon sequestration (Curnick et al 2019).
The levels of uncertainty in carbon stock pool and ecosystem carbon stock were lower at AP region level due to similar methodology used, however, they could be higher at country level due to insufficient data availability. The AGC data were collected using same methodology (Kauffman et al 2011). AGC rarely exceeded 300 Mg C ha−1, however figures differed at the regional and country scale. Some of the highest AGC figures were reported in SEA (>500 Mg C ha−1) (Sidik et al 2019) and PO (>300 Mg C ha−1) (Kauffman et al 2020), while in EA and SA, AGC was reported at less than 200 Mg C ha−1. While BGC hardly ever exceeded 150 Mg C ha−1 this also varied significantly at the regional and country scale. Some of the highest BGC figures reported were in SEA (128 Mg C ha−1) (Sidik et al 2019) and PO (144 MgC ha−1) (Kauffman et al 2011) while EA and SA reported less than 100 Mg C ha−1. Overall ranges and average values of AGC in EA, SEA, SA and PO were 35–141 (81 ± 16), 3–564 (125 ± 8), 29–225 (84 ± 14) and 2–435 (141 ± 16) Mg C ha−1, respectively. Ranges and average values of BGC in EA, SEA, SA and PO were 23–50 (34 ± 5), 2–128 (30 ± 2), 12–65 (30 ± 5) and 1–144 (50 ± 10) Mg C ha−1, respectively. Mean AGC and BGC in AP mangroves were reported at 124 ± 7 and 33 ± 2 Mg C ha−1 respectively (figures 1(a) and (b)). When comparing across subregions (EA, SEA, SA and PO), we found no significant difference (F210, 213 = 1.58; P = 0.196) across AGC average value; however, a significant difference (F124, 127 = 3.33; P = 0.022) was found across BGC among subregions. The AGC and BGC vary across countries due to species composition, geomorphological settings, climatic conditions, tidal and hydrological regime (Kauffman et al 2020, Rovai et al 2021). Looking at this globally, Kauffman et al (2020) report mean global AGC estimates as 115 Mg C ha−1; that is slightly lower than average estimates seen in the AP region (Hoque et al 2011).

Figure 1. Box plot of (a) aboveground carbon stocks, (b) belowground carbon stocks, (c) soil carbon stocks, and (d) ecosystem carbon stocks in the Asia-Pacific region (EA: East Asia, SEA: Southeast Asia, SA: South Asia and PO: Pacific Ocean).
Download figure:
Standard image High-resolution imageSCS ranged between 21 and 1054 Mg C ha−1 with a mean of 367 ± 14 Mg C ha−1 (figure 1(c)). Average values of SCS in EA, SEA, SA and PO were 215 ± 35, 397 ± 16, 107 ± 15 and 415 ± 30 Mg C ha−1, respectively. Comparing across the region, there was a significant difference (F226, 229 = 16.71; P = 0.000) between SCS average value from EA, SEA, SA and the PO. Ranging between 20 and 400 cm, mean soil depth was 138 cm, with average depth varying in EA, SEA, SA and PO at 99 ± 1, 142 ± 7, 81 ± 6 and 150 ± 9 cm, respectively. Comparing soil core depth average data from EA, SEA, SA and PO, a significant difference (F217, 220 = 4.10; P = 0.007) was also seen.
ECS equate to the sum of the AGC, BGC and SCS pools. ECS ranged between 109 and 1269 Mg C ha−1 with a mean of 498 ± 24 Mg C ha−1 (figure 1(d)). BGC represents ∼77% of the ECS. Average values of ECS in EA, SEA, SA and PO were 329 ± 69, 544 ± 29, 215 ± 32 and 547 ± 49 Mg C ha−1, respectively. There was a significant difference (F116, 119 = 8.34; P = 0.000) among average ECS from EA, SEA, SA and PO regions. SEA and PO countries contribute the most to ECS in AP. This large range is due to several factors, including forest structure, environmental and physical gradients, climate, salinity, geomorphology and rates of carbon losses (Kauffman and Bhomia 2017, Rovai et al 2018, Sasmito et al 2019, Sharma et al 2020, Kauffman et al 2020). A recent global estimate for ECS was calculated at 856 ± 32 Mg C ha−1; this value is significantly higher than that estimated for the AP region. That is because of the higher average core depth considered for this global data (216 cm versus ∼100 cm in the AP region) (Kauffman et al 2020). Total ecosystem blue carbon stocks also vary substantially across global regions, as well as among countries. For example, across Southeast Asian mangroves, total carbon stocks varied between 442 and 1267 Mg C ha−1 (Murdiyarso et al 2015), between 154 and 1484 Mg C ha−1 in West-Central Africa (Kauffman and Bhomia 2017) and in Cambodia between 315 and 1500 Mg C ha−1 (Sharma et al 2020). Blue carbon stock also varies across different mangrove environmental settings (Rovai et al 2018, Twilley et al 2018, Rogers et al 2019). Previous studies have found that blue carbon storage in deltaic and carbonate settings have been overestimated and underestimated, respectively, by up to 50% (Twilley et al 2018). ECS likewise vary across different land-use types, e.g. intact/pristine, degraded, deforested, and restored mangroves (Sasmito et al 2020, Sharma et al 2020) suggesting a dynamic trend in estimates. Consequently, it is important to incorporate environmental settings into mangrove-related blue carbon stock evaluations to obtain robust estimates.
3.2. Biogeochemical fluxes
3.2.1. Lateral carbon exchange between mangroves and the sea
Despite more regional estimates for the offshore export of mangrove-derived carbon now becoming available, particularly in the past five or six years (80% of the global reports have materialized since 1995), a wide-scale dataset for the AP region has not been produced. Among the 25 AP countries considered, just 9 reported lateral carbon flux estimates; 45% of these came from Southeast Asian countries like Palau, Vietnam, Philippines, and Papua New Guinea (table 2). Because of insufficient quantitative estimates for mangrove-derived DOC, POC and DIC, it is impossible to generalize the role of AP mangroves as a carbon source or sink. This study confirms global estimates which found it common for AP mangroves to export DOC to the open sea. Globally, AP mangroves export the most amount of DIC, whereas exported POC was reported to be the greatest in Amazonian mangroves (mean 876.5 g C m−2 yr−1) (Dittmar et al 2006). Area-normalized yearly fluxes of DOC, POC and DIC differ considerably, depending on tidal settings and calculation method. Maximum DOC, POC and DIC exports were seen in the Indian Sundarbans (705 g C m−2 yr−1), Vietnam (2152 g C m−2 yr−1) and Papua New Guinea (285 g C m−2 yr−1) respectively, while minimum exports were reported in western Taiwan (for all forms ∼1 g C m−2 yr−1). High discharge from the river Ganges and the macrotidal areas of the Bay of Bengal induces a significant flushing of DOC and sediment-eroded POC (136 g C m−2 yr−1) away to the Bay of Bengal (Ray and Weigt 2018). With the exception of one study in Evan Head, Australia, where negative POC flux was reported (meaning import), all estimates revealed an export of DOC, DIC and POC, suggesting that mangroves play a role in 'carbon outwelling' (Santos et al 2021).
The level of uncertainty in carbon flux estimates in estuaries depends on the method used, with some methods resulting in very large uncertainties. Six different methods were employed for flux estimation across the 13 export flux measurements seen. This lack of methodological uniformity contrasts with more standardized methods used to calculate other flux components, like carbon burial (which uses a 210Pb dating method), soil emission (chamber method) or water-air exchange (bulk formula); this could explain why export or outwelling flux estimations are very rare for mangrove ecosystems. This study highlights the need to establish a standard method to estimate flux globally, which would contribute to a more precise estimate of AP mangroves' blue carbon budget. Regardless of methods used, if we include non-AP mangroves and draw a global mean figure for the export/import of DOC, POC and DIC, final estimates differ significantly to those of (Alongi 2020); with this study giving 1156 g C m−2 yr−1, and the Alongi study estimating 2197 g C m−2 yr−1 (Alongi 2020); this is because the later review showed only positive export flux values and some findings were not up-to-date. Our estimates further reveal that AP exports of DOC, DIC and POC were 395 ± 20 (figure 2(a)), 102 ± 49 (figure 2(b)) and 659 ± 133 (figure 2(c)) g C m−2 yr−1, respectively.

Figure 2. Box plots of carbon fluxes as (a) DOC (dissolved organic carbon), (b) DIC (dissolved inorganic carbon), (c) POC (particulate organic carbon) export/import flux, (d) soil carbon burial rate, (e) soil CO2 flux, and (f) water CO2 flux in the Asia-Pacific region (EA: East Asia, SEA: Southeast Asia, SA: South Asia and PO: Pacific Ocean).
Download figure:
Standard image High-resolution imageDespite being extensively explored for blue carbon research and having the maximum global coverage, Indonesian mangroves suffer from a complete lack of data on carbon export fluxes to date. This is particularly striking, as some of the highest values of SCSs, carbon accumulation and burial rates, and soil emissions are reported in Indonesia; but carbon loss via export, and carbon gain via import, have never been quantified. As such, the fate of carbon remains unknown, and a concrete blue carbon budget for Indonesian mangroves cannot be established. This is particularly true for East Kalimantan, where—except for carbon stock, burial and soil emission fluxes—there is no information on mangrove-derived DOC, POC and DIC exchange fluxes, contributing to the challenge of establishing a comprehensive budget. This lack of quantitative estimates for carbon outwelling should encourage researchers to initiate flux measurement in Indonesia.
The major limitations of present flux estimates are manifold, including the influence held by wide-ranging hydrological ecological processes. Recent literature has discussed such limitations, highlighting for example the presence of green carbon in the blue carbon pool, delivered from upstream and mixed with estuarine water (Ray et al 2021b). Stable isotopes alone are not helpful in separating blue carbon from green carbon sources, unless other methods—like the eDNA method Ortega et al (2020)—are developed and applied. This remains a knowledge gap in blue carbon studies and warrants more research using e-DNA in future.
3.2.2. CARs in mangrove sediment
Although mangroves occupy just 0.5% of global land area, they sequester around 25% of the total carbon accumulated by vegetated habitats like saltmarshes, seagrasses and tropical peat (Duarte et al 2005). We registered CAR estimates from 14 countries in the AP region; overall, more than the carbon export inventory (table 2). This is likely because a standard method exists for such measurements, based on a combination of sedimentary carbon and soil accumulation rates, estimated from radioisotopes (Sanders et al 2010). Most results were retrieved from Southeast Asian countries (18), followed by PO (9), East Asian (4) and South Asian (1) countries. Indonesia ranked highest in quantifying CAR from dated cores collected from its various mangrove locations. CARs rarely exceeded 200 g C m−2 yr−1 but this differed at the regional and country scale. Some of the highest CAR were reported for Indonesia (>500 g C m−2 yr−1) (Kusumaningtyas et al 2019), while Thailand, Philippines, Vietnam, Malaysia and Cambodia reported ∼200 g C m−2 yr−1. Overall ranges of CAR in EA, SEA and the PO subregions were 108–444 (206 ± 159), 50–1722 (321 ± 386) and 26–450 (176 ± 125) g C m−2 yr−1, respectively. There was no significant difference (F28, 30 = 0.730; P = 0.491) between CAR from EA, SEA and PO regions. In SA, CAR was reported only from the Indian Sundarbans (60 ± 17 g C m−2 yr−1). Overall, mean CAR for AP mangroves was estimated at 210 ± 153 g C m−2 yr−1 (excluding one extreme value that resulted in uncertainty >100%) (figure 2(d)); which is not much different from non-AP regions (233 ± 177 g C m−2 yr−1), but slightly higher than the global estimate of 162 g C m−2 yr−1 (Alongi 2020).
Although no significant difference in CAR was observed (based on a one-way ANOVA comparison, p > 0.05) across the diverse mangrove types (intact, restored and degraded), there was a clear trend in that interior intact mangroves had higher CAR than fringed and degraded mangroves, for example Bintuni Bay (Murdiyarso et al 2021) and northern New Zealand (Pérez et al 2017). The reduction of hydrological flushing in interior mangroves supports the accumulation of organic carbon-rich debris on the sediment surface (Krauss et al 2014). System-specific variabilities in allochthonous or autochthonous inputs (e.g. sedimentation and/or decomposition rates) may also cause such differences in CAR across the reported mangroves.
Besides radiometric dating, chrono-sequential observation—or space-for-time-substitution—offers an indirect approach or type of 'natural experiment'(Azman et al 2023), as applied to relatively younger sites in the Philippines (MacKenzie et al 2021). This kind of CAR estimations by radio tracers are based on the assumption that sediment and organic carbon accumulation occur steadily during the period of accumulation. The 'indirect way' (chrono-sequencing) cannot be applied to a steady-state system (i.e. matured or climax forest); only to relatively younger sites. As such, these two approaches are mutually exclusive and useful only for specific objectives.
3.2.3. Emission flux from sediment and water to atmosphere
Mangrove soil CO2 release results were available for ten AP countries, with most available for SEA (table 2). South China and Hong Kong, and the Philippines generated the largest mean figures for CO2 emissions (∼4110 g C m−2 yr−1), while the smallest mean emissions were recorded from North Sulawesi, Indonesia and Lothian, Sundarbans (∼240 g C m−2 yr−1). Overall mean CO2 fluxes for EA, SEA, SA and PO were 2191 ± 1917, 1217 ± 1012, 931 ± 836, 1110 ± 1052 g C m−2 yr−1, respectively (figure 2(e)). There was no significant difference (F26, 29 = 1.08; P = 0.375) between soil CO2 fluxes in EA, SEA, SA and PO. The most up-to-date average CO2 flux for AP mangroves overall is 1350 g C m−2 yr−1, which is two times higher than the global mean of 613 g C m−2 yr−1 (Alongi 2020), suggesting that comparatively AP mangroves are a significant potential source of CO2. Large uncertainties around results are linked to spatial heterogeneity across the study locations, as well as differences in the techniques applied for greenhouse gas measurement. An example of this system heterogeneity is the Indian Sundarbans, where two islands show significantly different values (Henry: 263; Lothian: 2117 g C m−2 yr−1). Most measurements of CO2 flux at the sediment-air interface have been made using a custom-built system comprising of a chamber, either light or dark, enclosing a small area of the soil surface, preferably avoiding the numerous biogenic structures like pneumatophores (Kristensen et al 2008, Troxler et al 2015). Differences in mean CO2 flux between light and dark chamber measurements are insignificant (one-way ANOVA, p> 0.05) which might be due to environmental factors as described by others (Coelho et al 2009, Leopold et al 2013), e.g. desiccation of surface sediment due to sun exposed daytime condition and increased evapotranspiration may have short term effects on the photosynthetic activity of microphytobenthos. However, removal of algal mat from the chamber reveals significant differences when compared to intact sediment (p< 0.005), suggesting that photosynthetic organisms play a vital role in benthic CO2 uptake (Leopold et al 2013) Considering at edaphic factors, such as soil temperature, moisture and redox potential, these are known for governing the spatio-temporal variability of CO2 fluxes (Chen et al 2012, Leopold et al 2013). The limited data that is available for planted and restored mangroves shows higher CO2 fluxes (1837 g C m−2 yr−1) than in intact mangroves (1137 g C m−2 yr−1), but region-specific results—such as from Sulawesi, Indonesia—show practically no difference between mangrove types (Cameron et al 2019). Some of the highest rates of CO2 emissions come from cleared or degraded mangroves (for example in Honda Bay, Philippines and northern New Zealand); this infers that simply preventing deforestation can serve as an excellent way to preserve threatened carbon stocks (Lovelock et al 2011).
In comparison to soil respiration, pelagic respiration studies are conducted at a limited scale in AP mangroves. Data on water-air CO2 fluxes was obtained from surveys in six AP countries. We found the magnitude of air-water CO2 fluxes in these countries was quite similar to that of soil CO2 fluxes. Reports from SEA were limited to Indonesia and Vietnam (43–1486 g C m−2 yr−1), whereas Japan (58–1314 g C m−2 yr−1) and India (18–1570 g C m−2 yr−1) were the only countries to represent East and SA, respectively. In the PO, this data came from Australia (548–3928 g C m−2 yr−1) and Papua New Guinea (803 g C m−2 yr−1). Overall mean CO2 flux from AP mangrove waters was 1007 ± 870 g C m−2 yr−1 (figure 2(f)). A bulk formula method is applied in most studies on AP mangroves; unlike in the Everglades, where a recently-developed dual tracer of SF6 and 3He has been routinely applied over the last decade (Ho et al 2016). Our survey suggests that mangrove waters on the peripheries of Australian and Indian Sundarbans landmasses have received the most substantial attention with respect to quantifying air-water CO2 fluxes. The lowest CO2 flux—reported in the Sundarbans estuaries—is ascribed to greater dilution of organic carbon-poor seawater, with enhanced phytoplankton uptake resulting in lower water pCO2 (Biswas et al 2004, Akhand et al 2021). In contrast, greater CO2 flux from creek and river waters in other locations suggests higher input of land-derived organic carbon, leading to pCO2 enrichment in water (Call et al 2015). Therefore, based on the type of estuary, i.e. semi-enclosed creeks or perennially-open bays (e.g. Bay of Bengal) and other factors (e.g. gas transfer velocity) fluxes might vary to a great extent.
3.3. AP mangroves: carbon source or sink?
Just three countries reported all stock and flux estimates: Vietnam, India and Australia (tables 1 and 2). Two thirds (60%–70%) of AP countries lack flux estimates, whereas more than 90% of AP countries have reports on soil carbon stocks and 70% have reports on biomass stocks. Indonesia comes out top in reporting soil carbon and biomass stocks, CAR and soil CO2 fluxes. Three countries in SA —Bangladesh, Sri Lanka and Pakistan—suffer from a complete lack of flux estimates, while biomass data from these countries is also insufficient compared to India. Except for Australia and New Zealand, PO countries are also lacking in flux results. Among the four flux components, we found the most reports on CAR (48%) followed by soil CO2 flux (40%), export/import flux (28%) and water CO2 flux (25%), suggesting relatively complex and/or non-uniform methods for the latter two fluxes (particularly export/import), compared to the already-established methodologies used for CAR and soil emissions, as discussed before.
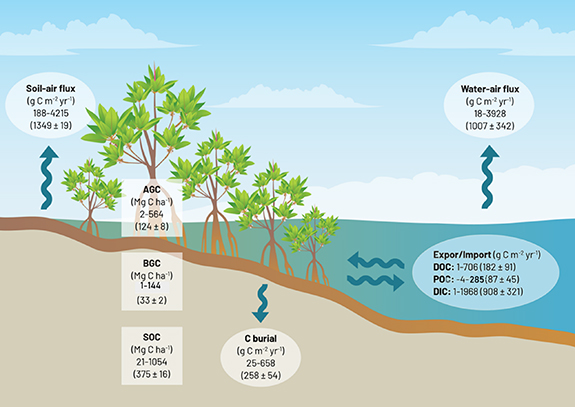
Fundamentally, to define the region's mangrove sediment as net source or sink of carbon, it is necessary to consider three coupled carbon reservoirs: (1) carbon in the form of organic matter in above and belowground biomass, (2) carbon in the form of organic matter in the sediment, and (3) carbon in the form of dissolved and particulate organic and inorganic carbon in estuarine water. Across the AP countries, only the Indian Sundarbans has a region-specific carbon budget, developed by Ray et al (2021b). This concluded the ecosystem as net carbon sink. Spatial and temporal variability is an important factor in budgeting overall C potential at regional scale. Due to variability in geomorphological settings, species diversity (Avicennia versus Rhizophora), tidal regime (spring versus neap) and seasonal changes (wet versus dry), a stratified water column with different water masses and carbon concentrations, and differences between sampling sites (river, creeks, estuarine gradient), it is difficult to develop an annual carbon budget for the AP region. We have not attempted data upscaling because of system heterogeneity; instead, we show a descriptive account of the carbon cycle for AP mangroves, based on a box model approach originally outlined by Bolin and Eriksson (1959) for the ocean. Only ranges of mean carbon fluxes and stocks are shown in the model (figure 3). Considering, carbon burial is the only input flux, and soil emission and export as the two output fluxes, our estimate shows a net loss of carbon; this means AP mangrove sediment should behave as a net source of carbon. A carbon budget that is 8–10 times of carbon burial is most likely to be the result of two processes in the sediment—carbon input through litter input, and fine root production. An approximate litterfall flux inventory for four South Asian countries was summarized by (Ray et al 2021b) with results ranging between 142 and 646 g C m−2 yr−1. Carbon concentration in yellow leaf was 38% (Ray and Weigt 2018), which is in line with ranges of carbon burial in AP mangroves. The very limited estimates available for fine root production in Southeast Asian mangroves range between 158 and 265 g C m−2 yr−1 (Poungparn et al 2016). A rough estimate for the combined input of burial, litter and fine root is three to four times lower than total losses via export and emission. This rough budget estimate requires further consideration, to identify the 'missing carbon sink' that is apparent across all AP mangroves. We recommend further investigation on biogeochemical sink processes (such as DOC released via litter leaching or porewater seepage and/or algal exudates, benthic faunal production, lithogenous and biogenic carbonate production, and night-time benthic respiration).
Figure 3. A schematic representation of an overall carbon budget for Asia-Pacific mangroves, applying a box model to summarize values across all studies (year of studies from 2011 to 2020).
Download figure:
Standard image High-resolution image
3.4. Parameters need to consider to understand mangrove as carbon sink or source
3.4.1. Gross primary productivity
The gross primary productivity (GPP) is an important component to understand the mangrove blue carbon cycle. In our analyses we did not include this component due to several reasons; (1) the scarcity of data in AP region during our study period from 2011 to 2020, (2) use of different methodologies to estimate the GPP parameters such as remote sensing (Kanniah et al 2021), tree diameter increment (Kamruzzaman et al 2019) and litterfall production (Sharma et al 2012), photosynthesis rate (Wongpattanakul et al 2015), and leaf area index based estimation of productivity (Clough et al 2000). Root productivity is a major concern to understand the mangrove belowground productivity. Long-term research is needed to monitor GPP under ongoing climate change (changing pattern in temperature and rainfall, and sea level rise) to understand how mangrove will act as a source or sink. Further research is needed to understand spatial and temporal GPP and net ecosystem productivity (NEP) across AP region to refine mangrove blue C cycle.
3.4.2. Plant-air flux
Mangrove stem mediated flux was not included in the current analysis. This is a new area of research field and currently most of the researchers are interested in it. Especially, it is still not clear how the stems from different species play roles in the carbon budget of mangrove ecosystems. Plant mediated CO2 emission was done in the Florida coastal Everglades, USA (Troxler et al 2015), therefore similar can be done in AP region. According to available evidence tree-stem methane (CH4) emissions may be an important and unaccounted component of carbon budgets (Jeffery et al 2019). Therefore, we did not include mangrove stem mediated carbon flux in our analysis's due scarcity of data in this context. Further, studies are needed to incorporate tree-stem mediated carbon budget into mangrove blue carbon cycle to understand the source or sink pattern in AP region.
3.5. Way forward
A recent study reports that the mangrove deforestation rate has decreased over the last few decades (Friess et al, 2020). However, the global threat of climate change is currently a bigger challenge for blue carbon ecosystems. The best option we have right now is to conserve and manage remaining mangroves, as well as restore them effectively as part of the UN decade of restoration (2021–2030), before eventually monitoring them to understand their role in nature-based solutions. According to literature, it almost takes 20–40 years for restored mangroves to have same ecological function to intact/pristine mangrove forest. Therefore, following a net loss and gain policy (Sharma et al 2021), it would be advisable to plant three hectares of new mangrove for every one hectare of existing mangrove removed, considering that 2030 is the tipping point for global climate change acceleration. AP countries have vast potential to restore mangroves (Worthington and Spalding 2018), if done effectively. Recent literature has highlighted the role of small patch of mangroves—especially in low-lying island countries—to provide substantial ecosystem services relative to their size (Curnick et al 2019). Low-lying AP countries will be the most impacted by climate change in the near future, especially those Pacific countries where mangroves are shown to contribute lower carbon emission to total (figure 2(e)). We believe the mangrove carbon biogeochemical cycles in these locations will change over time; this is because Pacific islands will suffer most from sea-level rise, despite broad coverage of mangrove forest. This highlights a need for better assessment, particularly in countries where much of the data is currently missing. Moreover, it is also necessary to analyze the underlying mechanisms explaining the differences among countries in this region for a better understanding of the mangrove blue carbon cycle. A deep dive into each carbon variable for understanding the mechanism, and further analyses to predict future scenarios are important steps forward in mangrove blue carbon research. Such detailed analyses of the mangrove carbon cycle will also help to provide a way forward for achieving IPCC Tier 3 estimates (whereas until now mostly Tier 1 and 2 estimates are available), to be able to quantify mangrove forest reference emission levels across the AP region; this is a politically and scientifically urgent issue given the present climate situation.
4. Conclusions
Our literature survey finds inadequate flux results across the 25 AP countries to declare the region a carbon source or sink. Carbon source or sink pattern of mangrove forest depends on existing baseline data of biogeochemical fluxes, carbon content in different reservoirs, uncertainty levels in flux and concentration, and mangrove area cover for each country. An uncertainty of less than or equal to 10% of uncertainty in individual parameters is needed to understand source or sink patterns. An eddy covariance system could be the easiest way to understand NEP, though it is quite expensive to deploy in mangrove sites (Webb et al 2019, Gnanamoorthy et al 2022). Total ecosystem carbon stock estimates—that include live and standing dead aboveground and belowground, downed woody debris and soil carbon stocks—remain missing in several countries, including in highly-studied countries like Indonesia. These need to be prioritized in future research. Results show that SEA supplied almost 70% of the data on carbon stocks; this related to Indonesia, the Philippines and Vietnam. Biogeochemical flux data was available in just 55% of AP countries; highlighting a significant data gap in carbon flux research that possibly affects global carbon models. Almost 50% of the data on carbon burial and sediment CO2 efflux came from Indonesia alone. Regarding flux, data on carbon export from sediment to sea are extremely scarce and only available for some regions (only 9 out of 13 AP countries). While most of the carbon stock, carbon burial and sediment CO2 efflux data relate to Indonesia, Indonesian data regarding carbon export fluxes from mangroves to sea (POC, DIC and DOC) are still missing. There are no data on carbon exports from Indonesian mangroves. Mass-based estimates reveal greater carbon loss via soil emissions and export than gain from temporal or permanent carbon accumulation. Scarcity of stock and flux data limits our understanding of the fate of blue carbon and its sources and sinks. This is exacerbated by the lack of methodological uniformity when it comes to flux measurements (particularly export/import). Based on an inventory of carbon stocks, AP mangroves are a highly productive carbon-rich ecosystem. However, the fate of this carbon after burial in organic form, export as organic and inorganic forms, and emission as CO2 is still unknown; this requires more in-depth investigation at a regional scale, including exploring unknown biogeochemical sink processes. Our current study explains underlying mechanism to understand mangrove blue carbon cycle at regional scale, but more emphasis on country specific results is needed for developing more detailed insights on blue carbon cycling at local scale. Understanding the different mechanisms behind individual carbon stock pool and fluxes and their interactions at each country would help developing robust blue carbon budget and simulation model. With ongoing land-use and climate-driven change and effects, the biogeochemical carbon cycle in AP mangroves will continue to change over time; as such, timely assessments are required, particularly for locations where most of the data are missing.
Acknowledgments
We are grateful to the CGIAR Research Program on Forests, Trees and Agroforestry (CRP-FTA) with financial support from the donors to the CGIAR Fund, for funding this research under CIFOR's Climate Change, Energy and Low Carbon Development portfolio. The first author sincerely thanks Institute of Ocean and Earth Sciences, Universiti Malaya, for providing support to work on the project. R R thanks AORI, The University of Tokyo for permitting to carry out this research.
Data availability statement
The data cannot be made publicly available upon publication because they are not available in a format that is sufficiently accessible or reusable by other researchers. The data that support the findings of this study are available upon reasonable request from the authors.
Conflict of interest
The authors declare that they have NO affiliations with or involvement in any organization or entity with any financial interest in the subject matter or materials discussed in this manuscript. There is no conflict of interest among authors.
Supplementary data (0.6 MB PDF)