

Abstract
Ecosystems like coral reefs mitigate rising coastal flood risks, but investments into their conservation remain low relative to the investments into engineered risk-mitigation structures. One reason is that quantifying the risk-reduction benefits of coral reefs requires an estimate of their fragility to severe stresses. Engineered structures typically have associated fragility functions which predict the probability of exceeding a damage state with the increasing loading intensity imposed by a stressor, like a hurricane. Here, we propose a preliminary framework for capturing the fragility of coral reefs towards hurricanes in an analogous way to that of an engineered structure. We base our framework on Disturbance Response Monitoring data collected in the Florida Keys and Puerto Rico following hurricanes Irma and Maria. We first establish a qualitatively consistent correlation between hurricane impacts and coral mortality rates using two surveys of coral health. We focus specifically on stony coral mortality as a metric for reef damage, simplifying the effect of coral morphology into a single quantitative index at the site scale. To quantify the loading intensity of a hurricane, we propose a Hurricane Wind Exposure Time that captures spatial variations in the exposure of different coral reef sites to hurricane force winds. We ultimately derive a simple empirical fragility function for the Florida Keys and Puerto Rico to support side-by-side comparisons of the cost-effectiveness of a coral reef and engineered solutions to flood risk reduction in these regions.
Export citation and abstract BibTeX RIS
1. Introduction
To mitigate the increasing risk posed by coastal flooding identified by the International Panel on Climate Change (Oppenheimer et al 2014), planners are increasingly considering nature-based solutions for coastal risk reduction (e.g. Arkema et al 2017). Evidence from around the world indicates that some natural ecosystems such as coral reefs are effective at reducing the financial impact of coastal flooding (Narayan et al 2016, Beck et al 2018), but it is often less clear how coral reefs compare to conventional engineering solutions in terms of cost-effectiveness. Preliminary evidence from field observations and modeling suggests that coastal habitats may be cost-effective (Narayan et al 2016, Reguero et al 2018). However, we currently lack quantitative frameworks that enable governments, investors and risk managers to assess the benefits of nature-based solutions in direct comparison with conventional engineering approaches.
To enable a side-by-side comparison of the cost-effectiveness of natural and engineered solutions to flood risk reduction, we need to quantify how hurricanes and other stressors can affect a coral reef's risk-reduction capacity. In engineering, fragility functions (Merz et al 2010, Hammond et al 2015, Gerl et al 2016) serve this purpose by predicting the probability of reaching and exceeding a predetermined damage state with increasing values of some loading intensity, such as the probability of a structure collapsing at increasing levels of earthquake ground motion (Baker et al 2021). By assessing the likelihood of damage to these structures due to impacts from extreme events during their lifetime, fragility functions inform the costs for repairs or maintenance that are to be expected (Simm et al 2008). The damage states within a fragility function are typically discrete, and associated with discrete post-damage responses (e.g. repair minor damage or replace a collapsed structure).
Numerically, fragility functions are often quantified by probabilistic lognormal cumulative distribution functions:
where F denotes failure of the system relative to a damage threshold, LI quantifies loading intensity, Φ is the standard normal cumulative distribution function, and µ and σ are the mean and standard deviation of the logarithm of the loading intensity,  , causing failure. Quantification of a fragility function thus consists of identifying damage states and a loading intensity metric LI, and estimating the model parameters µ and σ. Parameter estimation is performed using empirical data indicating intensities and failure occurrences or non-occurrences from past events.
The goal of this paper is to propose a template for characterizing the fragility of coral reefs to hurricanes in an analogous way to the fragility of engineered structures using the Florida Keys and Puerto Rico as a case study. To fit the fragility model, we use existing Disturbance Response Monitoring (DRM) for these two coral reefs. The main advantage of using DRM data as compared to other coral health assessments is that these surveys are conducted soon after a hurricane impact to identify its effects on the reef (Viehman et al 2018, 2020). To derive our hurricane fragility model, we follow the standard steps described in the previous paragraph consisting of first identifying a damage variable, a relevant metric for loading intensity, and then estimating the model parameters from DRM data.
DRM surveys are standardized, involving transect dives through several reef regions to catalog each encountered stony coral colony (Viehman et al 2018, Florida Reef Resilience Program 2022). Divers note each colony's size, species, health, and a mortality type, detailed specifically in Viehman et al (2018). A diver documents a mortality type based on what fraction of the colony appears to have died fairly long ago (i.e. 'Old Mortality'), and what fraction of the colony appears to have died recently (i.e. 'Recent Mortality') (Florida Reef Resilience Program 2022). Because we are interested in recent impacts in particular, we focus on an average Recent Mortality variable weighted by coral colony size. Although these dives have been conducted annually in the Florida Keys since 2005, they are not necessarily conducted in the same precise locations, meaning each year involves surveying a different set of corals.
Rather than cataloguing every organism that contributes to the coral reef ecosystem, DRM surveys only catalogue stony corals. Stony corals represent a broad category of not only Scleractinia stony corals, but also Hydrozoa fire corals as classified by the Florida Fish and Wildlife Conservation Commission (Jaap et al 2001, Callahan et al 2007, Ruzicka et al 2010). We use the same convention to emphasize their key similarity: the stony corals and fire corals are major contributors to the external rigid limestone skeleton that underlies a coral reef (Lewis 1989, 2006), in contrast to the Octocorals which form their own internal flexible skeletons (Sheppard et al 2009). High levels of these stony corals could maintain, improve, and expand the rigid coral reef structure despite the presence of major disturbing forces (Beeden et al 2015). Because these stony corals contribute so significantly to the structural integrity needed to buffer hurricane impacts, we choose the average Recent Mortality of stony corals as our damage variable. We classify damage as Major, Moderate or Minor to obtain discrete damage states.
Having identified the damage states, we need a quantification for a hurricane's loading intensity. While several factors can contribute to the mechanical damage done to coral reefs by a hurricane (Harmelin-Vivien 1994), the primary source of damage arises from the wave impacts generated by hurricane winds (Fabricius 2008, Puotinen et al 2016). However, reliably evaluating wave impacts requires modeled wave data through packages such as WAVEWATCH III Development Group (2019), e.g., estimations based on observations from buoys, or data to model locations susceptible to wave damage (e.g. Puotinen et al 2016); none of these options suffice for the context of the reefs in the Florida Keys or Puerto Rico due to the insufficient resolution of model inputs or outputs. To provide risk managers with a pragmatic solution, we take advantage of a finding from a study of reef damage following cyclone Ingrid in the Great Barrier Reef arguing that peak wind speed, storm duration, and cumulative wind energy all correlated with large hydrodynamic forcing and high extents of damage (Fabricius 2008). After evaluating a few candidate metrics associated with winds and waves (available in the Online Supplement), we use the Hurricane Wind Exposure Time (HWET) to capture the spatial variations of hazard exposure in different reef sites.
To fit a fragility function using these proxies, we first need to establish a robust trend between hurricane impact and coral reef damage. Prior work has shown that while hurricanes have severe impacts on the structure of ecosystems like coral reefs and mangroves (De'Ath et al 2012, Lagomasino et al 2021), there is surprising variability in damage severity. After Hurricane Donna in 1960, Ball, Shinn and Stockman (1967) reported sedimentary deposition on corals in certain reef segments and extensive broken coral rubble. Perkins and Enos (1968) revisited some of the same sites following Hurricane Betsy in 1965, and concluded that Betsy caused less damage and sedimentary erosion than Donna, potentially because of the removal of less resistant reef elements by the earlier Donna. Similarly, Hurricane Andrews in 1992 did not cause the significant damage expected based on its intensity (Pimm et al 1994). Even more surprisingly, Manzello et al (2007) contended that Hurricane Wilma induced cooling in 2005, benefiting the heavily bleached reefs in the Florida Keys. The data used in the analysis by Manzello et al (2007), however, is not available and our analysis of the existing data from the Coral Reef Evaluation and Monitoring Project (CREMP) (Porter 2020a, 2020b, 2020c, 2021a, 2021b) does not support the claim.
To establish a robust correlation between hurricane impact and coral mortality, we complement DRM surveys with CREMP data for the Florida Keys to construct a longer time-series of annual mortality levels in corals. CREMP has shared their annual surveys of the Keys' reefs through the time period 1996–2018 (Porter 2020a, 2020b, 2020c, 2021a, 2021b). In these surveys, divers record video transects of the same set of specific reef sites every summer and record the percent of area covered by each individual stony coral species, Octocorals, other wildlife, and bare substrate, a process more specifically described in any of the project's reports (e.g. Jaap et al 2001, Callahan et al 2007, Ruzicka et al 2010). Because CREMP surveys focus on the same sites in time, they are particularly well suited for detailing the time dynamics of the surveyed coral reef sites.
CREMP data extends the time-series of stony coral damage available for our analysis, and sheds light on the damage that hurricanes cause to other reef species. We briefly compare and contrast stony corals and Octocorals to demonstrate the difference in the recovery dynamics of these two classes of species. Although coral reefs may resemble offshore breakwaters structurally, they are in principle adaptive and interconnected systems. In the absence of external stressors, corals regenerate and grow rather than degrading over time as engineered structures would and hence has the potential for long-term effectiveness and adaptation (Gardner et al 2005, Mumby et al 2014). However, this ability to recover depends on the health of the reef ecosystem (Dubinsky and Stambler 1996, Ateweberhan et al 2013, Cheal et al 2017) and appears to be largely suppressed for stony corals in Florida. In contrast, we still find evidence of recovery for Octocorals, but these flexible coral species provide less risk-mitigation services.
Our assessment does not currently capture the expected effects of climate change on coral fragility such as coral bleaching (McWilliams et al 2005) and the enhanced spread of coral diseases (Cervino et al 2004, Bruno et al 2007). There is little doubt that thermal stresses are becoming more frequent and may lead to an inability for Caribbean coral reefs to recover (Edmunds 2013, Neal et al 2017). But high temperatures are not the only concern; after the 2010 Freezing Event in the Florida Keys, Colella et al (2012) investigated several patch reefs and noted significant losses within stony coral communities. Instead of addressing climate-change effects directly, we condense publicly available data of the coral reefs in the Florida Keys to inform a preliminary fragility model for the Florida Keys and Puerto Rico. Our model may not generalize to other reef types or other locations worldwide, and does not capture climate change impacts nor temperature stresses, but provides a first step towards a hurricane fragility model for coral reefs to integrate into risk mitigation planning.
2. Methods
To connect our damage variable, stony coral mortality, to discrete damage states for a fragility curve, we take advantage of the fact that divers classify the extent of aggregate damage seen at select reef sites into the categories of Major, Moderate, or Minor. We connect these damage state classifications to our damage metric by aggregating observations where they are available to create a threshold stony coral mortality for each category. This threshold is applied to all of the coral reef sites to determine if a reef site exceeded some damage state, or in other words:
where the subscript i identifies the site, and thresholds are determined by sites with observed damage state classifications.
To quantify a hurricane's loading intensity, we use a metric capturing the time a site spent within the hurricane force wind radius, which we refer to as 'Hurricane Winds Exposure Time' (HWET). Throughout each hurricane's track, NOAA's International Best Track Archive for Climate Stewardship (IBTrACS) documents a hurricane speed and an R64 value (Knapp et al 2010). The R64 value represents the distance from a hurricane center where hurricane force winds, i.e. wind-speeds greater than 118 km h−1 (74 mph or 64 kts), are felt. We assume near constant R64 values in time, and compute HWET using this data in combination with the locations of coral reef sites as:
where the subscript i identifies the site.
While proxies for damage and loading intensity are the only necessities for a fragility model for an engineered structure, the complexity of the coral reef ecosystem suggests that additional dimensions may be necessary to estimate its fragility. In particular, certain corals have a morphology that would have higher vulnerability to hurricane stresses, suggesting the need for a vulnerability proxy. To quantify the role of the dominating coral morphologies at a particular reef site, we define a metric 'Massive to Branching Coral Ratio' (MBCR), with the expectation that reefs with higher MBCR values will be more resistant to hurricane impacts:
where the subscript i identifies the site. Larger values indicate dominance of massive corals over branching corals at a particular reef site. Other morphologies of corals are considered neither weak nor strong, and are excluded from the index.
With consideration of the engineering considerations by Madin and Connolly (2006) connecting coral shape with vulnerability, we assume that the reefs where this MBCR is less than 1, i.e. where branching corals dominate, will see major damage after seeing any level of HWET with probability one. On the other hand, reefs where this MBCR is greater than 1 is considered for a lognormal fragility curve as in equation (1) with  . We find the parameters µ and σ using maximum likelihood estimation of a Bernoulli variable with the associated p determined by the lognormal fragility curve, reminiscent of (Shinozuka et al
2000). Our Bernoulli observations are formed from the assigned damage state of a reef based on DRM data, and the associated HWET observation is based on the reef's location relative to a hurricane track.
. We find the parameters µ and σ using maximum likelihood estimation of a Bernoulli variable with the associated p determined by the lognormal fragility curve, reminiscent of (Shinozuka et al
2000). Our Bernoulli observations are formed from the assigned damage state of a reef based on DRM data, and the associated HWET observation is based on the reef's location relative to a hurricane track.
3. Results
3.1. Qualitative comparison in the Florida Keys reveals distinct damage patterns in years of hurricane events and temperature anomalies
To derive a hurricane fragility model for coral reefs, we first identify a consistent relationship between hurricane events and coral mortality. Unfortunately, the effects of hurricanes on corals can be difficult to distinguish from those due to other stressors like temperature anomalies or El Ni o events. We adopt a data-centric approach to determine the correlation between coral damage and extreme weather events in CREMP and DRM surveys repeated over time in the Florida Keys. Figure 1 summarizes the coral mortality data from CREMP and DRM from 1996 to 2020 and the spatial extents of the Lower Keys, Middle Keys, and the Upper Keys regions. During this time period, three major hurricanes passed over the Keys: Georges in 1998, Wilma in 2005, and Irma in 2017. Figure 1(a) shows the trajectories of these hurricanes as determined from IBTrACS data (Knapp et al
2010).
o events. We adopt a data-centric approach to determine the correlation between coral damage and extreme weather events in CREMP and DRM surveys repeated over time in the Florida Keys. Figure 1 summarizes the coral mortality data from CREMP and DRM from 1996 to 2020 and the spatial extents of the Lower Keys, Middle Keys, and the Upper Keys regions. During this time period, three major hurricanes passed over the Keys: Georges in 1998, Wilma in 2005, and Irma in 2017. Figure 1(a) shows the trajectories of these hurricanes as determined from IBTrACS data (Knapp et al
2010).
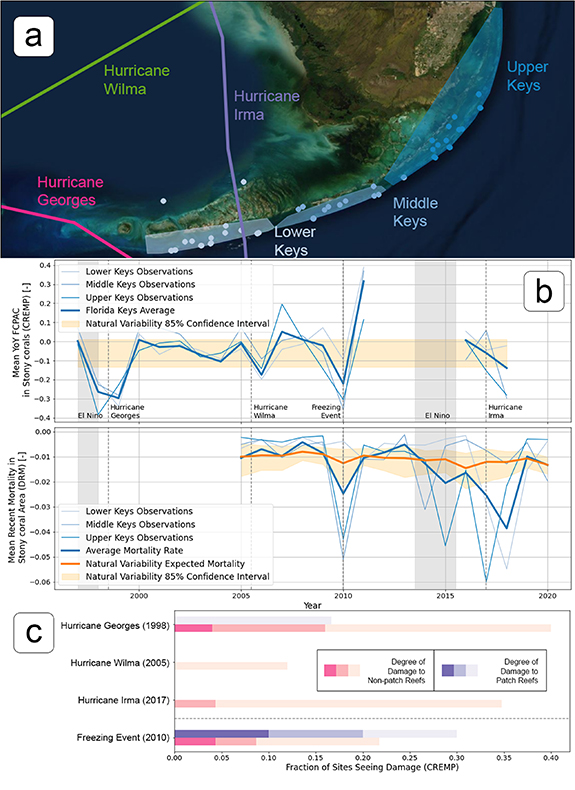
Figure 1. The relationship between coral damage and extreme weather events. (a) Map of the Keys survey sites with region designation and storm tracks. Markers indicate CREMP continuously surveyed sites, while polygons indicate the bounds of the regions in the DRM dataset. Map provided by Earthstar Geographics and obtained through Esri. (b) Variation in stony coral annual mortality rates over time. CREMP (upper) annual mortality rates involve a year-over-year fractional change in percent area cover (YoY FCPAC) of corals with a period of unknown data, and the DRM (lower) mortality rates use an average Recent Mortality variable only going back to 2005. Monte Carlo methods were used to derive the Natural Variability confidence intervals. Scales differ on the y-axis because of the different mortality measures. (c) Comparison of mortality in patch reefs compared to other reefs in CREMP data. Darker colors indicate a higher degree of damage.
Download figure:
Standard image High-resolution imageSince we are leveraging two distinct data sets for our analysis, we use two different methods to determine spatially-averaged mortality rates. In the Introduction, we described our metric for mortality in the DRM data with an average Recent Mortality variable, weighted based on coral colony size. To describe annual mortality using CREMP data, we take the fraction change in this percent area cover on consecutive years, aggregated into a metric we call year-over-year fractional change in percent area cover of corals (denoted YoY FCPAC). We illustrate this choice over total change in percent area cover with an example: a drop of coral from 2% cover to 1% cover (−0.5 YoY FCPAC) should be more significant than a drop from 10% to 9% area cover (−0.1 YoY FCPAC), despite the same total cover loss.
The time evolution of the two different metrics for mortality in the CREMP and DRM datasets are depicted in the upper and lower panels of figure 1(b), respectively. After determining spatially-averaged mortality rates across the entire Keys as well as within each region, we determine natural variability curves and associated confidence intervals using Monte Carlo methods (specified in the supplement). Despite the high noise in this data collected every year, and with the exception of Hurricane Wilma, each year corresponding to a significant stress event corresponds with one of significant coral mortality outside the window of natural variability. In the CREMP data, YoY FCPAC falls out of the natural variability confidence interval in years 1998, 1999, 2006, 2010, and 2018; in the DRM data, years 2010, 2015, 2017 (which includes a special post-Irma survey), and 2018 correspond to uncharacteristic coral mortality. These trends are supported by prior work suggesting a significant effect by hurricanes and extreme temperature stresses on the coral reefs of the Keys (Jaap et al 2001, Colella et al 2012) and more generally (De'Ath et al 2012).
At the aggregate level of analysis in figure 1(b), it might appear that hurricane impacts and extreme weather events like the 2010 Freezing Event are associated with comparable levels of coral mortality. However, figure 1(c) demonstrates that this damage tends to occur in different portions of the reef. Instead of aggregating coral mortality by region, we classify several levels of mortality following major events based on whether a reef is patch reef (purple) or not (pink). For all three hurricanes, damage in non-patch reef zones far outweighs damage in patch reefs, a phenomenon with historical precedent in Perkins and Enos (1968) and Ball et al (1967). In fact, neither Hurricane Wilma nor Hurricane Georges appear to have caused damage in patch reefs. In contrast, the 2010 Freezing Event affected patch reefs extensively, supporting a result previously suggested by Colella et al (2012) and Lirman et al (2011).
3.2. No clear evidence of recovery among stony corals in the Florida Keys
In principle, coral reef ecosystems have the ability to autonomously recover from the hurricane-induced structural damage without the continued investments to repair damage required by engineered structures. However, this ability for corals to recover is threatened by environmental degradation and declining fish populations (Mumby et al 2014). A meta-analysis of coral recovery rates after hurricane impact for the Caribbean showed that sites impacted by hurricanes continue to decline at faster rates than sites that were not impacted (Gardner et al 2005), raising the question whether a fragility model for coral reefs needs to capture recovery. To consider this issue within the specific context of the Florida Keys, we compare the differences in the temporal trends of damage and recovery for different classes of coral species, made possible with CREMP.
Some coral species within the reef ecosystem appear more prone to instability than others: Montastraeaannularis, shown in figure 2(a), is a stony coral with either a massive or encrusting morphology, while Acropora palmata, shown in figure 2(b), is a stony coral with a branching morphology. Compared to the branching morphology, the massive morphology appears less prone to damage by external forcing. In contrast to both of these rigid stony corals, the softer Octocoral, such as the sea fan in figure 2(c), maintain their own flexible skeletons. Octocorals intuitively appear to be less stable when experiencing strong hydrodynamic forcing, like trees without roots.
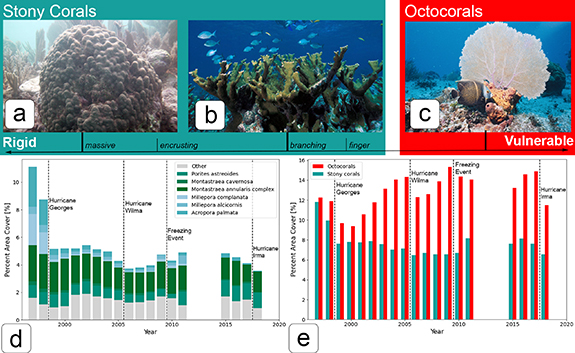
Figure 2. Variable patterns of damage and recovery for different classes of coral species.All photos retrieved through public domain.(a) The massive stony coral Montastraea annularis photographed by James Stuby in March 2008. (b) The branching stony coral Acropora p almata photographed by John Brooks in 2012. (c)An o ctocoral sea fan photographed by Lauro Barlan in June 2022. (d) Variation in the cover of the most common reef-building coral species associated with branching/finger morphologies (light blue) vs. massive morphologies (green) in non-Patch shallow reefs. (e) Comparison of average Octocoral populations and Stony Coral populations among non-Patch shallow reefs in time. Both are based on data from CREMP, which makes observations at fixed reef sites annually.
Download figure:
Standard image High-resolution imageFigure 2(d) plots the variation in time of a few dominant stony coral species in the Florida Keys, separated by those associated with a more branching morphology (light blues) and those with a massive morphology (dark greens), determined by Kluijver et al (2013). The data show a sharp decline in the branching corals that appears to coincide with 1997–1999, the years following Hurricane Georges and the El Ni o event of 1996–1997, and continues to decline if at a significantly lower rate over the following decades, reaching a historic low after Hurricane Irma. In comparison, the percent area covered by stony corals with massive morphologies is on a relatively stable, slow decline.
That analysis opens the question of whether or not any reef biota are able to recover, or if this percent area cover proxy is even able to capture a recovery dynamic. To address this question, we consider the trends of damage and recovery among stony corals with different morphologies in figure 2(d) that are aggregated into the teal columns in figure 2(e) and (compared) with the Octocorals shown in red. The data shows that Octocorals see sharp declines coinciding with extreme events, but also exhibit several years of consistent recovery following the perturbation, consistent with findings from Lasker et al (2020). Therefore, we conclude that while certain reef species are capable of observable recovery, stony coral populations remain stagnant or continue to decline. The ecosystem balance of coral species in the Keys thereby shifts toward Octocoral dominance, consistent with studies throughout the Caribbean (Lenz et al 2015, Lasker et al 2020).
The intricate ecosystem dynamics of different coral species are a crucial aspect of reef health. However, to characterize the fragility of coral reefs to hurricanes, we simplify by focusing on the damage to the primary reef-builders, the stony corals. They provide the structural integrity needed to buffer hurricane impacts comparable to the structural integrity of engineered barriers. Moreover, there is more data available to identify the impact of hurricanes on stony corals, since post-hurricane DRM surveys only monitor stony corals, and do so with comparatively less noise than CREMP. With a damage metric of stony coral mortality, the reef appears to be in a relatively steady decline with no recovery and perhaps a permanent lowered level due to possible ecosystem regime shift, indicating that recovery would not need to be included into a fragility model for the Florida Keys. With similar ecosystem dynamics seen by other authors (Edmunds 2013, Neal et al 2017) across the Caribbean, we generalize this to Puerto Rico to form a single fragility model using a stony coral mortality damage variable without recovery.
3.3. Quantifying a hurricane's loading intensity and a proxy for reef damage to inform a probabilistic fragility curve
To derive a first, quantitative fragility model for the coral reefs of the Florida Keys and Puerto Rico, we analyze two extensive DRM surveys (Viehman et al 2018, 2020). The advantage of these surveys lie in their specific identification of recent mortality, and do so shortly after hurricane impact. This facilitates a move from the qualitative correlations in section 3.1 to a quantitative relationship between hurricane loading intensity and coral damage. One survey was conducted in the Keys following Hurricane Irma (Viehman et al 2018), while the other was conducted in the coral reefs of Puerto Rico following Hurricane Maria (Viehman et al 2020).
With the metric of stony coral mortality for damage extent, we apply our quantitative proxy of the Hurricane Wind Exposure Time (HWET) for the loading intensity in a fragility function. HWET delivers optimal potential in explaining the distribution of damage extent in reefs over other modeled and measured metrics of intensity, such as wavespeeds, wave heights, windspeeds, and distances from hurricane centers. One specific advantage of HWET as a metric for loading intensity is that it explains the minimal effect of Hurricane Wilma on the reefs of the Florida Keys. As can be seen in figure 1(a), Hurricane Wilma remained distant from the Keys at all times. Wilma's distance corresponded with a maximum HWET observed by any reef in the Keys of about 3.9 h, far lower than the maximum HWET of 10.3 h from Hurricane Irma.
While our choice of stony coral mortality has been justified as the suitable quantitative proxy for damage extent in a fragility function, naively comparing the average recent mortality fraction in the stony corals with HWET neglects the significant role of coral morphology suggested in section 3.2 Although higher exposure time by HWET would be expected to lead to higher losses of corals, certain corals have a morphology that would have higher vulnerability to hurricane stresses. This confounder can be addressed with the MBCR proxy for vulnerability from section 2.
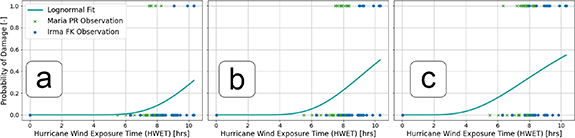
Figure 3 summarizes the quantitative relationship between our vulnerability and damage proxies with the loading intensity for hurricanes Maria and Irma. The Puerto Rico data depicted in figure 3(a) highlight the effect of morphology but provide limited spread in HWET. Because of Maria's large size and its track, almost all of the reefs experience nearly the same HWET, resulting in little vertical spread in the data. The spread in the damage level in the reefs could largely be attributed to variations in MBCR at the site (i.e. the horizontal spread in data correlates with changes in shading). In contrast, figure 3(b) entails very few data points from sites dominated by branching corals, but exhibits more spread in HWET. For sites where strong corals dominate and MBCR is greater than 1, we recover increasing levels of mortality in HWET (i.e. vertical spread in data correlates with changes in shading). We consider just the region where this metric is greater than 1 for our fragility curves, with the assumption that sites seeing low values of this metric will almost surely see major damage as a result of a hurricane.

Figure 3. The distribution of coral reefs based on their ratio of Massive and Branching corals, and the observed HWET in Puerto Rico due to Hurricane Maria (a) and in the Florida Keys due to Hurricane Irma (b). Sizes of the data points indicate relative areas of stony coral colonies found at each site. Reefs in the grey region are expected to see Major Damage regardless of HWET.
Download figure:
Standard image High-resolution imageIn figure 4, we provide a preliminary set of fragility functions for risk managers to use in their cost-benefit analyses across the Florida Keys and Puerto Rico, fitted using the combined data from those regions. We complete a cross-validation of fragility functions created using this method on Puerto Rico and the Florida Keys in the supplement.
Figure 4. Lognormal Fragility Curves as a function of HWET, the Hurricane Wind Exposure Time. PR = Puerto Rico, FK = Florida Keys. (a) Probability of Major Damage:  . (b) Probability of Moderate Damage:
  . (c) Probability of Minor Damage:
  .
.
Download figure:
Standard image High-resolution image
4. Discussion
To propose a first and preliminary model for the fragility of coral reefs to hurricane impacts, we made a deliberate, pragmatic choice to reduce the vibrant biodiversity and dynamics of the coral reef ecosystem and focus only on stony corals. Our model hence neglects the contributions of the many other coral species to the health of a reef ecosystem and the symbiosis between corals and other species like parrot fish and sea urchins (e.g. Lessios 1988, Adam et al 2011). While our choice is rooted in prioritizing the significant contributions that stony corals make to the construction of habitat itself, we also emphasize the role of limited data: post-hurricane DRM surveys specifically focus on stony coral mortality.
Even within the stony coral species, our fragility model collapses the exceptional variability in morphology within stony coral species (Pratchett et al 2015) into a simple metric, MBCR, to reduce noise in the mortality data. MBCR captures some ecological features by covariation. It implicitly captures the varying impact of hurricanes on different reef zones because the abundance of different coral morphologies varies with reef zones. For example, in their observations of the Florida Keys, Hoffmeister and Multer (1968) suggests that the branching coral Acropora palmata thrives in outer reef zones with strong surf, a location which may be exposed to higher hydrodynamic forcing by hurricanes. This suggests low MBCR could correspond with more susceptible reef zones. By collapsing variations within stony corals to an index rather than assessing losses in each species across each reef zone, we can provide risk managers with a single fragility model for the reef rather than requiring several fragility curves.
We made a key decision to not include recovery dynamics in our conceptualization, because the data shown in figure 2(d) does not show any indication of post-hurricane recovery in the stony corals over the last few decades. Although at odds with the intuition from Beeden et al (2015) that reef ecosystems are able to recover after extreme stresses, this finding is consistent with several recent studies demonstrating that stony corals in the Keys are struggling to recover, likely due to the warming ocean (Wilkinson 1998, Porter et al 2001, Precht et al 2002). Similar dynamics have been observed across all Caribbean reefs (Neal et al 2017) and the U.S. Virgin Islands (Edmunds 2013). We emphasize that the lack of stony coral recovery dynamic may not be permanent and is likely not indicative of the larger ecosystem dynamics of the coral reef. Octocorals can see significant losses due to major events such as hurricanes, as shown in the literature (e.g. Jaap et al 2001, Ateweberhan et al 2013) and our analysis, but also recover relatively rapidly as shown in figure 2(e) and (more) detailed studies like Ateweberhan et al (2013), Lasker et al (2020).
Some stony corals are expected to have the same ability to recover rapidly. For example, although the branching/finger corals are susceptible to damage from hurricanes as shown in figure 2(d), they have previously been associated with high recruitment and growth rates in the U.S. Virgin Islands (Gladfelter et al 1978). These high recruitment rates are not reflected in specific Florida Keys surveys (Wilkinson 1998, Porter et al 2001, Precht et al 2002), nor in our own analysis. Needless to say, there is no lack of confounding factors, with one option being environmental degradation over time (Gardner et al 2003) and stresses imposed by temperature as evident in figures 1(b) and (c).
Prior work has attributed the dramatic losses in coral between 1998 and 1999 in figures 1(b) and 2(d) to elevated temperatures during the El Ni o event of 1997–1998 (Wilkinson 1998, Porter et al
2001), potentially exacerbated by Hurricane Georges. Porter et al (2001) suggests that the El Ni
o event of 1997–1998 (Wilkinson 1998, Porter et al
2001), potentially exacerbated by Hurricane Georges. Porter et al (2001) suggests that the El Ni o event contributed to losses in corals by aiding the spread of disease in Acropora palmata within the Florida Keys, and Wilkinson (1998) emphasizes the role of El Ni
 o in causing bleaching-based mortality in the Keys over that of the hurricane. Most importantly, these branching/finger corals experience damage, but then do not recover in the time period studied, as shown in figure 2(d). A similar loss in stony corals is evident in the bottom panel of figure 1(b) as a result of the El Ni
 o event from 2014–2016.
On the other side of the temperature gauge, the freezing event of 2010 presented a type of loss that Lirman et al (2011), Colella et al (2012) contends would be particularly difficult to recover from due to its effects on certain slow-growing massive corals in patch reefs. Though less vulnerable to hurricane impacts, massive corals have a very slow growth rate (e.g. Porites astreoides has a growth rate of about 3 mm yr−1 compared to Acropora's near 80 mm yr−1 (Gladfelter et al 1978)). As a result, even without considering the massive corals susceptibility to disease and cold temperatures, their ability to improve and repair a reef structure is limited when compared to their branching counterparts. As a result, recovery may require more time, possibly causing regime shifts or potentially adverse consequences for biodiversity.
While not included in the current formulation of our fragility model due to the lack of data, the overall health of a coral reef could be integrated in an improved fragility model through a quality factor. Quality factors are commonly used in fragility models for engineered structures to capture the gradual decay in structural integrity over time, in the absence of investments into repair (Baker, Bradley and Stafford 2021). In the context of a fragility model for the coral reefs in the Florida Keys and Puerto Rico, a quality factor could capture the evolving health of the coral reefs as they are subject to stresses from El Ni o events and freezing events. Due to limited quantitative data, we are currently unable to estimate this quality factor. Importantly, the inclusion of this quality factor could help quantify the risk-mitigation benefits of coral restoration efforts and demonstrate the long-term value of these initiatives, particularly in light of the possibility that the proportion of intense hurricanes might be increasing due to climate change (Knutson et al
2020).
o events and freezing events. Due to limited quantitative data, we are currently unable to estimate this quality factor. Importantly, the inclusion of this quality factor could help quantify the risk-mitigation benefits of coral restoration efforts and demonstrate the long-term value of these initiatives, particularly in light of the possibility that the proportion of intense hurricanes might be increasing due to climate change (Knutson et al
2020).
Ultimately, the goal of a fragility function for coral reefs is to be general and serve as pragmatic framework for estimating likely damage, to inform investment planning and risk management decision-making for coral reef natural defenses. Without a simple and intuitive model in place that fits into the framework of engineered structures, risk managers may continue to look at nature-based risk-mitigation techniques in the style of a coral reef with ambivalence. We deliver a suggested starting point for an ongoing scientific conversation of how to best capture the fragility of coral reefs and, eventually, other nature-based features for integration into the cost-benefit analyses that inform flood-mitigation decisions.
Acknowledgment
This work was supported by the Realizing Environmental Innovation Program (REIP) at the Stanford Woods Institute for the Environment and by the Graduate Research Fellowships Program from the National Science Foundation awarded to Ian Madden. Many of our colleagues have contributed to this work through insightful discussions, including but not limited to Jeffrey Russell Koseff, Mary Ruckelshaus, Anne Guerry, Borja G Reguero, Robert Richmond, and Adrian Santiago Tate.
Data availability statement
The data that support the findings of this study are openly available at the following URL/DOI: 10.5281/zenodo.7250855. This data with supporting code is also available at the GitLab repository http://cees-gitlab.stanford.edu/sigma/coral-reef-fragility-to-hurricanes.
Author contributions
we use the CRediT System to clarify each author's contributions to this work. All authors contributed to the Conceptualization and Review/Editing. I M: Methodology, Software, Formal Analysis, Investigation, Data Curation, Writing of the Original Draft, and Visualization. A M: Methodology, Data Curation. M L: Methodology, Data Curation using WAVEWATCH III. J S: Methodology, Formal Analysis, Writing of the Original Draft, Supervision, Project Administration, and Funding Acquisition.
Supplementary data (0.3 MB PDF)