

Abstract
In this study, we investigate whether the Pacific decadal oscillation (PDO) can enhance or diminish El Niño Southern Oscillation (ENSO) temperature and precipitation teleconnections over North America using five single model initial-condition large ensembles (SMILEs). The use of SMILEs facilitates a statistically robust comparison of ENSO events that occur during different phases of the PDO. We find that a positive PDO enhances winter and spring El Niño temperature and precipitation teleconnections and diminishes La Niña teleconnections. A negative PDO has the opposite effect. The modulation of ENSO by the PDO is mediated by differences in the location and strength of the Aleutian Low and Pacific Jet during ENSO events under different phases of the PDO. This modulation is a simple combination of the individual effects of the PDO and ENSO over North America. Finally, we show that ENSO and the PDO can be used to evaluate the likelihood of the occurrence of temperature and precipitation anomalies in different regions, but cannot be used as a deterministic predictor of these anomalies due to the large variability between individual events.
Export citation and abstract BibTeX RIS
1. Introduction
Both the El Niño Southern Oscillation (ENSO) and Pacific Decadal Variability affect regional climate well beyond the Pacific region in which they occur (e.g. Deser et al 2004, Taschetto et al 2020). ENSO drives teleconnections on interannual timescales, which affect a wide range of regions. Over North America, El Niño events are associated with anomalous cold and wet winter conditions in the southwestern United States, northern Mexico, and the Gulf Coast extending into the south-eastern United States (Taschetto et al 2020). In general, the North American high latitudes experience anomalously warm winter temperatures associated with El Niños. Conversely, La Niñas tend to drive the opposite response (Taschetto et al 2020). On decadal timescales, Pacific Decadal Variability in the North Pacific Ocean is described by the Pacific decadal oscillation (PDO; Mantua et al 1997). The PDO partly results from remote tropical forcing from ENSO itself (Newman et al 2016), which is reddened by local ocean re-emergence processes, where anomalies sequestered below the summer mixed layer are re-entrained in the mixed layer the following winter, increasing the anomaly persistence from winter-to winter. Processes independent of the tropics such as interactions between the Central North Pacific wind forcing and the Kuroshio-Oyashio Extension that occur via slow westward propagating oceanic Rossby waves are also important for the PDO (Schneider and Cornuelle 2005, Newman et al 2016). Perhaps unsurprisingly, since they are related, the PDO has similar, but weaker teleconnections over North America when compared to ENSO (e.g. Dong and Dai 2015, Newman et al 2016). There are, however, local differences. For instance, the PDO has a stronger influence on temperature on the western United States coastline than ENSO (Newman et al 2016). In contrast, ENSO has a stronger effect on precipitation over the central United States than the PDO (Newman et al 2016). While the impacts of ENSO and PDO have been extensively studied in isolation, here we investigate their inter-relation. Specifically, we assess if the phase of the PDO can weaken or enhance ENSO teleconnections over North America.
Early studies demonstrated the influence of Pacific Decadal Variability on ENSO teleconnections over North America based on observations (Gershunov and Barnett 1998, McCabe and Dettinger 1999, Goodrich and Walker 2011). These studies argued that the phase of Pacific Decadal Variability is useful for determining the predictability of impacts over North America during ENSO events. However, these studies were limited by a very short ( 100 years) observational record. Recent work, bolstered by two additional decades of observations has renewed interest in this question (Dong and Dai 2015, Fuentes-Franco et al
2016, Dong et al
2018). These more recent studies found that the correlation of ENSO with temperature over Western Canada and Alaska is weakened during a negative phase of the interdecadal Pacific oscillation (IPO; basin-wide Pacific decadal variability highly correlated with the PDO (Power et al
1999)) (Dong and Dai 2015). In particular, the IPO has a stronger influence during negative phases compared to positive, and for El Niño events compared to La Niña. This modulation is attributed to changes in the Aleutian Low and related cyclonic winds.
100 years) observational record. Recent work, bolstered by two additional decades of observations has renewed interest in this question (Dong and Dai 2015, Fuentes-Franco et al
2016, Dong et al
2018). These more recent studies found that the correlation of ENSO with temperature over Western Canada and Alaska is weakened during a negative phase of the interdecadal Pacific oscillation (IPO; basin-wide Pacific decadal variability highly correlated with the PDO (Power et al
1999)) (Dong and Dai 2015). In particular, the IPO has a stronger influence during negative phases compared to positive, and for El Niño events compared to La Niña. This modulation is attributed to changes in the Aleutian Low and related cyclonic winds.
Other observationally-based studies have focused on potential impacts on North American hydroclimate. Hu and Huang (2009) found that when ENSO and the PDO are in phase, wet anomalies occur during El Niños and dry anomalies occur during La Niñas over the Great Plains. In the Upper Colorado River Basin, the PDO causes a spatial shift in teleconnections that can reverse the correlation of ENSO with precipitation during different periods (Hidalgo and Dracup 2003). In Texas, precipitation anomalies are more predictable for La Niña when the PDO is negative (Khedun et al 2014). Comparing these different studies and their results is complicated by the use of different indexes for ENSO and Pacific Decadal Variability, different time periods and regions considered, and varying methods. These results are also difficult to interpret as even with the longer observed record the PDO is not well sampled in observations.
Model experiments provide both longer records and a more extensive set of variables for analysis. Such experiments are an invaluable tool to understand the modulation of ENSO teleconnections by Pacific Decadal Variability due to the limitations in assessing processes in the observed record. Dong et al (2018) ran a global atmospheric model forced with sea surface temperatures (SSTs) constructed from different combinations of ENSO and the IPO. They find that small changes in the tropical SST cause large impacts in the extratropics via the Pacific North America wave train and the Aleutian low. Precipitation impacts during different phases of the IPO over North America are linked to tropical convection. Dong et al (2018) additionally explain the conundrum presented by Dong and Dai (2015), where the overall correlation of temperature and precipitation with ENSO over North America does not change during different phases of the IPO. This lack of change in the correlation occurs because the IPO has a similar but opposite effect on ENSO teleconnections during its opposing phases. While Dong et al (2018) provide an important basis for understanding the combined impacts of ENSO and the IPO this work is idealized and uses only one single model. Although an extension to a traditional multi-model ensemble would add information around model bias and include a more realistic variety of ENSO events, this would also be limited, similar to observations, by the short record (∼150 years) available from each individual model.
Single model initial-condition large ensembles (SMILEs; Deser et al 2020) have hundreds of instances of decadal variability, which is essential for its characterization (e.g. Xu and Hu 2018, Maher et al 2019, 2021, Liguori et al 2020). In this study, we leverage five SMILEs, which have at least 20 ensemble members to revisit the combined influence of ENSO and the PDO on North American climate. By using SMILEs, where internal variability is well sampled, we can additionally investigate how likely we are to observe the influence of the PDO on ENSO teleconnections within the noise of the climate system. Equally important we use these coupled climate models, which better represent the complicated dynamics of the observed surface, to expand on idealised experiments. Modeled ENSO events occur with a variety of spatial patterns, amplitudes, and durations similar to observations. We note that our study does not investigate a dynamical connection between ENSO and the PDO themselves. Instead, the goals of this study are to:
- (a)map differences in El Niño temperature and precipitation teleconnections over North America during different phases of the PDO
- (b)determine whether there is a non-linear relationship between ENSO and PDO teleconnections
- (c)identify atmospheric circulation changes that meditate ENSO/PDO teleconnections
- (d)assess how well can we anticipate local impacts by knowing the phase of ENSO and the PDO.
2. Model evaluation using observations
The five SMILEs used in the paper are found in table 1. The minimum ensemble size is 20, with the maximum 70. The atmospheric resolution is similar (1–2 degrees) in four SMILEs (MPI-GE, GFDL-CM3, CESM-LE, GFDL-ESM2M) and a factor of 2+ higher in the fifth (GFDL-SPEAR-MED). The forcing (i.e. greenhouse gases, aerosols, solar and volcanic) for GFDL-SPEAR-MED also differs from the other SMILEs as it is a CMIP6 generation model, while all others are CMIP5 (table 1). ENSO and the PDO have been evaluated in these SMILEs in previous studies (see table 1 for references). These previous studies find that most models (CMIP- class similar to those in this study) have a realistic PDO spatial pattern compared to observations, but underestimate the 40–60 year observed PDO period (Wei et al 2018, Delworth et al 2020). When considering a range of ENSO metrics, different models tend to perform well for some metrics and not others (Planton et al 2021). In general CMIP-class models show known biases such as the westward shift of SST anomalies compared to observations associated with wind and precipitation biases (Delworth et al 2020, Planton et al 2021). In observations, El Niño events occur as two types, eastern and central Pacific, which also have differing teleconnections (Capotondi et al 2020). Most CMIP-class models favor an eastern or central Pacific pattern, but have difficulty simulating both (Dieppois et al 2021). Given the models difficulty in representing this diversity in ENSO patterns, in this study we consider an index for ENSO which captures all types of events, namely the Nino3.4 index.
Table 1. SMILEs used in this study. The CMIP5 historical data ends in 2005 with RCP8.5 used from 2006 onwards. The CMIP6 historical data end in 2014 with SSP5-85 used from 2015 onwards. In this study we consider the period 1950–2018 for all analysis except that in figure S6. Of the seven available SMILEs from the Multi-Model Large Ensemble Archive (Deser et al 2020) we chose to use four SMILEs that have sufficient resolution, do not have extreme biases in the tropical Pacific, and have a minimum of 20 members. We additionally use the recently released GFDL-SPEAR-MED ensemble due to its high resolution over land. We reference studies that evaluate ENSO and the PDO in different models in the last column of the table. We note that CESM1-LE is named CESM1-CAM5 and MPI-GE is the model version between MPI-ESM-LR and MPI-ESM1-2-LR in these studies.
| Model name | Ensemble size | Start year | Forcing | Atmospheric Resolution | Reference | Evaluation ENSO/PDO |
|---|---|---|---|---|---|---|
| CESM-LE | 40 | 1920 | Hist (CMIP5) + RCP8.5 |

| Kay et al (2015) | Planton et al (2021)/Wei et al (2018) |
| MPI-GE | 70 | 1850 | Hist (CMIP5) + RCP8.5 |

| Maher et al (2019) | Planton et al (2021)/Fasullo et al (2020) |
| GFDL-CM3 | 20 | 1920 | Hist (CMIP5) + RCP8.5 |

| Sun et al (2018) | Planton et al (2021)/Wei et al (2018) |
| GFDL-ESM2M | 30 | 1950 | Hist (CMIP5) + RCP8.5 |

| Rodgers et al (2015) | Planton et al (2021)/Wei et al (2018) |
| GFDL-SPEAR-MED | 30 | 1850 | Hist (CMIP6) + SSP5-85 | 50 km | Delworth et al (2020) | Delworth et al (2020)/Delworth et al (2020) |
In addition to model biases, observational uncertainties are also important and in some cases can be as large as model biases themselves (e.g. Deser et al 2017, Planton et al 2021). While observations do not represent an unbiased and complete view of the world we live in they can provide a test for individual models' fitness of purpose for a particular scientific question. To assess whether the models are suitable to investigate our scientific questions we examine the five models' ability to reproduce the general observed pattern of ENSO teleconnections over North America and the PDO pattern itself. While the similarity of patterns does not necessarily imply that the correct processes are at play (e.g. Zhao et al 2021), the pattern comparison between models and observations is still an important first step for ascertaining whether the models can be expected to have realistic ENSO and PDO teleconnections.
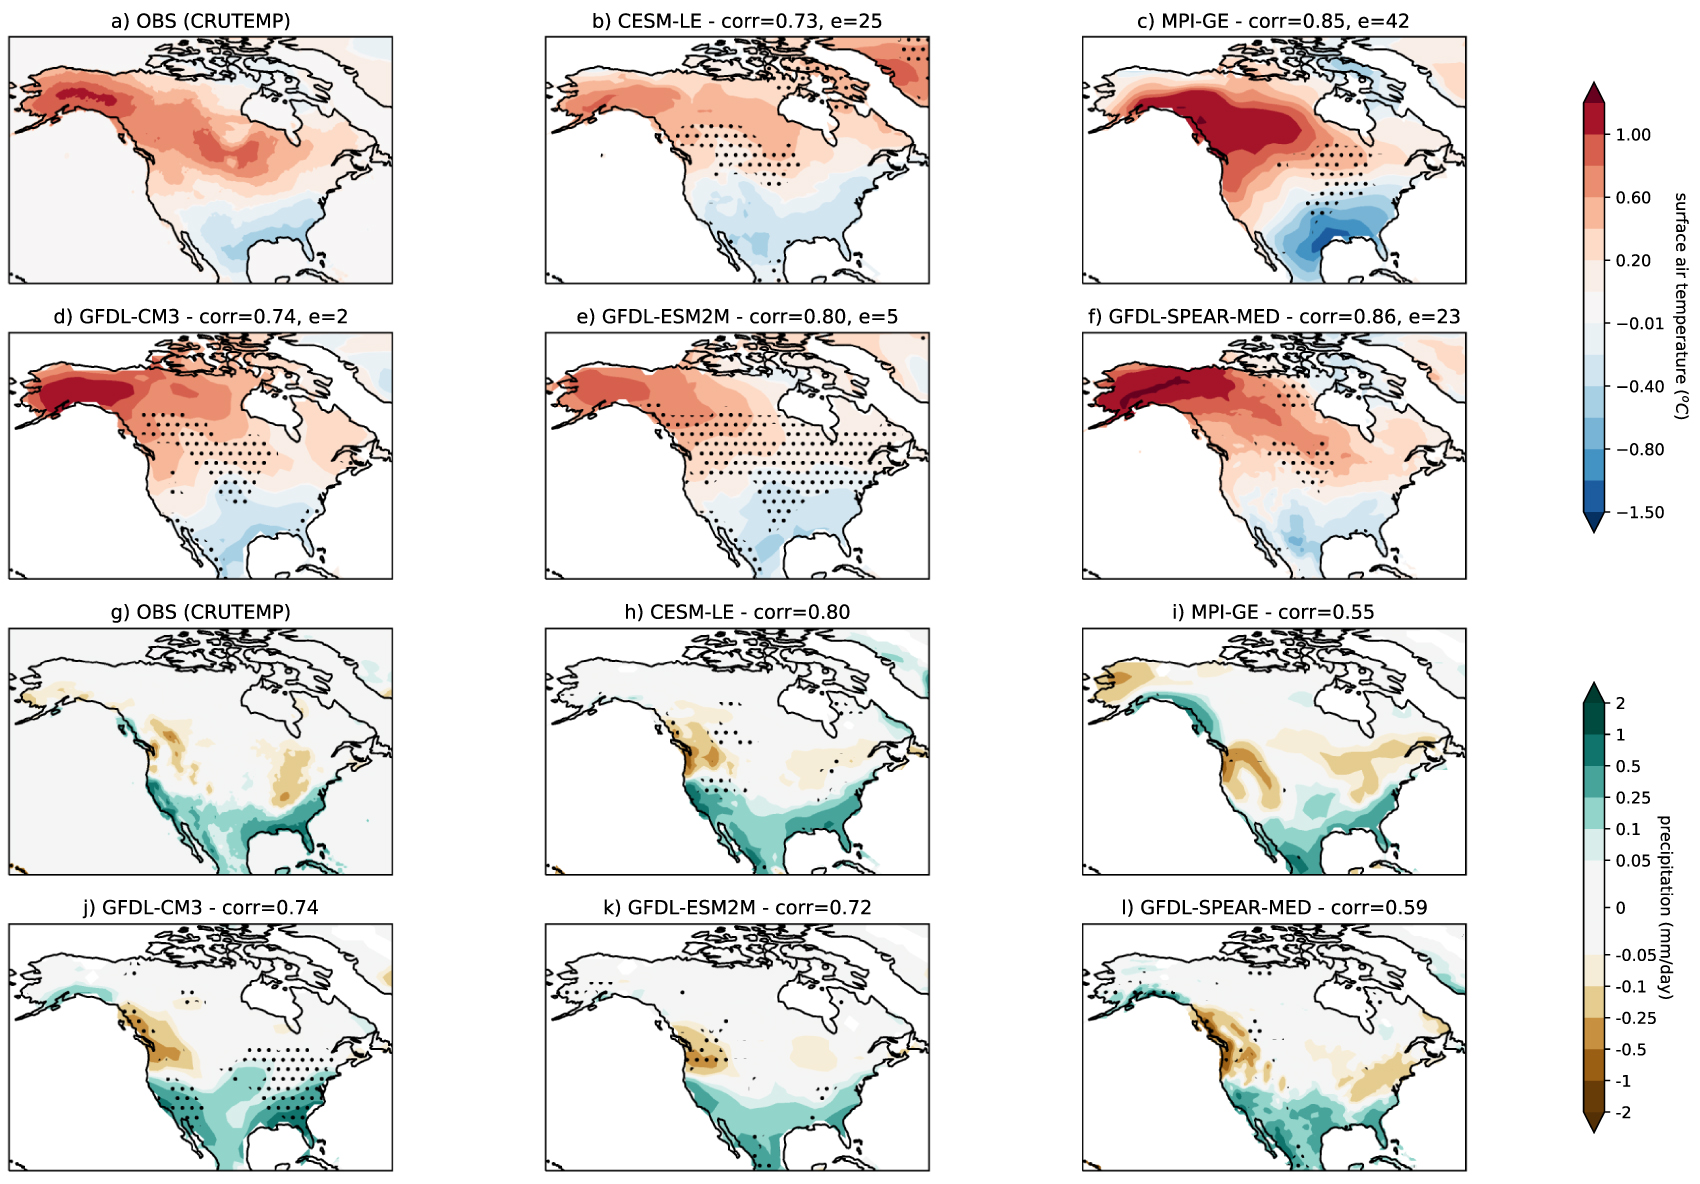
All five models can reproduce observed large-scale patterns of ENSO temperature and precipitation teleconnections (as described by the regression of the Nino3.4 index on each variable; figures 1 and S1). Observations can be thought of as a single realization. As a result, observations are directly comparable to individual ensemble members of a SMILE, not the ensemble mean. As such, we compare the highest correlated ensemble member from each SMILE with the observations although we note that a range of correlations can be found across the ensemble as shown in figure S2. For temperature, the observed pattern consists of warm anomalies over the north-western part of the continent that extend into the center and cold anomalies in the southeast. While this overall pattern occurs in all models, the local features, particularly in the center of the continent differ from observations and across models. For precipitation, the large-scale pattern has wet anomalies in the south, with smaller-scale local anomalies found elsewhere, particularly along the western coastline. These coastline anomalies are more similar to observations when the ensemble member most highly correlated with observations for precipitation is used (figure S1). Overall, the pattern correlations between the observed teleconnections and the highest correlated member of each SMILE are high, with a minimum of 0.73 and a maximum of 0.86 (GFDL-SPEAR-MED) for temperature and a minimum of 0.75 and a maximum of 0.81 (GFDL-SPEAR-MED) for precipitation. We additionally highlight regions where observations are outside the model spread (stippling; figure 1). These regions are generally larger for temperature than precipitation, and cover only small regions for both variables in CESM-LE, MPI-GE and GFDL-SPEAR-MED, with larger regions of disagreement between the model and observations found for precipitation in GFDL-CM3 and temperature in GFDL-ESM2M.
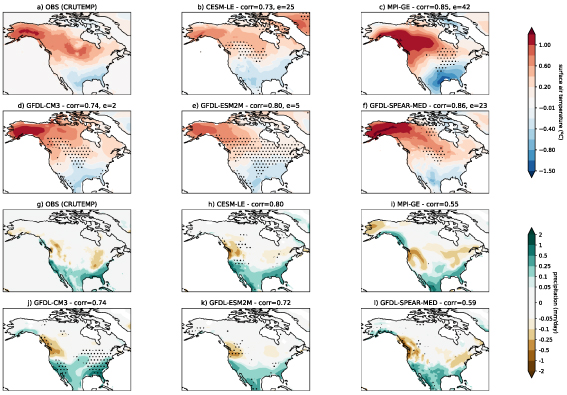
Figure 1. Representation of ENSO teleconnections in observations and five SMILEs. ENSO teleconnections are found by regressing the Nino3.4 index on both surface air temperature (top) and precipitation (bottom) over land. Shown are the teleconnections for observations (a,g; CRUTEMP; Harris et al 2020) and the ensemble member that has the highest correlation of temperature to observations for both variables for CESM-LE (b), (h), MPI-GE (c), (i), GFDL-CM3 (d), (j), GFDL-ESM2M (e), (k), and GFDL-SPEAR-MED (f), (l) over land in the region shown. The correlation coefficient and ensemble member used are shown in the title for each temperature subplot with the correlation for the same ensemble member as for temperature shown in each precipitation subplot. Stippling shows when the observations are outside the ensemble spread. ENSO is described in terms of the Nino3.4 index (5 S–5 N, 120–170 W) averaged over December, January, and February (DJF) for the period 1950–2018. This index is detrended by removing the ensemble mean before use. In this plot, this detrended index is regressed onto the detrended fields. Observations are detrended using a second-order polynomial.
Download figure:
Standard image High-resolution imageThe observed PDO pattern is also well represented in all five models (calculated as in Mantua et al (1997) then 11 year lowpass filtered over December, January, February; figure 2). All SMILEs have high pattern correlations ( 0.85) from the member which is most correlated with observations. Similar to the teleconnections over North America, local differences to observations are found. Temperature anomalies in the tropical Pacific extend too far into the western Pacific, indicating that the models' tendency for an excessive westward extension of the interannual ENSO SST anomalies persists in the decadal range. Most models additionally have a cold bias in the Kuroshio region, with smaller biases found in GFDL-CM3 and GFDL-SPEAR-MED than the other models. Along the western coastline of North America, however, biases are low demonstrating a good representation of the PDO pattern in this region. Overall, the high correlations of both temperature and precipitation teleconnections, and the similarity of the PDO pattern between observations and the models demonstrate that these five SMILEs are suitable for investigating ENSO teleconnections under varying phases of the PDO. We can be confident in the large-scale patterns, but need to be careful when evaluating local features due to the smaller scale differences found between models and observations.
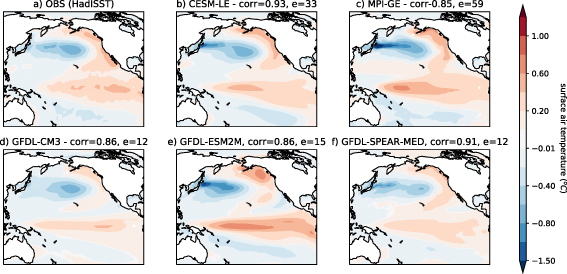
Figure 2. Representation of the PDO in observations and five SMILEs. The highest correlated ensemble member with observations ((a) HadISST; Rayner et al 2003) is shown for CESM-LE (b), MPI-GE (c), GFDL-CM3 (d), GFDL-ESM2M (e), and GFDL-SPEAR-MED (f). The correlation coefficient, as well as the ensemble member, are shown in the titles. The PDO is calculated using the Climate Variability Diagnostics Package for Large Ensembles Version 1.0 (Phillips et al 2020). In this package, the PDO index is defined as the standardized principal component (PC) time series associated with the leading Empirical Orthogonal Function (EOF) of area-weighted monthly SST anomalies over the North Pacific region (20–70 N, 110 E–100 W) minus the global mean (60 N–60 S) following Mantua et al (1997) for the period 1950–2018. For the remainder of the study the ensemble mean is removed before the EOF is calculated, however it is not removed in the comparison with observations shown in this figure. The index is then lowpass filtered (11 years) and averaged over December, January, and February (DJF) to isolate the decadal component of the PDO.
Download figure:
Standard image High-resolution image3. Results
3.1. Does the PDO modulate ENSO teleconnections?
In all five models, the PDO modulates ENSO winter teleconnections over North America. A positive PDO enhances El Niño teleconnections, while a negative PDO diminishes them (shown using composites of events; figure 3). Notably, the positive PDO strengthens warm surface anomalies over north-western Canada and Alaska and amplifies the precipitation signal along the California coastline during El Niño events. In contrast, a negative PDO acts to dampen these teleconnections.
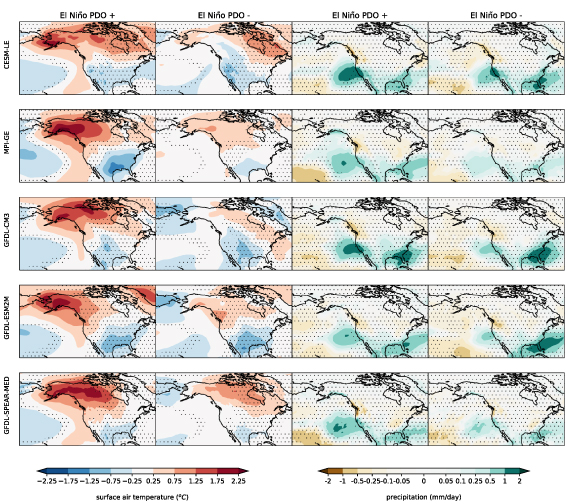
Figure 3. Modulation of El Niño impacts over North America by the PDO. Surface air temperature (left) and precipitation (right) composited in winter (DJF) over the period 1950–2018. Shown for El Niño when the PDO is in a positive phase (first and third columns) and El Niño when the PDO is in a negative phase (second and fourth columns) compared to when both ENSO and the PDO are neutral. Shown for CESM-LE (top row), MPI-GE (second row), GFDL-CM3 (third row), GFDL-ESM2M (fourth row), and GFDL-SPEAR-MED (last row). Stippling indicates where the difference between El Niño in a PDO positive and El Niño in a PDO negative phase is insignificant at the 95% level using a t-test. To create composites of teleconnections for events that occur under different combinations of ENSO and PDO phases we first take the seasonal averages (winter; December, January, February). Each ensemble member is then detrended by removing the ensemble mean for each season. Composites of temperature and precipitation are subsequently created using a threshold of 0.5 for both ENSO and PDO events. All events in the period 1950–2018 (68 years) for all ensemble members (see table 1) are considered. ENSO and the PDO are defined as in figures 1 and 2.
Download figure:
Standard image High-resolution imageWhile all five models agree on the large-scale modulation of ENSO by the PDO, there are local differences (figure 3). Specifically, the magnitude and spatial pattern of the negative PDO dampening of warm El Niño surface anomalies over north-western Canada and Alaska differs among models. Other modulations are unique to individual models. For example, a positive PDO strengthens cool surface anomalies over the south-eastern United States in one model (MPI-GE). In addition, only two models (MPI-GE & GFDL-CM3) have widespread precipitation anomalies along the north western coastline of North America. In these models, wet anomalies over the south coast of Alaska and dry anomalies on the Canadian coastline are strengthened by the positive PDO. Furthermore, the models do not agree on the effect of the PDO modulation of El Niño over Florida. Here, wet anomalies are amplified by a positive PDO in one model (MPI-GE) and diminished in another (GFDL-ESM2M).
The modeled temperature and precipitation teleconnections over North America are largely explained as a linear combination of the influence of the individual impacts of ENSO and the PDO (figures 4 and S3). The addition of the impacts of the individual modes is, however, larger by around  C over Alaska and Canada compared to the co-occurrence in all models except MPI-GE (figure 4). On the other hand, we find minimal differences between the linear combination of the two modes and their co-occurrence for precipitation (figure S3). The PDO, isolated from ENSO, has spatially similar, but slightly weaker teleconnections over North America to ENSO itself. This spatial similarity explains why a positive PDO tends to enhance El Niño teleconnections and diminish La Niña teleconnections. Additionally, corroboration that the impacts over North America are a linear combination of the effects of each individual mode comes from the strong similarity between the results obtained for stronger ENSO events (Niño3.4
  1, figure S4) and all ENSO events. This similarity indicates the absence of nonlinear interactions between the two modes of variability over North America. When considering the tropical Pacific response there are discrepancies between the SMILEs (figure S5). MPI-GE and GFDL-SPEAR-MED demonstrate larger tropical El Niño anomalies during the positive phase of the PDO compared to the negative phase, with the three other models showing anomalies of the opposite sign.
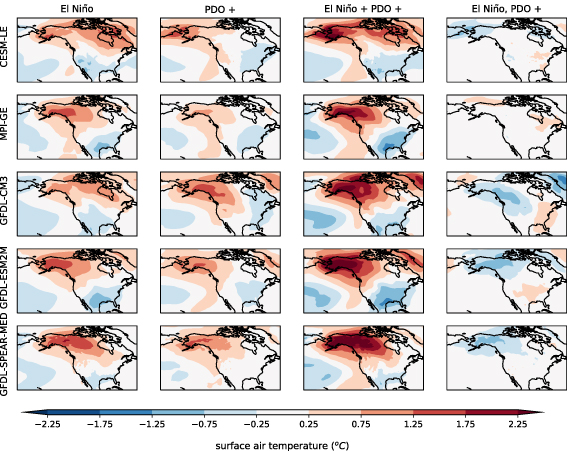
Figure 4. Addition of the surface air temperature teleconnections over North America for both ENSO and the PDO separated from each other. El Niño when the PDO is neutral (left column), positive PDO when ENSO is neutral (second column) and the addition of El Niño when the PDO is neutral and positive PDO when ENSO is neutral (third column) all compared to when both ENSO and the PDO are neutral, and co-occurring El Niño and positive PDO (right column) with the addition shown in the third column subtracted. Shown for CESM-LE (top row), MPI-GE (second row), GFDL-CM3 (third row), GFDL-ESM2M (fourth row), and GFDL-SPEAR-MED (last row). ENSO and the PDO are defined as in figures 1 and 2 and composites are created as in figure 3.
Download figure:
Standard image High-resolution imageFinally, we assess future changes in ENSO, PDO, or their combined teleconnections over North America. We find these future changes are not significant, nor consistent between the models. We use multiple models to assess future projections so that we can examine model agreement. While the models do not project the same sign of change in these teleconnections, there are minimal regions where the changes are significant at the 95% level (figure S6). Given the large inter-event spread it is unlikely that we would observe these changes over the next 50 years, making model changes not likely to occur even where statistically significant.
3.2. Atmospheric mediation of the combined ENSO and PDO impacts
Having found broad model agreement in the pattern of ENSO modulation over North America by the PDO in all five models, we next investigate a single model to identify the atmospheric intermediates behind the described modulations. We choose to focus on GFDL-SPEAR-MED because it has higher atmospheric and land model resolution than the other models used in this study, and also has the highest correlations with observations of ENSO teleconnections and the PDO and minimal regions where observations are outside the ensemble spread (see section 2). The relatively high resolution in GFDL-SPEAR-MED leads to a more realistic representation of orographic and coastline features, which previous studies show are essential to representing precipitation patterns over land (Delworth et al 2020). GFDL-SPEAR-MED is also found to consistently represent the impact of the PDO on North American precipitation as compared to observations (Delworth et al 2020). Indeed, more detailed precipitation features can already be identified in figures 1 and 3. As such, we now further investigate how the atmospheric circulation contributes to the modulation of ENSO by the PDO in GFDL-SPEAR-MED.
When an El Niño occurs during a neutral phase of the PDO, atmospheric circulation anomalies mediate the impacts on the North American land surface during winter (DJF) (figures 5(a), (e), (i) and (m)). The Aleutian low (shown in the sea level pressure fields) deepens, and the Pacific jet (shown using zonal-mean zonal-wind) intensifies and shifts south (Capotondi and Alexander 2010). The deepened Aleutian Low is associated with southerly wind anomalies on its eastern side, which brings warmer air from the lower latitudes over the northwestern part of the North American continent. At the same time, associated with the intensification of the Pacific jet the storm tracks strengthen and shift south. This southern shift of the storm tracks leads to a shift in the precipitation pattern, with enhanced precipitation in the 20–40N band and decreased precipitation around 40–50 N, with precipitation anomalies particularly pronounced near the western and eastern United States coastlines. Broadly opposite anomalies occur for La Niña events when the PDO is neutral (figures S7(a), (e), (i) and (m)).
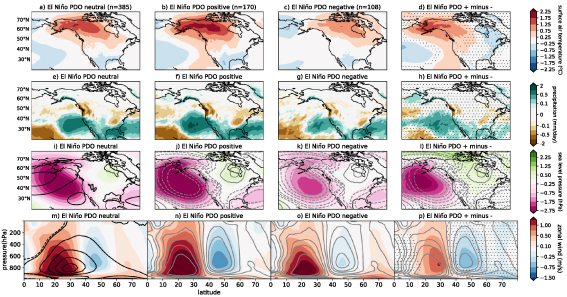
Figure 5. Modulation of El Niño teleconnections over North America by the PDO during winter (DJF). Surface air temperature (top row), precipitation (second row), sea level pressure (third row), and zonal-mean zonal wind (bottom row) composited over the period 1950–2018. Shown for El Niño when the PDO is neutral (first column), El Niño when the PDO is in a positive phase (second column) and El Niño when the PDO is in a negative phase (third column) all compared to when both ENSO and the PDO are neutral, and the difference between El Niño when the PDO is positive and when it is negative (fourth column). Stippling indicates where the difference between El Niño in a PDO positive and El Niño in a PDO negative phase is insignificant at the 95% level using a t-test. Black contours indicate the mean state whereas grey contours show the anomalies for El Niño composites when the PDO is neutral. Results are shown for GFDL-SPEAR-MED. The titles show the number of events in each composite. ENSO and the PDO are defined as in figures 1 and 2 and composites are created as in figure 3.
Download figure:
Standard image High-resolution imageA positive PDO acts to amplify the circulation anomalies during an El Niño resulting in the amplification of temperature and precipitation impacts over North America, with a negative PDO having the opposite effect (figure 5). During a PDO positive phase, El Niño circulation anomalies intensify. Specifically, the Aleutian Low further deepens (figure 5(j)), concurrent with an additional intensification of the Pacific jet between 20 and 30N (figure 5(n)). Associated with the deepening of the Aleutian low, extra warmer air from the lower latitudes moves up over north-western Canada and Alaska and acts to amplify the El Niño warm anomalies. Higher pressure over the continental land surface also contributes to these enhanced warm anomalies. Fewer cold air outbreaks occur over the land surface when the surface pressure is higher. Furthermore, the additional intensification of the Pacific jet brings increased rainfall to the California coastline associated with an increase in the storm tracks. In contrast, when the PDO is negative, El Niño circulation anomalies are weakened, resulting in the opposite effect on both teleconnections (figures 5(c), (g), (k) and (o)). Similarly, the PDO has the opposite effect on the atmospheric circulation during a La Niña compared to the effect on an El Niño event (figure S7). For instance, a negative PDO enhances the anomalous La Niña atmospheric circulation, while a positive PDO diminishes it.
While the modulation of both El Niño and La Niña by the PDO is strongest in winter, these relationships also persist into boreal spring (figures S8 and S9; consistent across all models figure S10). For El Niño (figure S8), the enhanced warm anomalies that occur during the PDO positive phase over north-western Canada and Alaska persist, but are smaller in magnitude than in winter. Similarly, the strengthened wet anomalies off the California coastline remain, but are smaller in magnitude. The Aleutian low and Pacific Jet are still responsible for this modulation. However, both drivers are weaker in this season, leading to the weaker teleconnections found. The effects of the negative PDO and its influence on La Niña teleconnections are also similar to the winter season, but smaller in magnitude. The results described in this section utilize the large sample size of the ensemble to provide statistically robust differences between ENSO events that occur in different phases of the PDO. In the following section, we investigate distributions of surface properties at specific locations for all El Niño events that occur during different phases of the PDO.
3.3. Can we anticipate local impacts by knowing the phase of ENSO and the PDO?
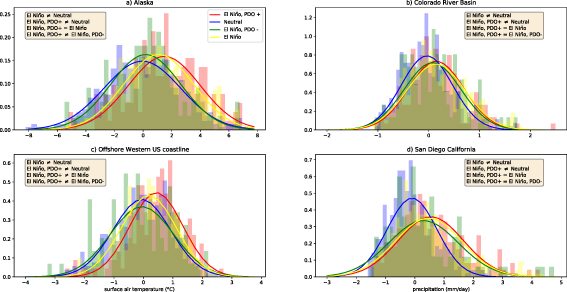
A positive PDO increases the likelihood of warm anomalies during El Niño events in both Alaska and offshore of the western United States during winter in GFDL-SPEAR-MED (shown using a PDFs of events in each region; figures 6(a) and (c)). Indeed, in both regions, the positive shift of the temperature probability distribution functions during El Niño years (PDO neutral) is further enhanced when the PDO is positive, but reduced for negative PDO cases. Specifically, the probability of Alaskan temperature anomalies exceeding 4 ∘C in boreal winter is increased from 14% in an El Niño year to 16% when the PDO is positive, and decreased to 7% when the PDO is negative. In a neutral year, this probability is 6%, which corresponds to more than a doubling of the chance of exceeding a 4 ∘C anomaly for an El Niño when the PDO is positive compared to when it is negative. The region offshore of the western United States is societally important as it hosts a very productive marine ecosystem (Chavez and Messié 2009), and is prone to the occurrence of extreme and devastating warm events, or marine heatwaves, as observed in recent decades (e.g. Capotondi et al 2019). In this region, the chance of a warm temperature anomaly occurring above 2 ∘C during an El Niño is 21%. This probability is increased to 26% when the PDO is positive and decreased to 17% when the PDO is negative. During a neutral year, this chance is 13%. These differences persist into spring, although the probabilities are smaller (figures S11(a) and (c)).
Figure 6. Probability density functions for composites of El Niño events under different phases of the PDO in winter (DJF). (a) Surface air temperature in Alaska, (b) precipitation over the Colorado river basin, (c) surface air temperature offshore of the western coastline of the United States (30 N–55 N 2 grid boxes from the coastline as in Capotondi et al 2019), and (d) precipitation in San Diego, California. Neutral years are shown in blue, El Niño when the PDO is neutral are shown in yellow, El Niño when the PDO is positive are shown in red and El Niño when the PDO is negative is shown in green. Results are shown for GFDL-SPEAR-MED. Text boxes in each panel indicate when the histograms are significantly different at the 95% level using a KS-density test. ENSO and the PDO are defined as in figures 1 and 2 and thresholds used for each index are as in figure 3. Temperature and precipitation are plotted as anomalies created by removing the ensemble mean for each individual winter season. Shapefiles used to plot Alaska and the Colorado River Basin are shown in figure S13. San Diego is taken as the grid point located at 32.75 N and 243.5 E.
Download figure:
Standard image High-resolution image
Although El Niño itself increases the probability of wet anomalies over both San Diego and the Colorado River Basin, the PDO does not have any strong effect in winter (figures 6(b) and (d)). However, the PDO does affect the precipitation anomalies in both locations in spring (figures S11(b) and (d)). We first consider the Colorado River Basin as it is an important economic water source. We additionally consider San Diego as it is located on the California coastline, where we have already identified a strong influence of ENSO and the PDO. In spring over the Colorado River Basin, the chance of precipitation anomalies occurring above 1 mm d−1 is 1.5% for neutral years and 4% for El Niño years. This probability is increased to 9% when the PDO is positive and decreased to 3% when it is negative. For San Diego, these numbers are 4% during neutral years and 10% during El Niños. This probability is again increased when the PDO is positive (14%) and decreased when the PDO is negative (5%), which corresponds to a tripling of the likelihood for both regions of exceeding 1 mm d−1 for El Niños that occur when the PDO is positive compared to those that occur when it is negative.
ENSO and the PDO can be used to evaluate the likelihood of temperature and precipitation anomalies occurring, but cannot be used to predict these anomalies for individual events due to high inter-event variability (figure 6). This effect is clearly seen when considering El Niño years compared to neutral years in San Diego (figure 6(d)). In San Diego, there is a higher probability of larger wet anomalies occurring during an El Niño year. However, although the likelihood of these wet anomalies occurring is increased, dry anomalies could also occur in any given El Niño year due to high inter-event variability. This inter-event variability highlights the fact that the phase of ENSO and the PDO cannot be used to predict anomalies for individual events, although they can be used to evaluate the likelihood of specific anomalies occurring.
While the two phases of the PDO have opposing effects on ENSO events, the probability of an El Niño occurring during a positive PDO is higher than during a negative PDO (figure S12). In contrast, the probability of a La Niña occurring during a negative PDO is higher than during a positive phase (figure S12). This result highlights that the PDO is more likely to act to amplify ENSO events than diminish them. Strong El Niños (Niño3.4  1, figure S4; see numbers of events in titles) show the same effect i.e. they are also more likely to occur in a positive phase of the PDO than a negative PDO, meaning strong ENSO events are also more likely to be amplified than diminished by the PDO in agreement with previous studies (e.g. An and Wang 2000, Capotondi and Sardeshmukh 2017).
4. Discussion and conclusions
The main finding from this multi-model SMILE study is that a positive PDO acts to amplify El Niño and diminish La Niña teleconnections over North America, while a negative PDO has the opposite effect. This influence occurs in winter and persists into spring. Previous work using observations demonstrated that the PDO acts to modify ENSO teleconnections over North America (e.g. Gershunov and Barnett 1998, McCabe and Dettinger 1999), however, due to the short observational record it was not possible to make a statistically robust comparison between different sets of events. By using SMILEs to make such a comparison, we find that the largest modulation occurs for temperature over Alaska and Canada and precipitation over California. Our work builds on Dong et al (2018), who make similar conclusions, by focusing specifically on North America and demonstrating that these results are robust across multiple fully coupled climate models. While Dong et al (2018) forced their atmospheric model with fixed SST patterns for 50 years, we show that the amplification and diminishment of ENSO teleconnections by the PDO hold for a realistic model configuration where ENSO events occur with a variety of patterns, amplitudes, and durations.
Atmospheric circulation anomalies are found to mediate the modulation of ENSO by the PDO. Specifically, Aleutian low and Pacific jet anomalies associated with an El Niño are enhanced by a positive PDO and weakened by a negative PDO. This result is consistent with the results of Dong and Dai (2015), who show that Pacific Decadal Variability (measured using the IPO) influences North America via the atmospheric circulation in the North Pacific. Dong et al (2018) argue that this direct mechanism results in a symmetric modulation of ENSO teleconnections by the opposing phases of Pacific Decadal Variability. Our results agree with this statement, where the negative PDO has a very similar, but opposite effect on ENSO teleconnections to the positive PDO in North America. We note that the relationship between the PDO and the Aleutian low is not unidirectional with each influencing the other (Newman et al 2016). Further experiments with specified SSTs, such as those discussed in Deser et al (2017) are needed to separate the influence of each component on the other.
The models do not agree on or show significant future changes in the impacts of either the PDO, ENSO, or their combination over North America. This result differs from previous work. While previous studies projected contrasting changes in this region (Fuentes-Franco et al 2016, Xu and Hu 2018) we more robustly identify the forced response in each individual model due to the much larger sample size enabled by the use of SMILEs. Indeed, this work suggests differences between previous studies may have occurred due to insufficient sampling.
More generally, we find that the modulation of ENSO temperature and precipitation teleconnections over North America by the PDO can be described as a simple combination of the effect of the individual modes. This result agrees well with Rao et al (2019) who suggest a linear interference of the impacts of the two modes is likely. We find both that the impacts of an individual El Niño are likely to be larger during a positive PDO and that the probability of an El Niño occurring during a positive PDO is larger than during a negative PDO. The opposite is true for La Niña—higher probabilities occur during a negative PDO than in a positive mode. This agrees well with results for CMIP5 models (Rao et al 2019), although other studies note that this may be artifact due to the construction of ENSO and PDO indexes that are not independent (Feng and Tung 2020). Regardless, if we consider the observed world and imagine we know the current phase of the PDO, this ultimately means that the PDO is more likely to amplify ENSO teleconnections than diminish them, revealing larger ENSO impacts than would occur alone. Our results suggest that when the PDO is positive the likelihood of an El Niño occurring is higher and its impacts are additionally amplified, with the same result for a negative PDO and La Niña. This information can be useful for planning for the impacts of ENSO events during different phases of the PDO.
Previous work indicates that central Pacific El Niño events are more likely to occur during the negative PDO phase, with eastern Pacific El Niños more likely during a positive PDO (Newman et al 2016). While all five SMILEs agree on how the North Pacific anomalies differ between El Niño events during a positive compared to a negative PDO, we find model differences in the tropical Pacific El Niño SST patterns. Based on conditions during recent decadal epochs, El Niño events are expected to be stronger during positive PDO phases and weaker during negative PDO phases associated with the increased likelihood of weaker central Pacific events occurring during the negative PDO phase (e.g. An and Wang 2000, Capotondi and Sardeshmukh 2017). This is consistent with the tropical SST differences found in MPI-GE and GFDL-SPEAR-MED. The other SMILES, however, show larger tropical SST anomalies during negative phases of the PDO. This result may be due to the PDO-related tropical wind anomalies in these models, which may affect the oceanic background conditions and hence ENSO characteristics (Fedorov and Philander 2000). Further work is needed to rectify these differences and investigate the influence of different types of El Niño on North America such as in Jia and Ge (2017), although we note that such work is limited by the models' representation of ENSO diversity (Capotondi et al 2020).
An important advantage of the SMILE approach used in this study is that we can create distributions of all ENSO events that occur during different phases of the PDO. These distributions establish the probability of measuring impacts and help with risk assessment. Specifically, these distributions reveal, for example, that in spring the PDO can affect the probabilities of ENSO-related precipitation in San Diego, California. A negative Pacific Decadal Variability trend (as recently observed; 1979–2019 (Dong et al 2021)) decreases the likelihood of extreme El Niño precipitation and increases the likelihood of extreme dry events associated with La Niñas. This result is consistent with the conclusion that the recent negative phase of Pacific Decadal Variability has aided the California drought (Dong et al 2021). Indeed recent work has demonstrated the importance of SST in making a skilful prediction of the 2012 United States drought (Kam et al 2021). Overall, we leverage the large size of SMILEs to show that ENSO and the PDO affect the probabilities of extreme seasons occurring. This highlights the value of SMILEs and these modes of variability for assessing predictability over North America, although the conclusion that ENSO and the PDO are not deterministic predictors of either temperature or precipitation teleconnections shows that they are not the only processes of importance for impacts in this region.
Acknowledgments
A C was supported by the NOAA Climate Program Office Climate Variability and Predictability Program. J E K was funded by NSF AGS 1554659. N M was partially funded by NSF AGS 1554659 in part by the CIRES Visiting Fellows Program and the NOAA Cooperative Agreement with CIRES, NA17OAR4320101. We acknowledge high-performance computing support through a University Allocation to NCAR's Computational and Information Systems Laboratory, sponsored by the National Science Foundation. We thank the US National Science Foundation, National Oceanic and Atmospheric Administration, National Aeronautics and Space Administration, and Department of Energy for sponsoring the activities of the US CLIVAR Working Group on Large Ensembles.
Data availability statement
The data that support the findings of this study are openly available at the following locations (see table 1 for the references for each large ensemble dataset):
- MPI-GE https://esgf-data.dkrz.de/projects/mpi-ge/
- GFDL-SPEAR-MED www.gfdl.noaa.gov/spear_large_ensembles/
- All other large ensembles www.cesm.ucar.edu/projects/community-projects/MMLEA/
- CRU TS v4 https://crudata.uea.ac.uk/cru/data/hrg/
- CVDP-LE www.cesm.ucar.edu/working_groups/CVC/cvdp-le/.
Supplementary data (48. MB PDF)