

Abstract
Prior mortality estimates of air pollution from coal-fired power plants in India use PM2.5 exposure-response functions from settings that may not be representative, and do not include other potentially harmful effects of these plants, such as fly ash pollution and heavy freshwater consumption. We use a national, district level dataset to assess the impact of coal-fired power plants on all-cause mortality (15–69 years) in 2014. We compare districts with coal-fired power plants (total capacity >1000 MW) to districts without a coal-fired power plant, estimating the effect of these power plants on all-cause mortality within districts that have these plants. Out of 597 districts in India in 2014, 60 districts had a coal-fired power plant. When compared to districts without a coal-fired power plant, districts with a coal-fired power plant (>1000 MW) had higher rates of age-standardized mortality in both women (0.38, 95% CI: −0.14–0.90) and men (0.55, −0.17–1.27). Similarly, these districts had higher rates of conditional probability of premature death in both women (2.22, −0.13–4.56) and men (2.12, −0.54–4.77). The point estimates for total excess deaths were 19 320 for women and 27 727 for men. In affected districts, the proportion of premature adult deaths attributable to coal-fired power plants was 5.8% (−0.3%–11.9%) in women and 4.3% (−1.1%–9.6%) in men. We estimate that ∼47 000 premature adult deaths can be attributed to large coal-fired power plants in India in 2014. These deaths are concentrated in the ∼10% of districts that have the nation's power plants, where they are associated with 1 out of 20 premature adult deaths. Effective regulation of emissions from these plants, coupled with a phaseout of coal-fired power plants, can help decrease this burden of inequitable and premature adult mortality.
Export citation and abstract BibTeX RIS

Original content from this work may be used under the terms of the Creative Commons Attribution 4.0 license. Any further distribution of this work must maintain attribution to the author(s) and the title of the work, journal citation and DOI.
1. Introduction
Coal powered the industrial revolution. It remained the principal energy source globally until 1960, after which it was displaced by oil [1]. Since then, coal has been on a steady decline in North America and Europe [2]. While coal was once a diverse energy supplier (used in heating, cooking, and railways), its principal use now is in the production of electricity. As coal use has steadily declined in North America and Europe, its use has increased significantly in China and India, particularly since the 1980s. Currently, India is the second largest consumer of coal globally, with 94% of India's coal consumption located in the electricity sector [2].
The use of coal has been estimated to result in up to 112 000 deaths annually in India [3]. Mortality estimates from coal-fired power plants in this study are modelled using the PM2.5 exposure-response function from the 2019 Global Burden of Disease (GBD) project [4]. However, there are several limitations to this approach. First, it assumes that all deaths related to coal-fired power plants occur via PM2.5. Coal-fired power plants account for 70% of industrial freshwater use in India. Nearly half of these plants are in water-stressed districts [5]. Therefore, it is plausible that these power plants result in mortality through exacerbating freshwater shortages. In addition, coal fly ash pollution is rampant in India, with multiple incidents of ash pond collapse, discharge of coal fly ash into water bodies, and air pollution from ash ponds [6]. However, the potential mortality effects of this pollution is not accounted for in PM2.5 exposure-response functions. Second, most of the air pollution epidemiological studies informing the PM2.5 exposure-response function in GBD have been performed in low-pollution settings in high-income countries [4]. Estimates at high PM2.5 levels are few, and originate from China and studies of household air pollution, which may not be representative of PM2.5 pollution from coal-fired power plants in India.
Given the wide range of pollution effects from these plants, evaluating the effect of coal-fired power plants on all-cause mortality, rather than through disease-specific associations (some of which may be unknown), may yield less biased estimates of its health impacts. For instance, the GBD PM2.5 exposure-response function considers five specific causes of death. However, pooled estimates of the association between PM2.5 and all-cause mortality show mortality estimates that are 30% higher than GBD estimates, suggesting that PM2.5 exposure may be related to additional causes of death than the diseases considered by the GBD [7]. Therefore, there are multiple potential advantages to directly assessing the relationship between coal-fired power plants and all-cause mortality, to assess their overall health impact. In addition, these health impacts are likely distributed regionally, with individuals living closer to the plant more affected than those living further from the plant. We therefore hypothesized that districts with a coal-fired power plant would have higher levels of all-cause mortality, and use a national, district level dataset to assess the mortality impacts of coal-fired power plants.
2. Methods
2.1. Data sources
Based on the 2011 census, we derived estimates for 640 districts in India. District populations, age-standardized death rates (per 1000 population), and conditional probabilities of premature death (%) in 2014 between the age of 15 and 69 years were obtained from Ram et al [8]. Separate estimates were derived for women and men, and all estimates were based on nationally representative surveys. Conditional probability of premature death estimates the probability (as a %) that an individual aged 15 years would die before reaching the age of 70 years [8]. Ram et al classified the 12 smaller Indian states and union territories (containing 39 districts) as single districts themselves. As a result, the district count we included in our study was reduced from 640 to 597 total districts, to align with the mortality data we obtained from Ram et al. Further details of the methodology for the mortality data are available from Ram et al [8]. We obtained data on the female literacy rate, the female work participation rate, and the percentage of urban population of the districts from the 2011 Indian Census [8]. We also obtained data on household amenities from the 2011 Indian Census, including the use of polluting cooking fuels, access to a treated water source as the main source of potable water, and the use of electricity for lighting purposes [8].
Data on coal-fired power plants were obtained from the Global Energy Monitor database and included the district in which the plant was located, thermal power capacity (MW), and CO2 emissions (MT yr−1) [9]. The year the largest plant opened, and the type of fuel and technology used by the largest plant in each district were also obtained from the Global Energy Monitor database [9]. The data on power plants was for plants operational in 2014, to match the mortality data.
Lastly, we obtained the districts' annual fine particulate matter (PM2.5) concentrations from a global database distributed by Dalhousie University, which estimated PM2.5 concentrations by applying Geographically Weighted Regression to data from satellites, models, and monitors [10].
2.2. Statistical analysis
We estimated the mortality effects of exposure to a district with a coal-fired power plant using a linear regression model, with district level age-standardized death rates as the outcome measure. Separate models were used for men and women. Given that some districts had captive power plants with a low total installed capacity, we defined coal-fired power plant districts as districts with a total installed capacity of >1000 MW. We adjusted for a variety of socio-economic variables that could confound our exposure-outcome association, including the percentage of district population that is urban, the percentage of literate women in the district, the total population of men and women in the district, the percentage of women in the district who work, the proportion of households in the district using polluting cooking fuels, the proportion having access to a treated water source as the main source of potable water, and the proportion using electricity for lighting purposes. We modelled the conditional probability of death for both men and women, and the contribution of coal-fired power plants to PM2.5 levels, using the same approach.
Scatterplots were used to visualize the relationship between age-standardized death rates and total thermal power plant capacity in the district. Pearson correlation coefficients were used to measure the strengths of correlation. We estimated the number of premature deaths attributable to coal-fired power plants, using the coefficient of age-standardized death rates from the regression model and total population living in districts containing coal-fired power plants. Within districts containing coal-fired power plants, we also estimated the proportion of premature deaths attributable to those plants, using the coefficient of conditional probability of death from the regression model and the mean conditional probability of death in those districts. All estimates were made separately for men and women.
All analyses were performed using R software v3.5.2 and STATA 16.1 with a two-way significance level of <0.05.
2.3. Role of the funding source
There was no funding associated with the study.
3. Results
Baseline characteristics of districts, categorized by coal-fired power plant capacity, is shown in table 1. There were 60 districts with coal-fired power plant capacity >1000 MW (∼10% of the total districts in the country), representing 88% of India's installed coal-fired power plant capacity in 2014. While 73% of women (and 72% of men) lived in districts without a coal-fired power plant, 13% of women (and 12% of men) lived in districts with coal-fired power plant capacity >1000 MW.
Table 1. Baseline characteristics of districts, categorized by coal-fired power plant capacity.
| Districts without a coal-fired power plant (N = 476) | Districts with coal-fired power plants (total capacity <1000 MW) (N = 61) | Districts with coal-fired power plants (total capacity >1000 MW) (N = 60) | |
|---|---|---|---|
| Population of women | 614 542 ± 452 325 | 1061 396 ± 878 940 | 847 358 ± 548 356 |
| Population of women in total (row %) | 292 521 992 (73.1%) | 64 745 156 (16.2%) | 50 841 480 (12.7%) |
| Population of men | 640 129 ± 474 195 | 1134 959 ± 968 938 | 840 204 ± 508 923 |
| Population of men in total (row %) | 304 701 404 (71.9%) | 69 232 499 (16.3%) | 50 412 240 (11.8%) |
| Age-standardized death rate (per 1000 population, women) | 6.21 ± 2.29 | 5.48 ± 1.65 | 6.17 ± 1.99 |
| Age-standardized death rate (per 1000 population, men) | 8.91 ± 2.83 | 7.87 ± 2.67 | 9.12 ± 2.77 |
| Conditional probability of death (%, women) | 37.9 ± 10.2 | 34.9 ± 8.2 | 38.4 ± 9.5 |
| Conditional probability of death (%, men) | 48.6 ± 10.5 | 44.5 ± 10.1 | 49.5 ± 10.2 |
| Percentage of district population-urban | 25.8 ± 21.8 | 38.1 ± 26.0 | 32.6 ± 19.5 |
| Percentage of district women-literate | 54.2 ± 12.9 | 57.1 ± 12.2 | 55.8 ± 10.0 |
| Percentage of district women who work | 16.4 ± 9.4 | 14.0 ± 8.1 | 17.2 ± 8.5 |
| Percentage of district households using polluting cooking fuels | 74.4 ± 19.8 | 68.9 ± 22.4 | 73.6 ± 16.9 |
| Percentage of district households using treated drinking water | 29.2 ± 46.7 | 34.3 ± 24.2 | 30.7 ± 20.5 |
| Percentage of district households using electricity for lighting | 64.1 ± 29.5 | 68.5 ± 26.9 | 71.0 ± 23.7 |
| Annual district PM2.5 level | 49.8 ± 23.6 | 54.7 ± 19.8 | 49.1 ± 17.0 |
| Number of coal-fired power plants in district | NA | 1 .3± 0.8 | 2.9 ± 2.4 |
| Total coal-fired power capacity in district (MW) | NA | 331 ± 274 | 2501 ± 1994 |
| Total coal-fired power capacity in all districts (MW) | NA | 20 211 ± 2136 | 150 053 ± 15 444 |
| CO2 emissions from coal-fired power plants in district (million tonnes yr−1) | NA | 1 .7 ± 1.4 | 11.7 ± 9.0 |
| CO2 emissions from coal-fired power plants in all districts (million tonnes yr−1) | NA | 102 .0 ± 10.6 | 699.4 ± 69.5 |
| Year that largest plant in the district opened | NA | 1997 ± 18 | 1996 ± 15 |
| Type of fuel in largest plant of district | |||
| Lignite | NA | 1 (1.6%) | 3 (5%) |
| Sub-bituminous | NA | 4 (6.6%) | 6 (10%) |
| Bituminous | NA | 21 (34.4%) | 34 (56.7%) |
| Unknown | NA | 35 (57.4%) | 17 (28.3%) |
| Technology of largest plant in district | |||
| Subcritical | NA | 58 (95%) | 51 (85%) |
| Supercritical | NA | 3 (5%) | 9 (15%) |
| Ultra-supercritical | NA | 0 | 0 |
Continuous variables are presented as mean ± standard deviation (SD), while categorical variables are presented as counts (column percentage). MW = megaWatt.
Districts without a coal-fired power plant were more rural and had fewer households using electricity for lighting, compared to districts with coal-fired power plants. Districts with coal-fired power plant capacity of 1–1000 MW were more urban, used less polluting cooking fuels, and had more households using treated drinking water, compared to districts with no coal-fired power plants and districts with coal-fired power plant capacity of >1000 MW.
The most common type of coal used was bituminous (56.7%), followed by sub-bituminous (10%), though for a large number of plants (28.3%), the coal used was unknown. A large majority of plants used subcritical technology (85%), with a smaller number using supercritical technology (15%) and none using ultra-supercritical technology. Total CO2 emissions from all coal-fired power plants in India was 801.4 million tonnes in 2014, which represented 29% of India's total greenhouse gas (GHG) emissions at the time (2.74 billion tonnes) [9, 10].
Figure 1 shows a map of India highlighting districts with a coal fired power plant. A full list of these districts is provided in the appendix.
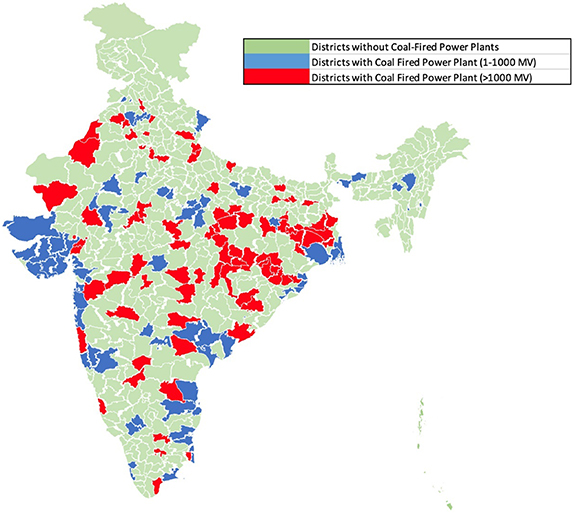
Figure 1. Map of India showing districts with a coal fired power plant, with total installed capacity between 1 and 1000 MW (blue) and >1000 MW (red).
Download figure:
Standard image High-resolution imageFigure 2 shows a linear fitted plot of age-standardized mortality rates (women and men) and coal-fired power plant capacity, by district. There is a direct relationship between mortality rates and coal-fired power plant capacity, slightly stronger for women (ρ = 0.17, p = 0.06) than men (ρ = 0.08, p = 0.40).
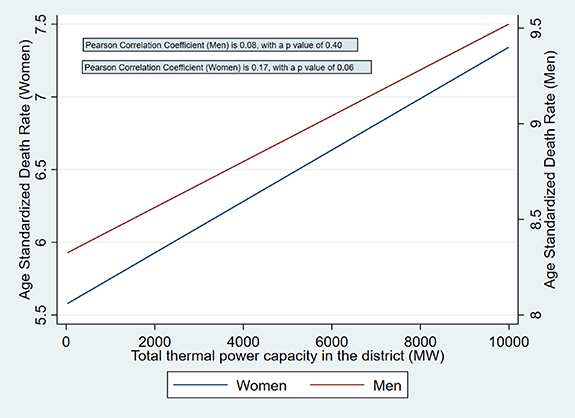
Figure 2. Linear fitted plot of age-standardized mortality rates (women and men) and coal-fired power plant capacity, by district.
Download figure:
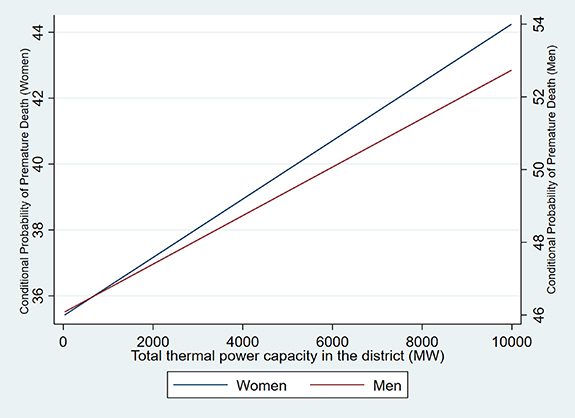
Standard image High-resolution imageFigure 3 shows a linear fitted plot of conditional probability of premature death (women and men) and coal-fired power plant capacity, by district. There is again a direct relationship between the two variables, slightly stronger for women (ρ = 0.18, p = 0.05) than men (ρ = 0.11, p = 0.21).
Figure 3. Linear fitted plot of conditional probability of premature death (women and men) and coal-fired power plant capacity, by district.
Download figure:
Standard image High-resolution image
Table 2 shows that when compared to districts without a coal-fired power plant, districts with coal-fired power plant(s) (>1000 MW) had higher rates of age-standardized mortality in both men and women, and a higher conditional probability of premature death in both men and women. The mortality estimates were wide and included a null estimate. For total excess deaths, the point estimate was 19 320 for women and 27 727 for men, resulting in total deaths of 47 047. However, the confidence intervals were wide, and included a range of total deaths from −15 688 to 109 781 deaths. As a sensitivity analysis, model 2 included districts with coal-fired power plant capacity between 1 and 1000 MW in the comparison group. The estimates from model 1 and model 2 were similar. In districts with a coal fired power plant (>1000 MW), proportion of premature adult deaths attributable to those plants was 5.8% (−0.3%–11.9%) for women and 4.3% (−1.1%–9.6%) for men.
Table 2. Effect of coal-fired power plants on mortality rates, probability of premature death, and total deaths.
| Variable | Model 1 coefficient (95% CI, p value) | Excess deaths (total) | Model 2 coefficient (95% CI, p value) | Excess deaths (total) |
|---|---|---|---|---|
| Age-standardized mortality rate (women) | 0.38 (−0.14–0.90, 0.16) | 19 320 (−7118–45 758) | 0.39 (−0.13–0.91, 0.14) | 19 828 (−6610–46 266) |
| Age-standardized mortality rate (men) | 0.55 (−0.17–1.27, 0.13) | 27 727 (−8570–64 023) | 0.58 (−0.13–1.29, 0.11) | 29 239 (−6554–65 032) |
| Conditional probability of premature death (women) | 2.22 (−0.13–4.56, 0.06) | NA | 2.28 (−0.05–4.61, 0.06) | NA |
| Conditional probability of premature death (men) | 2.12 (−0.54–4.77, 0.12) | NA | 2.28 (−0.35–4.91, 0.09) | NA |
Model 1- comparison group includes districts with no installed coal-fired power plants, while the exposed group includes districts with coal-fired power plant capacity of >1000 MW.Model 2- comparison group includes districts with no installed coal-fired power plants and districts with coal-fired power plant capacity of 1–1000 MW, while the exposed group includes districts with coal-fired power plant capacity of >1000 MW.Both models were adjusted for percentage of district population that is urban, percentage of women in the district who are literate, total population of men and women in the district, percentage of females in the district who work, proportion of households in the district using polluting cooking fuels, proportion having access to a treated water source as the main source of potable water, and proportion using electricity for lighting purposes.
Compared to districts without a coal-fired power plant, districts with a coal-fired power plant (>1000 MW) had higher PM2.5 levels (point estimate), though a null effect could not be excluded (1.80, −3.0–6.60, p value 0.46). Using this point estimate, 3.7% (95% CI, −6.1%–13.4%) of PM2.5 in districts with a coal-fired power plant can be attributed to the presence of the plants.
In 2020, installed coal-fired power plant capacity increased from 170 GW in 2014 to 229 GW, an increase of 34.7%. Similarly, annual CO2 emissions from all coal-fired power plants increased to 1022.7 million tonnes, an increase of 27.6%. This represented 35% of India's total GHG emissions of 2.92 billion tonnes in 2020 [10].
4. Discussion
Our study has two important findings. First, we show that ∼47 000 premature adult deaths in India can be attributed to large coal-fired power plants in 2014. Second, the distribution of these deaths is highly inequitable, being concentrated in ∼10% of districts that have the country's coal-fired power plants. In these districts, around 6% of premature adult deaths in women and 4% of premature adult deaths in men could be attributed to the presence of coal-fired power plants.
Our estimates of mortality differ slightly from previous studies, in large part due to differences in estimand. ∼112 000 annual deaths were attributed to coal-fired power plants operating in 2018 and planned out to 2030 [3]. The installed capacity in 2018 was 208 GW, with installed and planned capacity until 2030 being 300 GW, 76% higher than installed capacity in 2014. In addition, these were estimates of total mortality, while our estimand was restricted to premature adult mortality (15–69 years). These two key differences likely explain most of the difference in our estimates.
An earlier estimate, using installed coal-fired power plant capacity from 2011 (121 GW), estimated 80 000 to 115 000 premature deaths in India [11]. For mortality in this study, the relationship between mortality and PM2.5 was defined as 3.9% change in mortality per 4 μg m−3 change in PM2.5 concentration. This function was based on a study of 53 814 men in the US trucking industry [12]. Given that concentration-response curves of PM2.5 and mortality tends to plateau at higher levels of PM2.5, such an approach will likely lead to overestimation of deaths, given higher PM2.5 levels in India, compared to the US [13]. In addition, there are several untested assumptions in extrapolating associations from a population of male truckers in the US to the entire population of India.
We found a slightly stronger relationship between mortality and coal-fired power plant capacity for women, compared to men. Given that our sample size is relatively small (due to the fixed number of districts in India), sub-group analysis has limited power, and differences seen between men and women must be interpreted with caution. However, our findings are consistent with global estimates of the relationship between outdoor air pollution and major cardiovascular events, which also show a slightly stronger relationship for women, compared to men [14]. Future studies should investigate further if there are significant differences in the relationship between pollution and mortality in women, compared to men.
In 2022, coal-fired power plants make up 51% of India's installed power capacity [15]. Many of these plants are old, with lax regulation of emissions. In 2014, which is the year of analysis in the current study, there were no emission standards for SO2, NO2, and mercury emissions from coal-fired power plants in India, in contrast to other large consumers of coal such as China and the US. While there were standards for PM, the allowed limits were >10 times the limit in China and the US [11]. In December 2015, India issued new regulations governing SOX , NOX and mercury emissions from thermal power plants and strengthened regulations for PM emissions, in line with international standards. Implementing these regulations would involve installing pollution control equipment such as flue-gas desulfurization units or scrubbers for SO2 and selective catalytic reduction for NOX , which would lead to an estimated reduction in SOX emissions by 95%, NOX by 87% and PM by 83% [16]. Installing Pollution Control Technologies (PCT) is expected to cost 5–10 million Indian Rupees/MW of installed capacity, or an industry wide cost of 2500 billion Indian Rupees (∼32 Billion US dollars). It has been shown that the health benefits of PCT installation outweigh the costs, when calculated out to 2030, even though health benefits will continue to accrue beyond 2030 [16]. However, implementation of the 2015 regulations has been repeatedly delayed, with deadlines being pushed back and norms diluted to accommodate coal-fired power plants, many of which are private companies [17, 18]. Currently, installation of PCT is negligible in coal-fired power plants in India [16].
However, even with the implementation of these regulations, other challenges related to coal-fired power plants such as heavy freshwater use, fly-ash pollution and GHG emissions will persist. A phasedown of coal-fired power plants, as agreed during the 26th United Nations Climate Change Conference (COP26) in Glasgow, is therefore essential for planetary health, with the ultimate goal being complete phaseout of coal [19]. Renewables (solar, wind, biomass, small hydro and waste to energy) currently account for 27.5% of India's installed electricity capacity (110 GW), rising from 12.3% in 2012. However, given the intermittency of most renewable sources of electricity, expansion of non-intermittent sources of electricity such as hydro and nuclear remain essential to achieving the elimination of fossil fuels from the electricity sector. While hydroelectric power has increased steadily, it has significant (and inequitable) social, health and environmental consequences [20]. In contrast, installed nuclear capacity has stagnated since 2017 at 6780 MW, though nuclear power plants with an additional capacity of 8700 MW are under construction and a further 31 000 MW are being planned [15, 21, 22]. Expanding nuclear power is essential to achieving global net zero emissions by 2050, and per estimates from the International Energy Agency, the world is currently not on track to meet nuclear power targets [23]. Given that phasedown of coal-fired power plants in India can be achieved in part by increase in nuclear power plants, highlighting the health benefits of this substitution is important. Our study shows that a district with a coal-fired power plant capacity >1000 MW has a mean of 783 excess premature adult deaths annually. This estimate will vary by total installed coal power capacity, with larger excess deaths in districts with large installed capacity. This estimate agrees well with a published estimate of 1300 deaths in 2020 from the Chandrapur Super Thermal Power Station, which has an installed capacity of 3340 MW [24]. In comparison, deaths from modern nuclear power plants are close to zero, suggesting there are significant potential public health benefits of switching from coal-fired electricity to nuclear energy [25].
Our study has several strengths. First, we calculate the mortality impact of coal-fired power plants using a novel approach, making no assumptions about the mediators (such as PM2.5) of the relationship between coal-fired power plants and mortality. This allows us to include the effect of other potential mediators, such as fly ash pollution, high freshwater use and industrial accidents [26]. Our approach also does not make any assumptions about the diseases by which coal-fired power plants mediate all-cause mortality, allowing for a more direct impact assessment. However, a limitation of this approach is that we are unable to disaggregate mortality estimates by pollution pathways or individual diseases. Second, we use a Pan-India dataset with robust district level estimates of mortality, allowing us to highlight the inequitable nature of these premature deaths. Our approach also has several limitations. Given that the size and resolution of the dataset is inherently limited by the number and location of coal-fired power plants, our estimates are wide and do not exclude a null estimate. Second, our approach assumes that the mortality impact of a coal-fired power plant is limited to the district in which it operates. While this assumption is reasonable as health impacts are likely to be distributed regionally, they are not absolute, and there are likely spillover effects in adjacent districts. This potentially leads to an underestimation of the total effect of coal-fired power plants on premature adult mortality. Third, we cannot estimate the effect of coal-fired power plants located in districts with a total capacity between 1 and 1000 MW, which represents 12% of India's total installed capacity in 2014. This again likely leads to an underestimation of the mortality impact of coal-fired power plants. Fourth, we did not estimate the effect of coal-fired power plants on mortality in children (<15 years). Fifth, we did not include the mortality impact of coal mining, or incorporate the current and future mortality impact of GHG emissions as a result of coal-fired power plants. Finally, given the study design, we cannot exclude residual confounding leading to biased estimates. For instance, there may be heavy industries in certain districts with a coal-fired power plant that may lead to increased mortality. While we have excluded districts with coal-fired power plants <1000 MW (which are usually captive power plants for heavy industries), we cannot definitively exclude some residual confounding from the presence and distribution of heavy industries outside these districts. However, we adjusted for a wide variety of potential confounders of our exposure-outcome relationship, minimizing the possibility of residual confounding.
5. Conclusions
We show that ∼47 000 of India's premature adult deaths were attributable to coal-fired power plants in 2014, which were concentrated in the 10% of Indian districts that housed these plants. Given that installed coal-fired power plant capacity has increased by 22% since then, and is slated to increase by 76% until 2030, these deaths will likely increase with time, unless there is improved regulation of coal plant emissions, along with a rapid phase out of coal.
Data availability statement
The data generated and/or analysed during the current study are not publicly available for legal/ethical reasons but are available from the corresponding author on reasonable request.
Funding
There was no funding associated with the study.
Conflict of interest
The authors declare that they have no competing interests.
Authors' contributions
D B coordinated the study. A K wrote the analysis plan, did all study analyses, and wrote the first draft. All other authors contributed to data collection and commented on drafts of the paper.
Supplementary data (<0.1 MB PDF)