

Abstract
Permafrost thaw will release additional carbon dioxide into the atmosphere resulting in a positive feedback to climate change. However, the mineralization dynamics of organic matter (OM) stored in permafrost-affected soils remain unclear. We used physical soil fractionation, radiocarbon measurements, incubation experiments, and a dynamic decomposition model to identify distinct vertical pattern in OM decomposability. The observed differences reflect the type of OM input to the subsoil, either by cryoturbation or otherwise, e.g. by advective water-borne transport of dissolved OM. In non-cryoturbated subsoil horizons, most OM is stabilized at mineral surfaces or by occlusion in aggregates. In contrast, pockets of OM-rich cryoturbated soil contain sufficient free particulate OM for microbial decomposition. After thaw, OM turnover is as fast as in the upper active layer. Since cryoturbated soils store ca. 450 Pg carbon, identifying differences in decomposability according to such translocation processes has large implications for the future global carbon cycle and climate, and directs further process model development.
Export citation and abstract BibTeX RIS

Original content from this work may be used under the terms of the Creative Commons Attribution 4.0 license. Any further distribution of this work must maintain attribution to the author(s) and the title of the work, journal citation and DOI.
1. Introduction
Permafrost-affected soils store >1000 Pg carbon in organic matter (OM), both in surface soil that thaws each summer (active layer), and in the subsoil including permafrost, i.e. perennially frozen ground (Hugelius et al 2014, Mishra et al 2021). Permafrost soil OM may be particularly vulnerable to climate change since the Arctic is warming three times faster than the global average (AMAP 2021). Warming of the active layer and permafrost thaw have the potential to alter the global carbon cycle and affect future climate (Koven et al 2015, Schuur et al 2015). Therefore, these potential additional greenhouse gas sources need to be considered when estimating the transient emission pathways to limit global warming, e.g. to 1.5 °C above pre-industrial levels (Comyn-Platt et al 2018, Gasser et al 2018).
Uncertainties about the decomposability of permafrost OM and its response to warming arise from the heterogeneity in the amount and properties of OM along the soil profile. What part of the OM will decompose quickly, and will this change with depth? Dissolved OM (DOM) and free particulate OM (fPOM), which is not bound to mineral particles or occluded in aggregates, are translocated downwards with percolating water (advective transport process) towards the permafrost table, that act as a barrier to further downward transport. Here, occlusion of POM in aggregates (occluded POM, oPOM) and binding of plant and microbial residuals to mineral surfaces (mineral associated OM, MAOM) can be important stabilization mechanisms that slow decomposition (Schmidt et al 2011, Harden et al 2012, Gentsch et al 2018). With vertical transport by a diffusion-advection mechanism, we expect a monotonically decreasing OM content as found in most temperate soils (Braakhekke et al 2011, Schrumpf et al 2013). In addition, the age of OM gradually increases with depth due to the combination of surface litter input, transport and slowed organic carbon mineralization with depth (Braakhekke et al 2014, Ahrens et al 2020).
However, in cryoturbated soils, whole horizons are shifted, warped or moved and the organic-rich topsoil is often translocated downwards in the soil profile to the permafrost table (Mackay 1980, Mueller et al 2015). That means that cryoturbation mixes larger lumps of soil containing all major topsoil components, including undecomposed litter, or fPOM into deeper soil layers, in contrast to the advective transport by the water phase. Hence, cryoturbated horizons are characterized by increasing OM content, increasing fPOM content, and increasing or constant radiocarbon activity of both bulk OM and fPOM, relative to adjacent horizons (Mueller et al 2015). Due to its chemical composition similar to fresh litter, cryoturbated fPOM components could be rapidly decomposed once thawed (Gentsch et al 2015, Mueller et al 2015, Prater et al 2020), with rates potentially similar to those found in younger topsoil material.
When sampling deeper layers of soil or sediment, several layers of relict cryoturbated horizons or relict lower active layer zones can be observed at different depths and originating from very different times (Hugelius et al 2010, Harden et al 2012, Chadburn et al 2017). This is because the location of the soil surface and the depth of the active layer varies in time with climate, erosion or mineral sedimentation. We also note that topsoil horizons buried by relatively rapid accumulation of sediments (e.g. by wind-blown loess, fluvial deposition or colluvial transport) would have properties similar to cryoturbated horizons (Siewert et al 2016).
Because of the processes described above, permafrost soils exhibit an unusually large vertical variation of OM content, and are generally enriched in OM at greater soil depth than non-permafrost soils. For example, cryoturbated soils store an estimated 450 Pg of carbon in the first 3 m, roughly equally divided between the active layer and permafrost (Harden et al 2012), suggesting that more than 200 Pg of cryoturbated carbon is presently stored in permafrost. Therefore, climate change-induced thawing of permafrost in cryoturbated soils will not warm a homogenous subsoil, as expected in temperate or tropical soils, but rather distinct layers containing high OM that formed at different times and under different environmental conditions. In this study, we investigate a typical deep soil profile, affected by both advection and cryoturbation transport processes in North East Siberia with the question:
Are there differences in mineralization dynamics of organic carbon for cryoturbated/buried horizons versus advection-dominated horizons?
To address this question, we used physical fractionation of soil samples along a profile to a depth of 2.8 m using a combined density and particle size separation, and incubated the soil samples for 660 d at 4 °C to elucidate organic carbon (OC) mineralization. In addition to standard soil characterization, we also measured the radiocarbon activity of soil OM fractions and respired CO2. Using this incubation data we optimized turnover rate constants of a dynamic two-pool model (Andrén and Kätterer 1997) and defined mean residence times as their reciprocal. We interpret mean residence times based on potential decomposition at 4 °C as decomposability.
The samples, representative for widely distributed lowland Arctic permafrost affected soils, were taken from Holocene deposits on Kurungnakh Island at the southern edge of the Lena Delta in North-East Siberia. The combined interpretation of the results from physical fractionation, radiocarbon activity, and mean residence time estimation provides new insights into vertical OM decomposability patterns that are important for estimating the future greenhouse gas release from thawing permafrost.
2. Methods
2.1. Site description
The active layer and permafrost samples originate from the island Kurungnakh (72.339 194 54° N, 126.292 0864° E) in the Lena River Delta, North East Siberia. The island is situated in the zone of continuous permafrost with a trans-Arctic, continental climate and permafrost depths of up to 400 m (Yershov 1998). The annual mean air temperatures on the neighboring island Samoylov was −12.3 °C with annual soil temperatures ranging between about 10 °C and −28 °C at 6 cm depth (Boike et al 2019). Active layer depths during the short summer season are less than 70 cm. Kurungnakh is comprised of Yedoma deposits that developed during the middle and late Weichselian, which are overlain by an about 5 m thick cover of Holocene deposits. The mineral soil of the Holocene cover is mainly comprised of sandy silt including lenses of organic rich material, which originates from a vegetation dominated by sedges and willow, similar to what we find today (Wetterich et al 2008). The soils of Kurungnakh are characterized by relatively thick O-horizons (10 ± 5 cm) with extensive cryoturbation that has caused accumulation of soil OM in both the active layer and the upper permafrost (Siewert et al 2016). The thaw depth at the time of sampling (late August 2013) on undegraded Kurungnakh Ice Complex was 32 ± 5 cm (Siewert et al 2016). The surface of Kurungnakh Island is strongly influenced by thermo-erosion forming oval-shaped depressions (Alases), which developed by thawing of the massive ice-wedges in the Yedoma at the onset of the Holocene and successive thermokarst lake formation. Many of these thermokarst lakes drained, the former unfrozen lake sediments refroze, ice-wedge polygons developed and peat accumulation started under water-saturated soil conditions in the active layer (Morgenstern et al 2013). The sampling site is located in an area with no visible surface expressions of thermokarst (although such events may have occurred in the location in the past). The thermokarst unaffected plains on Kurungnakh are characterized by polygonal tundra. The vegetation is dominated by grasses (e.g. Poa arctica, Arctagrostis latifolia), sedges (e.g. Carex concolor, Eriophorum vaginatum) forbs (e.g. Dryas punctata), and mosses (e.g. Hylocomium splendens, Aulacomnium turgidum) and dwarf shrubs.
2.2. Sampling
The soils were sampled from the uppermost 3 m of a naturally occurring exposure along the Lena River Bank on 29 August 2013. The site was chosen because of its deemed characteristic of the non-degraded Kurungnakh Ice Complex deposit (see Siewert et al 2016) and because active and rapid bank erosion at the site ensures that the permafrost was unaffected by thaw in recent years. The active layer soil horizons were described and sampled from a 1 m wide soil pit opened at the top of the exposure. To describe and sample the permafrost, sharpened shovels were used to clear away all thawed soils as well as a thin layer of permafrost from the vertically thawing cliff. We believe that the samples accessed in this way consisted of undisturbed permafrost representative of the sampling depth. Soil samples from the active layer were collected by cutting cubes of known volume (O-horizon) or by carefully inserting sharpened fixed volume soil rings (100 ml) horizontally into each horizon. Soil samples from the permafrost were collected by horizontally hammering a short, sharpened corer into the soil from the cleaned surface of the deposit. Samples were stored frozen until analysis.
2.3. Soil incubations
A subsample of each sample was incubated at 4 °C under aerobic conditions in the dark. Briefly, 6–29 g of thawed sample was weighed into a 500 ml glass flask. Due to restricted sample amount only one replicate per sample could be incubated. Glass flasks were closed with butyl rubber stoppers and repeatedly evacuated and flushed with synthetic air to remove contaminations of ambient CO2. After CO2 concentrations in the incubation flasks increased at least ten-fold above the initial CO2 concentrations, the head space of the flasks was flushed again with synthetic air to remove any potential initial contamination with ambient CO2. After at least 2 mg CO2–C were released (day 124–290), the gas was transferred from the incubation bottles into evacuated stainless-steel cylinders for further 14C AMS analysis. The samples were incubated for a total period of 660 d during which they were analyzed 15 times for CO2 (supplementary figure 4).
2.4. Sample fractionation and analysis
A combined density and particle-size fractionation was applied according to Mueller and Koegel-Knabner (2009). Briefly, air-dried soil (12–30 g) was gently capillary saturated with a sodium polytungstate solution (1.8 g cm−3). Density fractionation was used to separate three different fractions, the fPOM (light organic particles freely residing in the soil matrix) and the oPOM (light organic particles occluded within aggregated mineral soil structures) and the MAOM (OM associated with mineral surfaces). Subsequently the oPOM and the MAOM fraction were further separated by sieving (<63 µm). All fractions were rinsed with deionized water to remove excessive sodium polytungstate. Subsequently all fractions were dried and total carbon and nitrogen were quantified with an elemental analyzer (VarioMAX Elementar Analysensysteme GmbH, Hanau, Germany) and are expressed as weight %. The carbon recovery after fractionation was 100.0 ± 15%. Since the sum of the coarse fractions oPOM > 63 µm and MAOM > 63 µm represented only 3.8 ± 3.0% of total organic carbon (TOC), they were not further considered.
Inorganic carbon (IC) was determined after removing organic carbon from milled samples with an alkaline H2O2 solution (Falster et al 2018). Organic free samples were weighed into 50 ml glass flasks that were air tight sealed. Subsequently the air was exchanged with pure helium and 3 ml of 43% phosphoric acid was added to release CO2, which was quantified at a gas chromatograph.
The 14C-age of carbon in the different fractions, and the CO2 released in the incubations was analyzed with a MICADAS AMS system (Ionplus, Dietikon, Switzerland) (Steinhof et al 2017). AMS 14C data were calibrated using Oxcal 4.3 and the INtCal13 calibration curve (Bronk Ramsey 2009).
Carbon stable isotope signatures of CO2 released from IC and from soil incubations were measured with an isotope ratio mass spectrometer (Delta V, Fisher Scientific, Bremen Germany) equipped with a GC-Isolink. The external standards LSVEC (−46.6‰ VPDB) and IAEA CO8 (−5.76‰ VPDB) were used for calibration.
AMS 14C data of CO2 released during the incubation of samples containing IC were corrected for IC contribution. Therefore, in a first step the fraction of IC in the released CO2 was quantified using the carbon stable isotope signature of the released CO2, of the IC and of the OC according to:
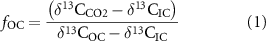
with fOC = fraction of organic carbon in released CO2; δ13CCO2, δ13CIC and δ13COC are the carbon stable isotope signatures of the released CO2, of the IC and of the OC, respectively. In a second step the fraction modern (F14C) of the CO2 originating from OC was calculated according to:
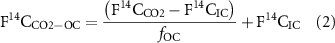
with F14CCO2–OC = F14C of CO2 originating from OC, F14CCO2 = F14C of CO2 released in incubations, F14CIC = F14C of IC and fOC = fraction of CO2 from OC in CO2 from incubations. Since F14CIC was almost identical to F14C of the OC, the corrected F14CCO2–OC values differed by less than 1.6% to the F14C of the analyzed CO2.
2.5. Dynamic decomposition modeling and mean residence time estimation
Soil OM decomposability is expressed as carbon mean residence time of conceptual pools of a dynamic model, the Introductory Carbon Balance Model (ICBM, Andrén and Kätterer 1997, Knoblauch et al 2013). This assumes a first order differential equation to describe the decomposition process over a few years. A minimum of two carbon reservoirs (Cfast and Cslow) with different decomposition rate constants are required (Knoblauch et al 2013). We use intuitive indices 'fast' and 'slow', while these numbers are the result of the parameter optimization procedure. Equation (3) describes the decomposition of one of the two pools. Some fraction h of this decomposed organic carbon is stabilized and flows into the other pool of soil organic carbon (SOC), and the rest (1 − h) is released as CO2. The dynamics of the second pool is characterized by the decomposition into CO2, and the input from the stabilization process (equation (4)). We optimized the respective decomposition rate constants (kfast and kslow) and the stabilization constant (h) (Andrén and Kätterer 1997, Knoblauch et al 2013). For this, the difference between modeled (sum of CO2 from both pools) and observed CO2 production at 4 °C from soil incubation experiments for each individual sample of the profile was used for the cost function. The SOC at start of the experiment is prescribed following the observations (table 1) but the distribution among the two pools has been also calibrated:
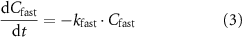
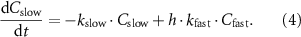
Table 1. Total organic carbon (TOC) concentrations, C/N ratios, δ13C signatures, fraction modern (F14C) and calibrated ages of the different OM fractions and the CO2 produced in incubations of samples from a permafrost cliff in Kurungnakh, Siberia, Russia. The mean residence times (MRTs) of a fast and a slow carbon pool were estimated by fitting a dynamic decomposition model to the observed CO2 production.
| Sample depth (cm) | Fraction type | TOC (%) | C/N | δ13C TOC (‰ VPDB) | F14 C | Fast C pool MRT (a) | Slow C pool MRT (a) | Calibrated age (years BP) |
|---|---|---|---|---|---|---|---|---|
| 8–16 | Unfractionated | 12.2 | 18.1 | −26.49 | 1.1369 | 0.67 | 174.82 | n.d. |
| fPOM | 34.8 | 30.6 | −26.50 | 1.1779 | ||||
| oPOM < 63 µm | 28.6 | 16.3 | −26.34 | 0.9930 | ||||
| Mineral < 63 µm | 4.3 | 17.6 | −25.73 | 0.9448 | ||||
| CO2 | −27.02 | 1.1085 | ||||||
| 16–22 | Unfractionated | 4.1 | 14.0 | −29.18 | 0.7026 | 0.17 | 68.19 | 477 |
| fPOM | 31.0 | 23.9 | −27.65 | 0.9517 | ||||
| oPOM < 63 µm | 34.7 | 24.5 | −27.94 | 0.7022 | ||||
| Mineral < 63 µm | 4.2 | 17.1 | −28.49 | 0.7168 | ||||
| CO2 | −28.00 | 0.9216 | ||||||
| 24–28 | Unfractionated | 6.6 | 14.9 | −27.53 | 0.8129 | 2.49 | 10 000 | 1280 |
| fPOM | 19.0 | 17.5 | −27.54 | 0.8474 | ||||
| oPOM < 63 µm | 34.8 | 19.4 | −27.56 | 0.8311 | ||||
| Mineral < 63 µm | 3.3 | 14.4 | −26.95 | 0.7601 | ||||
| CO2 | −28.05 | 0.8740 | ||||||
| 40–44 | Unfractionated | 2.4 | 11.3 | −28.42 | 0.6088 | 2.13 | 10 000 | 4721 |
| fPOM | 12.4 | 27.0 | −27.23 | 0.5958 | ||||
| oPOM < 63 µm | 37.7 | 26.1 | −29.07 | 0.6316 | ||||
| Mineral < 63 µm | 2.7 | 12.7 | −27.00 | 0.5887 | ||||
| CO2 | −27.26 | 0.7061 | ||||||
| 56–60 | Unfractionated | 7.9 | 14.0 | −27.70 | 0.8139 | 0.55 | 192.01 | 1293 |
| fPOM | 28.4 | 20.5 | −28.34 | 0.8431 | ||||
| oPOM < 63 µm | 31.8 | 18.2 | −27.77 | 0.8242 | ||||
| Mineral < 63 µm | 3.7 | 14.8 | −27.19 | 0.7869 | ||||
| CO2 | −27.65 | 0.8488 | ||||||
| 82–86 | Unfractionated | 8.2 | 13.9 | −27.71 | 0.7908 | 0.29 | 154.46 | 1372 |
| fPOM | 28.2 | 19.4 | −27.31 | 0.8296 | ||||
| oPOM < 63 µm | 32.0 | 17.0 | −27.91 | 0.8105 | ||||
| Mineral < 63 µm | 4.6 | 16.1 | −27.41 | 0.7695 | ||||
| CO2 | −22.66 | 0.8217 | ||||||
| 100–104 | Unfractionated | 3.7 | 15.8 | −28.29 | 0.6363 | 0.27 | 164.21 | 3762 |
| fPOM | 10.0 | 18.1 | −28.10 | 0.6482 | ||||
| oPOM < 63 µm | 34.0 | 25.8 | −28.88 | 0.6123 | ||||
| Mineral < 63 µm | 2.5 | 16.6 | −27.84 | 0.5509 | ||||
| CO2 | −23.09 | 0.7117 | ||||||
| 140–144 | Unfractionated | 2.6 | 17.3 | −28.69 | 0.4958 | 1 | 10 000 | 6337 |
| fPOM | 7.4 | 22.7 | −28.34 | 0.5034 | ||||
| oPOM < 63 µm | 34.1 | 33.9 | −28.99 | 0.5310 | ||||
| Mineral < 63 µm | 2.2 | 18.9 | −28.08 | 0.4790 | ||||
| CO2 | −24.49 | 0.6006 | ||||||
| 200–204 | Unfractionated | 10.0 | 24.5 | −29.45 | 0.4676 | 0.27 | 200.61 | 6538 |
| fPOM | 24.9 | 28.1 | −29.27 | 0.4898 | ||||
| oPOM < 63 µm | 36.9 | 29.2 | −29.40 | 0.4693 | ||||
| Mineral < 63 µm | 2.7 | 19.9 | −28.38 | 0.4343 | ||||
| CO2 | −25.60 | 0.4875 | ||||||
| 265–269 | Unfractionated | 5.2 | 13.5 | −27.21 | 0.2584 | 0.23 | 157.3 | 12 729 |
| fPOM | 31.1 | 19.8 | −27.15 | 0.2627 | ||||
| oPOM < 63 µm | 35.7 | 18.0 | −27.34 | 0.2597 | ||||
| Mineral < 63 µm | 2.21 | 8.6 | −26.20 | 0.2434 | ||||
| CO2 | −25.38 | 0.2949 | ||||||
The optimization scheme is a non-linear least squares approach with an integrated trust-region-reflective algorithm provided by MATLAB (MathWorks, United States). Mean residence times are defined as the reciprocals of the decomposition rate constants.
3. Results
Soil OC in the sampled soil profile decreases from 12.2% in the topsoil (12 cm) to 4.1% in the subsoil (19 cm) but then increases again to 7.9% at the boundary between current active layer and upper permafrost at 58 cm (figure 1(a)). After a subsequent decrease, OM contents peak again at 202 cm depth (figure 1(a)). Both local subsoil maxima of soil OM storage have TOC contents of 8%–10%. They are dominated by increased amounts of fPOM and oPOM while the amount of mineral-associated OM (MAOM) is nearly constant over the whole soil profile (figure 1(a)). Figure 1(b) shows the fraction of TOC stored in the different physical soil fractions. Mineral associated organic carbon (15%–80% of TOC) and oPOM (17%–45% of TOC) contain most of the C in a given layer. Free POM represents a large fraction of TOC only in the top active layer and in cryoturbated horizons (>30% of TOC) while the other layers show fPOM fractions of 2%–17% of TOC (figure 1(b)). The calibrated fPOM age reveals that we sampled permafrost layers from the Holocene (table 1).

Figure 1. Depth profiles of TOC content and its characteristics for several physical soil fractions, bulk soil, and respired carbon dioxide: (a) TOC content, (b) relative TOC content, (c) radiocarbon activity expressed as fraction modern, (d) and (e) optimized mean residence times of two conceptual carbon reservoirs of a dynamic model representing the fast pool (d) and the slow pool (e), respectively. Quasi-infinite mean residence times of the slow C reservoir of 1 × 10⁶ years at 26, 42, 142 cm are not displayed for clarity. Results of TOC content of occluded particulate OM greater than 63 µm (<0.5%) and MAOM greater than 63 µm (<0.01%) are not shown for clarity. The gray background illustrates the different profile zones, upper active layer (dark gray), lower active layer (light gray), and cryoturbated layers (gray). The maximum annual thaw depth ranges between 30 and 60 cm (Boike et al 2019).
Download figure:
Standard image High-resolution imageRadiocarbon activity of soil density fractions generally decreases (increasing age) with depth until a value of F14C of 0.243 in the MAOM fraction at a depth of 267 cm (figure 1(c)). This trend reverses in the 58–84 cm interval and flattens in the other interval with increased TOC (202 cm), in particular for the oPOM and fPOM fractions. Hence, we identify these soil layers as being cryoturbated (or rapidly buried) because whole horizons are transported downwards, also including POM during cryoturbation. This causes the cryoturbated pockets to be surrounded by older soil material.
Radiocarbon activity of the respired CO2 usually resembles the radiocarbon activity of the fPOM component (figure 1(c); figure 2), which can be much higher than the radiocarbon activity of other fractions (19 cm) or quite similar (58–84 cm, 202 cm). At 19 cm depth, the similarity in radiocarbon activity between fPOM and CO2 is surprising since organic carbon is dominated by MAOC (>50%) there, and only a few percent of the organic carbon is stored as fPOM (figure 1(b)). Interestingly, the radiocarbon activity of the respired CO2 from the active-layer bottom (42 cm) and at 102–142 cm (interpreted as a relict active layer) is higher than the carbon in any of the analyzed soil fractions (figure 1(c)), and in particular also higher than fPOM (figure 2). Here, the fPOM fraction is also very small (figure 1(b)).

Figure 2. Radiocarbon activity of respired CO2 usually agrees with that of particulate OM with the exception of lower active layer samples which show younger respired CO2. fOM of the uppermost soil layer is influenced by modern carbon fixed in the last ∼60 years (fraction modern >1.0).
Download figure:
Standard image High-resolution imageThe carbon mean residence times (tau, τ) were estimated for two conceptual reservoirs and for each sample by fitting the decomposition rate constants of the ICBM to match modeled and observed CO2 production. The estimated mean residence times are distinctly faster in the upper active layer or cryoturbated horizons compared to horizons at the bottom of the active layer (figures 1(d) and (e)). For the upper part of the active layer to 19 cm depth we estimated mean residence times of <1 year (fast pool) and 50–200 years (slow pool). However, further down in the active layer the slow pool is more stabilized with a mean residence time of 1 × 10⁶ years and the fast pool mean residence time is also much higher, greater than 2 years (figure 1(d)). Interestingly, these patterns are repeated in the permafrost below 50 cm starting with expected OM mean residence times for cryoturbated horizons followed by horizons of long mean residence times at a presumably former active layer bottom (102–142 cm). For the subsequent cryoturbated horizon (202 cm) again short OM mean residence times have been estimated to be similar to the upper active layer. Thus, the potential decomposability of carbon in the cryoturbated layers, which is mostly derived from decomposing fPOM (based on its 14C signature, figure 2), is much higher than of younger carbon that has been advected downward as DOM/POM.
4. Discussion
Future warming of permafrost-affected soils will increase the amount of OM accessible to microbes and intensify OM mineralization. However, permafrost-affected soils are not homogeneous with depth (Harden et al 2012), and in particular cryoturbated soils show characteristic subsoil peaks in the amount of OM (Ping et al 2015, Gentsch et al 2018). Here, we analyzed the OM decomposability of three typical (Ping et al 2015) distinct vertical zones with different OM characteristics: recent top active layer (0–20 cm), lower active layer (42–58 cm and 102–142 cm), and cryoturbated pockets (58–84 cm and 200–204 cm). Despite the typical profile of OM in these turbels, it is unclear if there is also a spatial pattern of decomposability: under equal environmental conditions, are the organic carbon in these zones mineralized with the same mean residence times?
Under uniform conditions of incubations, the top active layer (0–19 cm) shows a fast decomposition of OM in the two conceptual pools with estimated mean residence times of less than 1 year and less than 200 years, respectively, comparable with previous findings from permafrost soils. (Knoblauch et al 2013) estimated mean residence times of 0.3 and 270 years while other studies used three pools of mean residence times of <2 year, 3–8 years and >2500 years (Elberling et al 2013, Schrumpf et al 2013, Schädel et al 2014, Kuhry et al 2020). In these horizons, radiocarbon activity of respired CO2 and fPOM were in the same range, which demonstrates the importance of the fPOM fraction for OM mineralization there, mainly due to the availability of water-extractable residual OM (Surey et al 2021).
Interestingly, at the non-cryoturbated lower active layer at 42 cm or 102–142 cm depth, respired CO2 is much younger than all components of soil OM including the fPOM fraction, in line with previous findings from other permafrost sites (Gentsch et al 2018, Melchert et al 2022). This can be explained by the downward transport of higher 14C-DOM leached from layers above that accumulates just above the permafrost table (Mergelov and Targulian 2011). Dutta et al (2006) found that DOM accounts for most of the respired CO2 from deep Yedoma samples. At the same time, the estimated carbon mean residence times are twice as high for the fast pool compared to the other zones, and quasi-infinite for the slow pool. In general, this implies either (a) a higher energy limitation of microbes using the remaining DOM (Gentsch et al 2015) translocated to this bottom active layer, maybe due to fermentation processes under anoxic conditions during the times of the year when the bottom active layer is water saturated (Harden et al 2012); (b) a continuous sorption and desorption of younger DOM at mineral surfaces (Norman Schmidt et al 2011, Gentsch et al 2018), or (c) a spatial disconnection of OM and matching enzymes/microbial communities (Schmidt et al 2011, Lehmann et al 2020). Further studies about the properties and reactivity of DOM and microbial community composition from the lower part of the active layer should clarify these hypotheses. Importantly, the decomposability of the majority of OM is low in this part of the soil profile, which is in line with previous findings (Gentsch et al 2015, Kuhry et al 2020). These results also confirm that OM bound to minerals (MAOM) or occluded in aggregates (oPOM)—which is dominating in this part—is less readily accessible to microbes after thawing (Gentsch et al 2015). The consistently lowest C/N ratio and highest δ13C values of the MAOM fraction compared to other fractions (table 1, supplementary figure 2), likely due to the high proportion of microbial residues and strongly degraded OM in the MAOM, support this interpretation of the previous sentence.
Cryoturbated or buried horizons at 58–84 cm and 200–204 cm show similar characteristics to the upper active layer. As in the upper active layer, the mean residence times are low (fast decomposition), and the similarity of radiocarbon activity of respired CO2 and fPOM indicate that decomposition of fPOM is the main source of CO2. This means that the high amount of fPOM in these layers will decompose quickly once thawed, though they release old CO2 because of long-term preservation under frozen conditions. Our estimated mean residence times of the cryoturbated or buried horizon even at 2 m depth (age of ca. 7000 year BP, supplementary figure 1) of 0.3 and 200 year are comparable with estimates from the topsoil and are similar to the estimates by Knoblauch et al (2013). Cryoturbation translocated fresh topsoil OM towards the permafrost table and by this supported carbon sequestration for hundreds to thousands of years. In the Kurungnakh Ice-Complex, well over half (66%) of the SOC in the upper meter of soil is stored in cryoturbated soil horizons (Siewert et al 2016). At a pan-Arctic scale, this process is also responsible for sequestering a huge amount of organic carbon in cryoturbated subsoils today. Cryoturbated permafrost-affected soils store ca. 450 Pg carbon in full soil profiles down to 3 m, and more than 200 Pg of this is locked in perennially frozen cryoturbated horizons (Harden et al 2012, Hugelius et al 2014). Our results show that the fPOM component of this material will quickly mineralize to CO2 if exposed to oxic conditions under future permafrost thaw.
5. Conclusions
Our findings demonstrate a specific vertical pattern of decomposability of OM in permafrost-affected soils (figure 3). The majority of OM translocated to the lower active layer by an advective transport of DOM with the water phase has long mean residence times, hence low decomposability due to stabilization by organo-mineral associations. In contrast, the fPOM mixed down in cryoturbated layers will decompose fast (short mean residence times) after thawing, similar to fPOM of the upper active layer. An explanation might be that cryoturbation transports all physical soil fractions of a topsoil horizon fast enough to the subsoil, such that we can still find a high amount of particulate OM there. Since ca. 70% of the 1000 Pg carbon stored in permafrost affected soils is located in the upper organic horizons and in cryoturbated layers (Harden et al 2012, Hugelius et al 2014) these links among carbon transport, stabilization and decomposition mechanisms need to be understood for estimating the future carbon cycle and climate. For example, cryoturbation and carbon reservoirs like fPOM need to be considered in land surface models. Furthermore, considering the interaction between these processes enable a reliable initialization of soil carbon stocks in land surface models, which is a pre-condition for projecting the future greenhouse gas release from permafrost-affected soils and related biogeochemical feedback mechanisms. More topsoil and subsoil accounting of fPOM and DOM fractions of soil OM is required as these fractions are most vulnerable to fast mineralization on warming.

Figure 3. Summary of decomposability, characteristics, and transport processes for the three main regions of interest (in yellow) in a cryoturbation-affected soil profile. Cryoturbation transports OM fast enough to maintain a high fPOM content, which leads to a similar high decomposability as in the upper active layer. Decomposability is defined by mean residence time of the carbon pools. OM: organic matter. fPOM: free particulate OM. O-M: organo-mineral.
Download figure:
Standard image High-resolution image
Acknowledgments
We are grateful to Birgit Grabellus and Ralf Lendt for help with laboratory analysis and Janet Rethemeyer (University of Cologne) for 14C analysis of inorganic carbon. We acknowledge Dr M Siewert for help with soil sampling. S T and A H acknowledge support from the European Research Council (ERC) under the European Union's Horizon 2020 research and innovation programme (Grant No. 695101; 14Constraint). CB acknowledges financial support by Deutsche Forschungsgemeinschaft through the Heisenberg program (DFG–BE 6485/1-1 and DFG-BE 6485/4-1), C K was supported by the Clusters of Excellence CLICCS (EXC2037/1) at the Universität Hamburg funded by the German Research Foundation (DFG). G H acknowledges the EU Seventh Framework Programme—ENVIRONMENT project PAGE21 (Grant Agreement No. 282700) and the EU Horizon 2020 research and innovation project Nunataryuk (773421). The fieldwork was supported by a EUFP7 INTERACT Transnational Access Grant.
Data availability statement
Any data that support the findings of this study are included within the article.
Conflict of interest
All authors declare no conflict of interest.