

Abstract
Climate change is projected to induce extreme and irregular rainfall patterns in the West African Sahel region, affecting household food security and income. Children are among the worst affected population groups. Previous studies focusing on rainfall irregularities in specified periods have revealed how child health and nutritional status are impacted, especially in rural settings. However, the aggregated effect of rainfall over a lifetime on chronic child undernutrition remains poorly understood. We conducted a multilevel regression using a 2017 household survey from rural Burkina Faso containing 12 919 under-five-year-old children and their corresponding household rainfall data. The rainfall data originated from the Climate Hazards Infrared Precipitation with Stations monthly dataset with a native resolution of 4.8 km (0.05°). We show that an increase in rainfall below 75 mm monthly average tends to produce poor nutritional outcomes (regression coefficient = −0.11***; 95% CI = −0.13, −0.10; p < 0.001) in rural Burkina Faso children. We found a consistent negative relationship between different sex and household wealth groups, but not age groups. Vulnerable younger children were more affected by the adverse effects of increased rainfall, while older children seemed to handle it better. Our methodological approach tracing the impact of rainfall over children's lifetimes makes a meaningful contribution to the portfolio of tools for studying the complex relationship between climate change and health outcomes. Our work confirms that rainfall is a risk factor for chronic child undernutrition, highlighting the need for adaptation strategies that boost household and community resilience to counteract the harmful impacts of climate change on child nutritional status.
Export citation and abstract BibTeX RIS

Original content from this work may be used under the terms of the Creative Commons Attribution 4.0 license. Any further distribution of this work must maintain attribution to the author(s) and the title of the work, journal citation and DOI.
1. Introduction
Climate change-induced rainfall irregularities are a problem in the West African Sahel, a region that has experienced an increase in extreme weather events such as droughts and floods [1, 2]. The IPCC sixth assessment report predicts an increase in the amount of rainfall in this region as the global surface temperature continues to increase [3]. Historical data analysis indicates the effect of extreme weather events upon major staple crops (millet and sorghum) with yield losses worth billions of dollars [4, 5]. It has been estimated that the reduction in crop yields will exacerbate under different climate change scenarios [6]. It is precarious for rural agrarian communities that depend on predictable and consistent rainfall for food production closely linked to their sustenance [7]. Reduced crop yield will affect household income, food security, and nutrition [8].
Children under five years old (U5YO) are most susceptible to household food insecurity [9, 10] due to their distinct nutrient need for critical physiological processes [11]. The combination of nutrient deficiency from inadequate dietary intake and threatening disease environments due to rainfall hazards lead to chronic undernutrition in U5YO children [12]. Chronic undernutrition, also known as stunting, manifests as linear growth retardation, meaning that children are too short for their age. Many studies use height as a proxy to monitor long-term growth anomalies [13]. Chronic undernutrition is a major contributor to child mortality worldwide and is projected to increase under the current climate change scenarios [14]. One study predicts an up-to-23% increase in chronic undernutrition (moderate stunting) under different climate change scenarios in Sub-Saharan Africa (SSA) by 2050 [15]. Children with stunting may have increased mortality risk, low cognitive skills, and poor school performance affecting adulthood productivity and the broader economic output [16, 17].
The growing uncertainty in rainfall dynamics and its impact on nutritional status has garnered research attention. In SSA, the relationship between rainfall and chronic undernutrition in children has been extensively studied [18–20]. Studies differ in the rainfall characteristics considered, particularly the period and duration of rainfall exposure. Most have estimated the impact of annual and seasonal rainfall characteristics in different years or periods of child growth, while a few have combined rainfall exposure over multiple periods [21–23]. To our knowledge, only one study conducted in Kenya measured rainfall exposure from a lifetime perspective, i.e. from the month of conception to the time of the survey [23]. Recent works acknowledge the need for further studies to look at rainfall effects on health outcomes over long periods [21, 24].
This paper reduces this knowledge gap by examining the association between cumulative lifetime rainfall exposure and chronic undernutrition in U5YO children in rural Burkina Faso. Cumulative rainfall exposure, better suited for the analyses of chronic undernutrition [21], reflects the combined effect of multiple impact pathways (e.g. through altered food production and changing risk of infection) without trying to separate individual pathways. We look at both overall effects and differential effects by age, sex, and household socio-economic status (SES).
2. Population and methods
2.1. Study setting
Burkina Faso is a West African country with a population of approximately 21 million, of which 70% live in rural areas and are engaged predominantly in subsistence agriculture [25]. U5YO children make up 18.5% [26] of the population, and 25% are considered stunted, one of the highest prevalence in SSA [27]. The country has three distinct agro-ecological zones with different annual rainfall amounts that dictate staple crop production: Sahelian (<600 mm of annual rainfall), Sudano-Sahelian (600–900 mm), and Sudano (900–1200 mm) [28]. Rainfall patterns in Burkina Faso influence crop yield variation [29] and infectious disease prevalence [30]. Past (1950–2013) rainfall analyses show a significant negative trend in total annual rainfall and an increase in the length of dry spells [31, 32]. Projected (2021–2050) analysis predicts an increase in strong rainfall events and delays in rainy season onset. Changes in rainfall characteristics in Burkina Faso amounts to food insecurity [33], poor nutritional status [34], and survival [35] in children.
2.2. Data and data sources
2.2.1. Household survey data
For this study, we used the endline household survey conducted as part of the impact evaluation of the performance-based financing (PBF) program implemented in Burkina between 2014 and 2018 [36]. The anthropometric data were used with the sole intention of investigating rainfall effects on the nutritional status of children without drawing any link to the PBF program. The survey was conducted between April and June 2017 in 24 districts 9 distributed in eight regions. The sampling approach has been described extensively elsewhere [36]. In brief, the survey used a two-stage sampling strategy: a village was selected at random from the complete pool of villages in the catchment area of each surveyed health facility, for a total of 526 villages. Within each village, up to 15 households (georeferenced, see figure 1) were selected randomly from all households with a pregnancy history in the prior 24 months. Data were collected on all household members, including children U5YO, household socio-economic and demographic profile. Of specific interest for our study are anthropometric measurements collected for 13 486 children aged 0–59 months, their respective caregiver demographics, and household socio-economic indicators.

Figure 1. A health district map of Burkina Faso showing the study districts, households, and the closest satellite grid centroids.
Download figure:
Standard image High-resolution image2.2.2. Rainfall data
We used the publicly available high spatial resolution rainfall data from the Climate Hazards Infrared Precipitation with Stations (CHIRPS) monthly dataset with a native resolution of 4.8 km (0.05°). This choice is due to the scarcity of rain gauge data covering all the villages included in our study. The CHIRPS data is a product of the US Geological Survey and the Climate Hazards Group at the University of California, Santa Barbara. It combines World Meteorological Organization's Global Telecommunication System gauge data and satellite-based Cold Cloud Duration estimates to produce a product between a curated interpolated gauge and a pure satellite-based dataset [37]. The CHIRPS data has performed well compared with gauge rainfall data in terms of the agreement, less bias, and capturing extreme events vis-à-vis similar satellite products in Burkina Faso [38] and SSA [37, 39, 40]. A detailed description of the CHIRPS dataset can be found elsewhere [37].
Using the household geocodes from the survey data with a latitude range of 9.43°–14.01° and a longitude range of −4.50°–0.58°, we extracted the household-level monthly rainfall estimates from September 2011 to June 2017. Our extracted rainfall data fell within a distance of 0.0007 km to 3.9 km from cluster centroid to a household with a mean distance of 2 km. Figure 2 presents the total rainfall summed for the study period by health districts. Households and their closest satellite grid centroids are indicated as blue and red symbols, respectively.

Figure 2. Distribution of total rainfall for the entire study period (09/2011 to 06/2017) by health districts in Burkina Faso.
Download figure:
Standard image High-resolution image2.3. Variables and their measurement
2.3.1. Outcome variable
We used continuous height-for-age z-score (HAZ) as the metric of chronic undernutrition in U5YO children [13]. It was computed with recumbent length in younger children (below 24 months or older children unable to walk) and standing height for children older than 24 months along with their age in months. The enumerators verified child age from vaccination booklets where possible. We only relied on caregiver-reported age data in the absence of a vaccination booklet. In addition, at the data cleaning and management stage, consistency checks were implemented to ensure that the data were consistent across sections in the survey. For instance, timing reported by women for their pregnancy was consistent with children's age or that vaccination reports were consistent with children's age. HAZ shows how a child's height in relation to age deviates from the median of a healthy reference group—the WHO child growth standards. HAZ ⩽ −2 classifies a child as stunted [41]. We used the WHO Child Growth Standards Stata igrowup package to compute HAZ [42].
2.3.2. Exposure variable
Existing literature shows that rainfall affects child growth at every stage, including during pregnancy [43], but as mentioned earlier, most identified studies so far concentrated on short-term measures of rainfall such as separate seasonal rainfall events [19]. Approaching rainfall from a lifetime perspective has the potential to capture the aggregated effect of rainfall over a lifetime (including its exposure in utero) on child nutrition. Our exposure variable was operationalized as average lifetime rainfall exposure (ALE), defined as the total rainfall from conception to the survey month (June 2017) for each child averaged over the child's age in months. First, we calculated each child's lifetime cumulative rainfall (LCR) as a summation of household-level monthly rainfall for an optimal nine-month pregnancy period and the age in months. Then, we divided the LCR by the child's age in months. Our approach differs from others that assign each child to the seasonal or annual rainfall measurement. These other approaches suggest that effects (mostly nutritional effects through crop production) are fairly distributed irrespective of the birth month and exposure length [23]. Our measurement, however, is informed by Cornwell and colleagues, who have shown that rainfall effects are not fairly distributed across all children born during a specific year [44].
2.3.3. Covariates
From the household survey, we extracted information on child age (months), sex (boy/girl), caregiver age (in years), caregiver literacy (illiterate/literate), household size, and household SES as covariates. These covariates have been established as predictors of child nutritional status [35, 45], hence considered important confounding factors. Household SES was operationalized as a wealth index computed on household assets using multiple correspondence analysis [43] and categorized into quintiles to indicate household socioeconomic groups ranging from the poorest to the least-poor.
2.4. Data analysis
2.4.1. Data management and handling missing data
We excluded less than 5% (567) of the 13 486 children due to missing height and unrealistic HAZ (<−6 or >6), leaving a final sample of 12 919 children (aged 0–59 months) distributed across 6890 households from 526 villages and 24 health districts.
2.4.2. Statistical analysis
Means and standard deviations (SDs) for continuous variables and percentages for categorical data were used to describe the study population. To estimate the associations between ALE and HAZ, we used a multilevel mixed-effect model due to the hierarchical structure of the survey data (children are nested in households, nested in villages, nested in districts) [46]. Moreover, as our analyses are based on secondary data, there are likely unmeasured differences at each level of clustering. Thus, a multilevel mixed-effect model was employed that combines both fixed and random effects to control for both measured and unmeasured differences at each level of clustering [47].
The model is mathematically expressed as:
where  is the observed z-score (HAZ) for child i in household j in village k and district l.
  is the exposure variable of interest, and
  is the squared version of the exposure exploring the non-linearity of the relationship. We followed the example of Rabassa and colleagues [48] in exploring the non-linearity of the ALE-HAZ relationship. We tested this in our model using the approach of Lind and Mehlum [49] (with Stata 'utest' command). The test results indicated that we could not reject the presence of a U-shape (non-linearity) at a 5% significance level, justifying the inclusion of a quadratic rainfall term (see appendix
  ,
,  and
and  are vectors of parameters associated with
  ,
,  and
and  . The terms
  ,
,  ,
,  , denote the district, village, household random effects,
  represents the child level residual (assumed to be independent and normally distributed) [46].
First, we fitted the model on the pooled sample and then on a stratified sub-sample by age, sex, and SES. We conducted a likelihood ratio test that compares differences in model deviation statistics to justify the need for higher levels [47]. The null hypothesis for the test was that children at different levels of clusters are not alike. The positive and statistically significant chi-square value confirmed clustering in characteristics at the levels we considered, thus necessitating a multilevel regression approach (see appendix
3. Results
3.1. General characteristics of the study population
Our sample was almost an equal split in the number of boys and girls (table 1). The mean age in the total sample was 26.5 ± 17.9 months, very similar for the boys' and girls' strata. Caregivers had a mean age of 29 years, and more than 80% were illiterate. The mean number of people living in one household was eight, with a maximum of 30 persons. The mean HAZ of −0.99 ± 1.55 corresponded to a stunting prevalence of 24% in this study population. Boys had a higher stunting prevalence (26%) than girls (21%). The study population was exposed to a mean LCR of 2378 ± 1427 mm, and an ALE of 67 ± 13 mm per month. We present the summary statistics stratified by age and wealth quintile in appendix
Table 1. General characteristics of the study population (N = 12 919).
| Total | Boys | Girls | |
|---|---|---|---|
| N | 12 919 | 6409 | 6510 |
| Socio-demographic variables | |||
| Child age in months | 26.50 (17.87) | 26.6 (17.97) | 26.41 (17.76) |
| Caregivers' age in years | 28.89 (6.85) | 28.85 (6.8) | 28.92 (6.92) |
| Household size | 7.91 (4.01) | 7.92 (3.97) | 7.89 (4.05) |
| Wealth index | 0.08 (0.95) | 0.06 (0.94) | 0.10 (0.96) |
| Caregiver illiterate (%) | 81.04 | 81.00 | 81.08 |
| Anthropometric variables | |||
| Height in cm | 81.63 (14.56) | 82.08 (14.45) | 81.17 (14.65) |
| Height-for-age z-score (HAZ) | −0.99 (1.54) | −1.09 (1.57) | −0.89 (1.51) |
| Stunting (%) | 23.78 | 26.48 | 21.12 |
| Climate variables | |||
| Lifetime cumulative rainfall (LCR) in mm | 2378.61 (1426.60) | 2383.36 (1429.72) | 2373.93 (1243.60) |
| Average lifetime rainfall exposure in mm (ALE) | 67.37 (12.94) | 67.42 (12.45) | 67.33 (12.49) |
This table is presented as means and SD in brackets or proportions with percentage signs on the variables.
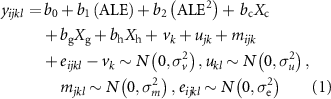
As indicated in figure 3, district HAZ means ranged from −1.50 to −0.75. Rates appeared higher when moving from south to north, with the middle-belt estimates falling between the two. Figure 4 compares the Pearson correlation estimates between child HAZ and ALE (not the mean values) by districts. We laid the correlation estimates on the district total rainfall map to uncover patterns in HAZ-ALE correlation along with the district total rainfall. The figure shows a negative correlation between HAZ and ALE in most districts, with no clear pattern based on total rainfall per district. In other words, the districts with the significant positive HAZ-ALE correlation were not those with the highest or least total rainfall. The next section presents the multivariate four-level mixed-effect analysis results controlling for relevant measured covariates.
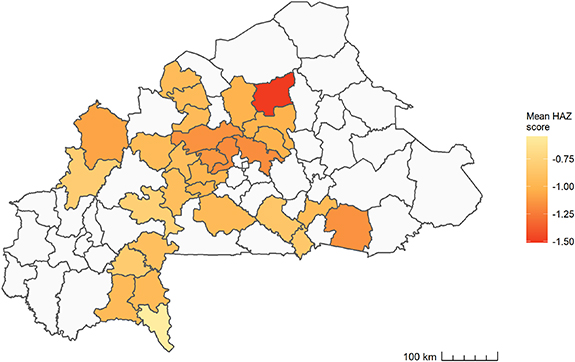
Figure 3. Distribution of height-for-age z-score for children under five years old by health districts in Burkina Faso.
Download figure:
Standard image High-resolution image
Figure 4. Pearson correlation estimates showing the relationship between child height-for-age z-score and average lifetime rainfall exposure by health districts in Burkina Faso. NNS-negative and not significant, NS-negative and significant, PNS- positive and not significant, PS- positive and significant. Significant at p ⩽ 0.05.
Download figure:
Standard image High-resolution image3.2. Associations between ALE and HAZ
Figure 5 presents the estimation results of the multivariate four-level mixed-effect analysis containing all children (main model) and those with children stratified by age and sex. All models include child age, sex, household size, caregiver age, caregiver literacy, and household wealth index as covariates. Accounting for all the above-mentioned potential confounders, we observed a significant negative association between HAZ and ALE in U5YO children. A unit increase in ALE was significantly associated with a 0.11 decrease in HAZ (95% CI = −0.13; −0.10, p < 0.001). The negative ALE-HAZ association was consistent after including a quadratic (ALE2) alongside the ALE term. However, the quadratic term showed a significant positive relationship with HAZ, indicating that the relationship between rainfall and HAZ for the 12 919 children we studied was non-linear (convex/u-shaped). Further analysis showed that a unit increase in ALE (up to around 75 mm) related to a decrease in HAZ (95% CI = 73;78, p < 0.001), the turning point from which the association between ALE and HAZ turns positive (see appendix

Figure 5. Effect estimates of average lifetime rainfall exposure (ALE) and height-for-age z-score (HAZ) resulting from a multivariate multilevel (child-household-village-district) regression model stratified by age groups and sex.
Download figure:
Standard image High-resolution imageFigure 6 displays the results of the association between ALE and HAZ stratified by SES. Our results indicate a significant negative association between HAZ and ALE in all SES groups. Albeit slight differences in the estimates of the different SES strata, the worst effect was found in the second quintile (children from poorer households); a unit increase in ALE was significantly associated with a 0.12 reduction in HAZ (95% CI = −0.15; −0.09, p < 0.001). The complete results table can be found in appendix
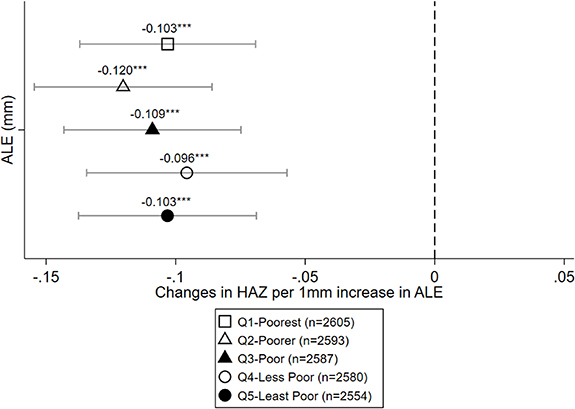
Figure 6. Effect estimates of average lifetime rainfall exposure (ALE) and height-for-age z-score (HAZ) resulting from a multivariate multilevel (child-household-village-district) regression model stratified by socioeconomic status (SES).
Download figure:
Standard image High-resolution image4. Discussion
In this paper, we focused on the associations between ALE and chronic undernutrition in U5YO children in rural Burkina Faso, aiming to capture the aggregate impact of rainfall (net positive or negative) in the lifetime of the children in our sample. We discuss the four key findings that emerged from our analysis. First, we found a negative relationship between HAZ and ALE in children aged 0–59 months, albeit capped at around 75 mm, after which the relationship reverses. Different climate change and child health frameworks show that rainfall exposure influences child nutrition through two main underlying causes: altering the food availability/utilization and the disease environment [50, 51]. The two causes can be driven positively and negatively by high and low rainfall exposure [24, 52]. Our identified association suggests the nature of the cumulative influence of rainfall on children's long-term nutritional status across these pathways. We found evidence in Burkina Faso suggesting that it took a substantial amount of rainfall to notice a significant positive change between rainfall and HAZ [43]. This evidence aligns with our finding, indicating that increments in rainfall did not relate to gains in child nutritional status unless the increase was substantial (exceeding a monthly average of 75 mm). The evidence on such cumulative exposure is particularly important for subsequent research projecting potential future climate change impacts on child undernutrition in Burkina Faso.
Appraising our findings against studies having applied a similar long-term approach to rainfall exposure in SSA, we note that our first finding aligns with the results of Cooper et al [17] in Northern Ghana, which borders Burkina Faso. They investigated the relationship between extreme rainfall over different time windows (12, 24, 36, 48, and 60 months) and child undernutrition. They found a significant increase in stunting (decrease in HAZ) in children aged 0–59 months related to the rise in extreme rainfall over 36 months period. Conversely, Grace et al [23] in Kenya contrasted our findings. The authors looked at rains during the growing season (March–May) averaged over the lifetime in children aged 1–5 years and their nutritional status. They observed that children who experienced aggregated high rainfall during the March–May growing seasons were less likely to be stunted, attributing it to increased food availability. We believe the contrasting findings may also be due to the age range differences of the samples studied: as their sample did not include children under one year (among the worst affected in our study and other studies [19]). We found a similar positive relationship between ALE and HAZ when we excluded children under one year, albeit not statistically significant (see appendix
We also appraised our findings against studies conducted in Burkina Faso, albeit measuring short-term rainfall effects. Using data from a rural site in North-Western Burkina Faso, Mank et al [53] observed that rainfall deviation from the previous year's average rainfall increased stunting risk among children below five years of age, consistent with our finding. Contrastingly, Bonjean et al [43] reported a decrease in the likelihood of stunting from increased rainfall at the prenatal period for rural children across the country using a nationally representative sample.
Second, the negative association persisted when we stratified our model by sex, with slight differences between sexes. This observation can be explained in many plausible ways. The first explanation is that younger children are more vulnerable to rainfall shocks [43], possibly due to weaker immune responses [54] that predispose them to rainfall-related disease effects, which further inhibit dietary intake and nutrient absorption [52]. This is backed by evidence indicating that the most vulnerable period with devastating rainfall effect is between the prenatal and first year after birth [43]. Concerning dietary intake, younger children have higher nutritional needs than older children, making them prone to inadequate dietary supply related to crop failure due to extreme rainfall [51]. Another explanation is catch-up growth. Compared to younger children, older children exposed to different rainfall seasons might experience a counteracting effect; the positive rainfall effect(s) overrides the negative effect(s), resulting in a net positive effect nutritional effect at the time of measurement. Evidence suggests that children can recover from bad nutritional outcomes related to rainfall in earlier periods [48]. Another plausible explanation for the difference in effects between younger and older children is selective mortality in children.
Most child mortality occurs in children under 12 months (around 53% globally and 94% in Burkina Faso in 2020), implying vulnerable children die before 12 months [55]. Thus, the pool of older children might be those better fit to survive despite adverse circumstances, including variations in rainfall quantities.
Third, the nutritional status of children below two years was more likely to be negatively affected by ALE than those aged two or above. Some studies suggest that in cultures with a preference for one sex over the other, gender discrimination in intra-household resource allocation may account for the differences in child response to adverse rainfall effects [56, 57]. We found that girls had a less negative impact compared to boys. However, the difference is almost negligible, tending to support evidence from earlier studies [58, 59] showing no gender-based discrimination in intra-household resource allocation in Burkina Faso. Meanwhile, another study in Burkina Faso observed that boys are more affected by adverse rainfall effects in the prenatal period, attributing their finding to the vulnerability of boys in early life [43]. We recommend further research on the differences in child response to climate effects and the possible influence of gender norms, particularly relating to household resource allocation.
Lastly, we looked at how wealth moderates the rainfall-nutritional status effect. We found that stunted children spread across all wealth groups, with 41% in households in the first and second quintile (see appendix
5. Methodological considerations
We outline here the strength and limitations of this study. To begin with the strengths, it uses one of the largest currently available datasets on malnutrition among children in rural Burkina Faso, although not a nationally representative sample. In addition, we used one of the finest resolution satellite rainfall products (CHIRPS) to get rainfall estimates at the household level. Nonetheless, we need to acknowledge a few limitations. First, the possibility of errors in the anthropometric measure of infants (less than 18 months) cannot be ruled out. We, therefore, conducted a sensitivity analysis excluding children under 18 months following the approach of Brown and colleagues [60]. We found a similar positive rainfall-undernutrition effect, albeit not statistically significant (see appendix
Secondly, the monthly total rainfall in Burkina Faso is mostly under 200 mm, a figure below which satellite products produce poor rainfall estimates [38]. It may result in underestimating ALE, particularly in drier areas like the Nord and Centre-Nord districts.
Thirdly, ALE might be over-or-underestimated for each child for three reasons. Although enumerators verified the child's age from the vaccination booklet, enumerators elicited children's age from caretakers in a few instances in the absence of the vaccination booklet. We do recognize a potential bias in our estimates due to inaccuracies in age recall, but we deem this bias to be of minute proportions given all steps taken by the team to ensure accuracy in the identification of the child's age. Next, we assumed that gestational age was 40 weeks for each child, ignoring preterm or delayed birth as similar studies [23, 43] due to the difficulty of acquiring detailed pregnancy information. Then, we assumed children stayed in the same village throughout their lifetimes. We believe it would minimally affect our estimates because most households in our sample (95%) could be found in the same village within the three-year baseline and endline survey period [61]. In addition, there is evidence that children under five are less likely to stay away from their parents [62].
Finally, our models did not include potential confounders, such as birth weight and household composition, among others, due to data unavailability.
6. Conclusion
Previous studies looking at rainfall irregularities at specific periods have linked it to fluctuations in chronic undernutrition in U5YO children. We concentrated on rainfall measured over the lifetime and demonstrated how it affects chronic undernutrition in rural Burkina Faso. Our methodological approach that traces the impact of rainfall from conception to the current age makes a meaningful contribution to the portfolio of tools for studying the complex relationship between climate change and health outcomes. Our finding aligns with many other studies [19] that found a significant association between rainfall as a climate change proxy and child health and nutrition. We found that children, especially those under age two exposed to more than average rainfall in Burkina Faso, are more likely to be short for their age. The observed negative effect was consistent between different sex and household wealth groups.
This study was set up to explore the association between cumulative rainfall and undernutrition, but given data availability, we could not establish causality or explain underlying mechanisms of action. Therefore, we acknowledge the need for further studies to explore how rainfall affects the immediate undernutrition causes (dietary intake and health risk) and the response of households and social systems (like the health system). Moreover, we did not look at the anomalies in cumulative rainfall exposure, which can offer meaningful insights into understanding this relationship. Thus, we recommend that future studies address this concern.
Nevertheless, we recommend that immediate and concerted efforts are needed to protect children against the harmful impact of climate change, given the sustained effect of chronic undernutrition into adulthood. On the one hand, this can be achieved by reducing household vulnerability and boosting their resilience with nutrition-sensitive interventions such as promoting climate-resistant crop varieties, irrigation, crop insurance, and cash transfers. In addition, policymakers need to target children broadly through nutrition-specific interventions such as nutritional education for caregivers and micronutrient supplementation to children and pregnant women [63].
Acknowledgments
We are grateful to the Katholischer Akademischer Ausländer-Dienst (KAAD), who financially supported the lead author through a PhD scholarship. For the publication fee, we acknowledge the financial support by the German Research Foundation (DFG) as part of the Research Unit "Climate change and health in sub-Saharan Africa" (FOR2936) (reference: D10041694) as well as the DFG and Heidelberg University funding programme "Open Access Publikationskosten". The authors are also grateful to the World Bank for granting use of the Performance-Based Financing survey data, collected with financial and technical support by the Health Results Innovation Trust Fund (HRITF) and field support by the Centre Muraz.
Ethical Statement
No ethical clearance was required for this study because we relied exclusively on fully anonymized secondary data, which has already received ethical clearance both from the Ethics Committee of the Medical Faculty of the University of Heidelberg (Protocol number S-272/2013) and Burkina Faso National Ethics Committee (Protocol number 2013-7-06). Authorization to use the PBF data was obtained from the project lead investigators.
Data availability statement
The data that support the findings of this study are openly available. The household survey data used for this study is available upon request in the World Bank's Central Microdata Catalogue [64]. The rainfall data is openly available at http://chc.ucsb.edu/data/chirps/.
Funding
The data used in this study were collected as part of an impact evaluation of the performance-based financing program in Burkina Faso, which was funded by The World Bank's Health Results Innovation Trust Fund (HRITF) through grants to Heidelberg University, Germany, and Centre MURAZ, Burkina Faso.
Authors Contribution
E Y was responsible for conceptualization, data curation, formal analysis, data interpretation, and manuscript drafting. N K contributed to the formal analysis, data interpretation, and manuscript drafting. I S contributed to visualization, data interpretation, and manuscript drafting. D P contributed to formal analysis and reviewed the manuscript. E B contributed data and reviewed the manuscript. J L contributed to data curation, data interpretation, and manuscript drafting. S H contributed to data collection, data interpretation, and manuscript review. T P contributed to data collection and manuscript review. K B contributed to the data analysis and interpretation. R S contributed to study conceptualization, data interpretation, and manuscript drafting. T B contributed to the study's conceptualization. I D contributed to study conceptualization, data interpretation, and manuscript drafting. M D contributed to study conceptualization, data interpretation, and manuscript drafting. All authors critically reviewed the paper and gave final approval for its publication.
Conflict of interest
The authors have no conflicts of interest to declare relevant to the content of this article.
Appendix A.: Table of Likelihood ratio test comparing the four-level model to linear, two-level, and three-level models.
| Likelihood ratio test | Linear Model chi2 (Prob. > chi2) | Two levels chi2 (Prob. > chi2) | Three levels chi2 (Prob. > chi2) |
|---|---|---|---|
| Four levels | 246.24 (0.0000) | 142.60 (0.0000) | 44.65 (0.0000) |
Appendix B.: General characteristics of the study population by age and wealth quintile (N = 12 919).
| Age: 0–23 months | Age: 24–59 months | Poorest Q1 | Poorer Q2 | Poor Q3 | Less Poor Q4 | Least Poor Q5 | |
|---|---|---|---|---|---|---|---|
| N | 6536 | 6383 | 2605 | 2593 | 2587 | 2580 | 2554 |
| Socio-demographic variables | |||||||
| Mean (SD) child age in months (m) | 10.78 (6.83) | 42.58 (9.29) | 25.53 (17.65) | 26.73 (17.84) | 26.48 (17.78) | 26.82 (17.95) | 27.11 (18.12) |
| Mean (SD) caregivers' age in years | 28.19 (6.86) | 29.59 (6.77) | 27.64 (6.62) | 28.94 (6.73) | 29.13 (6.71) | 29.24 (7.02) | 29.39 (7.04) |
| Mean (SD) household size | 7.5 (3.88) | 8.36 (4.13) | 6.03 ±2.85 | 7.34 (3.44) | 7.89 (3.57) | 8.64 (4.16) | 9.7 (4.87) |
| Mean (SD) wealth index | 0.05 (0.96) | 0.12 (0.94) | −1.19 (0.30) | −0.49 (0.16) | 0.04 (0.15) | 0.59 (0.18) | 1.48 (1.48) |
| Caregiver illiterate a (%) | 82.66 | 79.13 | 83.67 | 83.96 | 82.04 | 79.08 | 75.63 |
| Anthropometric variables | |||||||
| Mean (SD) height in cm | 69.62 (8.6) | 93.88 (7.49) | 80.86 (14.2) | 81.85 (14.41) | 81.49 (14.63) | 81.82 (14.65) | 80.73 (14.85) |
| Mean (SD) height-for-age z-score | −0.59 (1.71) | −1.41 (1.22) | −1.02 (1.58) | −0.99 (1.59) | −1.04 (1.55) | −1.00 (1.51) | −0.93 (1.50) |
| Stunting a (%) | 17.12 | 28.76 | 24.85 | 24.59 | 24.64 | 23.89 | 22.00 |
| Climate Variable | |||||||
| Mean (SD) lifetime cumulative rainfall (mm) | 1351.77 (529.78) | 3430.06 (820.1) | 2275.81 (1221.28) | 2387.35 (1236.52) | 2379.83 (1242.42) | 2388.70 (1231.95) | 2463.16 (1249.12) |
| Mean (SD) monthly average lifetime rainfall exposure (mm) | 68.22 (14.24) | 66.50 (13.91) | 66.66 (12.91) | 67.24 (12.79) | 67.39 (12.48) | 67.17 (11.64) | 68.42 (12.43) |
Data presented as mean and SD in parenthesis unless noted otherwise. a Data presented as proportion.
Appendix C.: General characteristics of the omitted observation population (N = 567).
| Variable | N | Mean | Standard Deviation | Min | Max |
|---|---|---|---|---|---|
| Mean child age in months | 567 | 25.88 | 19.04 | 0 | 59 |
| Mean caregivers' age in years | 567 | 27.95 | 6.36 | 15 | 50 |
| Mean household size | 567 | 7.94 | 4.01 | 2 | 29 |
| Mean wealth index | 567 | 0.22 | 0.96 | −2.18 | 2.63 |
| Caregiver illiterate (%) | 80.07 | ||||
| Mean height in cm | 189 | 75.26 | 18.39 | 30 | 120 |
| Mean lifetime cumulative rainfall (LCR) in mm | 567 | 2390.19 | 1373.29 | 265.133 | 6048.38 |
| Mean average lifetime rainfall exposure in mm (ALE) | 567 | 68.03 | 12.89 | 29.46 | 105.72 |
Appendix D.: Test for a U-shaped relationship.
| Specification: f(ALE) = AE2 Extreme point: 75.14559 Test: H1: U shape vs. H0: Monotone or Inverse U shape | ||
| Lower bound | Upper bound | |
| Interval | 24.61914 | 109.1567 |
| Slope | −.0768689 | .0517432 |
| t-value | −14.24571 | 9.351208 |
| P > t | 5.29e-46 | 5.04e-21 |
Overall test of presence of a U shape: t-value = 9.35, P > |t| = 5.04e-21.
Appendix E.: HAZ-ALE relationship for children aged 0–59 months showing the turning point (dash line).
Download figure:
Standard image High-resolution image
Appendix F.: Summary table showing the multivariate multilevel (child-household-village-district) regression analysis by age groups and the turning point of the non-linear function.
| Age Group 1 | Age Group 2 | Age Group 3 | Age Group 4 | Age Group 5 | ||
|---|---|---|---|---|---|---|
| All | 0–11 months | 12–23 months | 24–35 months | 36–47 months | 48–59 months | |
| LCR | −0.0024*** | −0.0003*** | −0.0003 | 0.0005 | 0.0012*** | 0.0005 |
| LCR2 | 2.82e-07*** | 1.58e-06*** | 3.93e-08 | −4.96e-08 | −1.70e-07*** | −6.12e-08 |
| LCR Turning Point | 4291 | 996 | 3881 | 4635 | 3634 | 4752 |
| ALE | −0.1143*** | −0.0264*** | −0.0389* | 0.06597* | 0.0396* | 0.0506* |
| ALE2 | 0.0008*** | 0.0001 | 0.0002* | −0.0004 | −0.0003* | −0.0003 |
| ALE Turning Point | 75 | 105 | 80 | 78 | 74 | 75 |
| Observations | 12 919 | 3627 | 2909 | 1660 | 2660 | 2,063 |
Note: Adjusted for child age(months), child sex (boy/girl), caregiver age (in years), caregiver literacy (illiterate/literate), household size, household SES (wealth index based on the household asset).
Appendix G.: Multivariate multilevel (child-household-village-district) regression analysis estimating the association between height-for-age z-score (HAZ) and average lifetime rainfall exposure (ALE) for children aged 0-59 months (main model) and stratified by age and sex (N = 12919 children).
| Main Model Coef. (SE) [95% CI] | Age: 0–23 months Coef. (SE) [95% CI] | Age: 24–59 months Coef. (SE) [95% CI] | Male Coef. (SE) [95% CI] | Female Coef. (SE) [95% CI] | |
|---|---|---|---|---|---|
| ALE | −0.1143*** | −0.0444*** | 0.0332* | −0.1053*** | −0.1117*** |
| (0.0084) | (0.0095) | (0.0191) | (0.0112) | (0.0120) | |
| [−0.1308, −0.0979] | [−0.0630, −0.0257] | [−0.0042, 0.0706] | [−0.1271, −0.0834] | [−0.1352, −0.0882] | |
| ALE2 | 0.0008*** | 0.0003*** | −0.0002* | 0.0007*** | 0.0008*** |
| (0.0001) | (0.0001) | (0.0001) | (0.0001) | (0.0001) | |
| [0.0006, 0.0009] | [0.0001, 0.0004] | [−0.0005, 0.0000] | [0.0005, 0.0009] | [0.0006, 0.0009] | |
| Child Age (mons) | −0.0253*** | −0.1122*** | 0.0102*** | −0.0275*** | −0.0231*** |
| (0.0007) | (0.0028) | (0.0016) | (0.0010) | (0.0011) | |
| [−0.0267, −0.0238] | [−0.1177, −0.1066] | [0.0070, 0.0134] | [−0.0295, −0.0255] | [−0.0252, −0.0211] | |
| Female (vs male) | 0.1881*** | 0.2439*** | 0.1489*** | NA | NA |
| (0.0251) | (0.0365) | (0.0299) | NA | NA | |
| [0.1389, 0.2373] | [0.1723, 0.3155] | [0.0902, 0.2076] | NA | NA | |
| Household size (per person) | −0.0132*** | −0.0038 | −0.0194*** | −0.0121** | −0.0164*** |
| (0.0041) | (0.0059) | (0.0046) | (0.0053) | (0.0058) | |
| [−0.0213, −0.0051] | [−0.0153, 0.0078] | [−0.0284, −0.0104] | [−0.0226, −0.0017] | [−0.0278, −0.0050] | |
| Caretaker age (per year) | 0.0050** | −0.0001 | 0.0107*** | 0.0031 | 0.0069** |
| (0.0021) | (0.0030) | (0.0025) | (0.0029) | (0.0031) | |
| [0.0008, 0.0091] | [−0.0060, 0.0058] | [0.0059, 0.0156] | [−0.0024, 0.0087] | [0.0009, 0.0130] | |
| Caretaker literacy (Literate vs illiterate) | 0.0642* | 0.0509 | 0.0665 | 0.0500 | 0.1037** |
| (0.0344) | (0.0469) | (0.0410) | (0.0461) | (0.0494) | |
| [−0.0031, 0.1316] | [−0.0411, 0.1428] | [−0.0139, 0.1468] | [−0.0404, 0.1404] | [0.0069, 0.2005] | |
| Wealth index (per score-point) | 0.0557*** | 0.0427** | 0.0594*** | 0.0475** | 0.0760*** |
| (0.0158) | (0.0215) | (0.0181) | (0.0204) | (0.0223) | |
| [0.0248, 0.0865] | [0.0005, 0.0849] | [0.0239, 0.0948] | [0.0075, 0.0875] | [0.0323, 0.1198] | |
| Constant | 3.4852*** | 2.0884*** | −3.3922*** | 3.6290*** | 3.3588*** |
| (0.2887) | (0.3296) | (0.6640) | (0.3796) | (0.4110) | |
| [2.9194, 4.0510] | [1.4423, 2.7345] | [−4.6937, −2.0907] | [2.8849, 4.3730] | [2.5532, 4.1645] | |
| Random Component | |||||
| Household ICC | 0.141 | 0.237 | 0.145 | 0.134 | 0.122 |
| Village ICC | 0.047 | 0.079 | 0.031 | 0.039 | 0.040 |
| District ICC | 0.014 | 0.035 | 0.005 | 0.010 | 0.010 |
| Model Parameter | |||||
| N | 12 919 | 6536 | 6383 | 6510 | 6409 |
| aic | 46 027.755 | 23 766.915 | 20 463.653 | 22 863.166 | 23 269.940 |
| bic | 46 124.819 | 23 855.121 | 20 551.551 | 22 944.539 | 23 351.126 |
Coef. = coefficient; SE = standard error in parenthesis; aic = Akaike information criterion; ICC = Intra class correlation; ***p < 0.01; **p < 0.05; *p < 0.10.
Appendix H.: Multivariate multilevel mixed-effects regression model (child-household-village-district) estimating the association between height-for-age z-score (HAZ) and lifetime cumulative rainfall (LCR) stratified by sex and by wealth quintile (N = 12 919 children)
| Poorest Q1 Coef. (se) [95% CI] | Poorer Q2 Coef. (se) [95% CI] | Poor Q3 Coef. (se) [95% CI] | Less Poor Q4 Coef. (se) [95% CI] | Least Poor Q5 Coef. (se) [95% CI] | |
|---|---|---|---|---|---|
| ALE | −0.1031*** | −0.1203*** | −0.1090*** | −0.0957*** | −0.1032*** |
| (0.0173) | (0.0175) | (0.0174) | (0.0197) | (0.0175) | |
| [−0.1370, −0.0692] | [−0.1546, −0.0860] | [−0.1431, −0.0748] | [−0.1344, −0.0570] | [−0.1375, −0.0688] | |
| ALE2 | 0.0007*** | 0.0008*** | 0.0007*** | 0.0007*** | 0.0007*** |
| (0.0001) | (0.0001) | (0.0001) | (0.0001) | (0.0001) | |
| [0.0005, 0.0010] | [0.0006, 0.0011] | [0.0005, 0.0010] | [0.0004, 0.0009] | [0.0005, 0.0010] | |
| Child Age (mons) | −0.0269*** | −0.0272*** | −0.0238*** | −0.0234*** | −0.0237*** |
| (0.0016) | (0.0017) | (0.0016) | (0.0016) | (0.0016) | |
| [−0.0301, −0.0237] | [−0.0305, −0.0240] | [−0.0269, −0.0207] | [−0.0265, −0.0203] | [−0.0268, −0.0206] | |
| Female (vs male) | −0.2102*** | −0.2080*** | −0.1419** | −0.2107*** | −0.1704*** |
| (0.0571) | (0.0575) | (0.0564) | (0.0552) | (0.0552) | |
| [−0.3222, −0.0982] | [−0.3207, −0.0953] | [−0.2525, −0.0313] | [−0.3188, −0.1026] | [−0.2786, −0.0623] | |
| Household size (per person) | −0.0026 | −0.0006 | −0.0127 | −0.0241*** | −0.0177** |
| (0.0126) | (0.0103) | (0.0103) | (0.0083) | (0.0070) | |
| [−0.0273, 0.0221] | [−0.0207, 0.0195] | [−0.0329, 0.0075] | [−0.0403, −0.0078] | [−0.0315, −0.0040] | |
| Caretaker age (per year) | −0.0021 | 0.0023 | 0.0032 | 0.0113** | 0.0071 |
| (0.0051) | (0.0050) | (0.0050) | (0.0045) | (0.0045) | |
| [−0.0121, 0.0079] | [−0.0075, 0.0121] | [−0.0066, 0.0129] | [0.0024, 0.0201] | [−0.0016, 0.0159] | |
| Caretaker literacy (Literate vs illiterate) | 0.1811** | −0.0414 | 0.1231 | 0.0491 | 0.0642 |
| (0.0824) | (0.0825) | (0.0796) | (0.0734) | (0.0687) | |
| [0.0196, 0.3425] | [−0.2031, 0.1203] | [−0.0330, 0.2791] | [−0.0948, 0.1929] | [−0.0706, 0.1989] | |
| Wealth index (per score-point) | 0.2363** | −0.0922 | 0.0420 | −0.0014 | 0.1668** |
| (0.1011) | (0.1908) | (0.2101) | (0.1680) | (0.0706) | |
| [0.0382, 0.4344] | [−0.4661, 0.2817] | [−0.3697, 0.4538] | [−0.3307, 0.3280] | [0.0284, 0.3053] | |
| Constant | 3.7359*** | 3.9793*** | 3.5087*** | 3.0078*** | 3.0256*** |
| (0.6110) | (0.6046) | (0.6019) | (0.6764) | (0.6114) | |
| [2.5383, 4.9335] | [2.7944, 5.1642] | [2.3290, 4.6885] | [1.6820, 4.3336] | [1.8274, 4.2239] | |
| Random Component | |||||
| Household ICC | 0.136 | 0.107 | 0.187 | 0.129 | 0.103 |
| Village ICC | 0.036 | 0.052 | 0.043 | 0.039 | 0.036 |
| District ICC | 0.005 | 0.015 | 0.010 | 0.005 | 0.004 |
| Model Parameter | |||||
| N | 2605 | 2593 | 258 | 2580 | 2554 |
| aic | 9398.740 | 9382.686 | 9266.364 | 9134.213 | 8985.484 |
| bic | 9474.988 | 9458.874 | 9342.522 | 9210.335 | 9061.475 |
Coef. = coefficient; SE = standard error in parenthesis; aic = Akaike information criterion; ICC = Intra class correlation; ***p < 0.01; **p < 0.05; *p < 0.10.
Appendix I.: Multivariate multilevel (child-household-village-district) regression analysis estimating the association between height-for-age z-score (HAZ) and average lifetime rainfall exposure (ALE) for children aged 13–59 months (N = 8981 children) and aged 18–59 months (N = 7845 children).
| Age: 13–59 months Coef. (SE) | [95% CI] | Age: 18–59 months Coef. (SE) | [95% CI] | |
|---|---|---|---|---|
| ALE | 0.0008 | [−0.0267,0.0283] | 0.0228 | [−0.0124,0.0580] |
| (0.0140) | (0.0180) | |||
| ALE2 | 0.0000 | [−0.0002,0.0002] | −0.0002 | [−0.0004,0.0001] |
| (0.0001) | (0.0001) | |||
| Child Age (mons) | 0.0035*** | [0.0016,0.0054] | 0.0057*** | [0.0035,0.0079] |
| (0.0010) | (0.0011) | |||
| Female (vs male) | 0.1601*** | [0.1085,0.2117] | 0.1469*** | [0.0923,0.2016] |
| (0.0263) | (0.0279) | |||
| Household size (per person) | −0.0170*** | [−0.0255,-0.0086] | −0.0193*** | [−0.0280,-0.0105] |
| (0.0043) | (0.0045) | |||
| Caretaker age (per year) | 0.0082*** | [0.0039,0.0126] | 0.0097*** | [0.0051,0.0142] |
| (0.0022) | (0.0023) | |||
| Caretaker literacy (Literate vs illiterate) | 0.0754** | [0.0037,0.1470] | 0.0712* | [−0.0045,0.1468] |
| (0.0366) | (0.0386) | |||
| Wealth index (per score-point) | 0.0660*** | [0.0334,0.0986] | 0.0590*** | [0.0250,0.0931] |
| (0.0166) | (0.0174) | |||
| Constant | −2.0296*** | [−3.0163,-1.0430] | −2.7828*** | [−4.0059,-1.5596] |
| (0.5034) | (0.6241) | |||
| Random Component | ||||
| Household ICC | 0.1928 | 0.1896 | ||
| Village ICC | 0.0308 | 0.0313 | ||
| District ICC | 0.0021 | 0.0031 | ||
| Model Parameter | ||||
| N | 8981 | 7845 | ||
| aic | 29 622.562 | 25 705.369 | ||
| bic | 29 714.899 | 25 795.948 |
SE = standard error in parenthesis; aic = Akaike information criterion; ICC = Intra class correlation; ***p < 0.01; **p < 0.05; *p < 0.10.
Appendix J.: Summary table.
| Region | District | Observations | Households | Villages | Total Rainfall (09/2011 to 06/2017 | Mean Lifetime Cumulative Rainfall | Stunting Prevalence | Pearson correlation between individual-level ALE and HAZ | Multilevel regression estimating the association between ALE and HAZ score |
|---|---|---|---|---|---|---|---|---|---|
| Nord | Ouahigouya | 1589 | 907 | 64 | 3776.868 | 2025.289 | 24.61 | −0.0019 | −0.016*** |
| Centre-Nord | Koudougou | 1363 | 753 | 54 | 4672.186 | 2560.138 | 24.36 | 0.0123 | −0.010* |
| Centre-Nord | Kaya | 1273 | 697 | 54 | 3788.02 | 2184.06 | 23.40 | −0.0133 | −0.019*** |
| Boucle Du Mouhoun | Nouna | 1052 | 606 | 44 | 4162.707 | 2109.48 | 26.43 | −0.2570* | −0.029*** |
| Centre-Nord | Kongoussi | 813 | 462 | 34 | 3574.392 | 1913.071 | 23.99 | 0.1799* | 0.012* |
| Boucle Du Mouhoun | Solenzo | 816 | 459 | 33 | 4812.542 | 2599.569 | 19.73 | −0.2984* | −0.032*** |
| Centre-Est | Ouargaye | 695 | 380 | 27 | 4813.238 | 2686.682 | 27.34 | −0.0798* | −0.021*** |
| Centre-Est | Tenkodogo | 588 | 322 | 23 | 4721.411 | 2677.968 | 21.77 | 0.0455* | −0.011 |
| Centre-Ouest | Reo | 473 | 233 | 16 | 4620.539 | 2501.345 | 21.78 | −0.0067 | −0.003 |
| Nord | Yako | 447 | 221 | 15 | 4025.603 | 2208.765 | 26.62 | −0.0850* | −0.018** |
| Sud-Ouest | Diebougou | 429 | 257 | 19 | 6003.932 | 3096.065 | 21.45 | −0.1056* | −0.022*** |
| Centre-Ouest | Sapouy | 406 | 212 | 18 | 5234.156 | 3049.646 | 22.17 | 0.0699* | −0.001 |
| Plateau Central | Ziniare | 346 | 206 | 20 | 4193.285 | 2266.147 | 26.59 | −0.0254 | −0.018* |
| Boucle Du Mouhoun | Toma | 287 | 144 | 11 | 4234.200 | 2286.447 | 29.62 | −0.1328* | −0.033*** |
| Plateau Central | Bousse | 287 | 150 | 13 | 4239.325 | 2357.99 | 26.83 | 0.0784* | 0.011 |
| Boucle Du Mouhoun | Boromo | 251 | 151 | 11 | 5216.097 | 2713.527 | 19.52 | −0.1681* | −0.018** |
| Centre-Sud | Manga | 244 | 129 | 9 | 4864.161 | 2729.371 | 18.85 | −0.0971* | −0.027** |
| Centre-Ouest | Nanoro | 168 | 87 | 6 | 4255.278 | 2269.761 | 30.95 | 0.0772* | −0.003 |
| Sud-Ouest | Batie | 190 | 104 | 9 | 5436.186 | 2691.123 | 20.53 | −0.0097 | −0.011 |
| Centre-Nord | Barsalgho | 112 | 53 | 5 | 3219.793 | 1817.515 | 31.25 | 0.1443* | 0.042* |
| Sud-Ouest | Dano | 103 | 59 | 4 | 5488.756 | 2977.815 | 26.21 | −0.1077* | −0.018 |
| Sud-Ouest | Gaoua | 104 | 64 | 5 | 5916.999 | 3008.594 | 19.23 | −0.0238 | −0.010 |
| Centre-Est | Zabre | 77 | 42 | 3 | 4897.705 | 2741.439 | 10.39 | 0.2619* | 0.013 |
| Nord | Gourcy | 806 | 408 | 29 | 3938.851 | 2203.253 | 20.47 | −0.0136 | −0.010 |
Note: Pearson correlation significant at 5%. Multilevel regression was adjusted for child age(months), child sex (boy/girl), caregiver age (in years), caregiver literacy (illiterate/literate), household size, household SES (wealth index based on the household asset) ***p < 0.01; **p < 0.05; *p < 0.10.
Footnotes
- 9
In 2014, after the baseline survey, the government split some study districts, which increased the study districts from 24 in the baseline survey to 29 in the endline. However, the endline survey in 2017 maintained the designation of the old health districts [24] for consistency.