

Abstract
Child undernutrition is still a major public health concern in Bangladesh in spite of significant decline in the last few years. Climate change may impact the prevalence of undernutrition and its geographical variability through food security and recurring outbreaks of disease, as well as impede efforts to reduce the undernutrition burden. This study aims to evaluate rainfall and temperature associated with childhood malnutrition in Bangladesh. A spatial mixed effect logistic regression model was used to estimate the association between undernutrition (measured by the composite index of anthropometric failure) and residential area-level rainfall and temperatures, controlling for covariates and spatial effects of residential locations using national data from the 2017 to 2018 Bangladesh Demographic and Health Survey. Our findings indicate that an increase in rainfall was associated with increased odds of undernutrition [adjusted odds ratio (AOR) 1.15, 95% confidence interval (CI) 1.07–1.24], whereas an increase in temperature was associated with decreased odds of undernutrition (AOR 0.86, 95% CI 0.80–0.93). We also found statistically significant structured and unstructured spatial variations in undernutrition, indicating locational effects. Investing in infrastructure and education could be potential strategies for mitigating the negative effects of climate change. High-risk regions in terms of climatic change and malnutrition could be given priority for intervention implementation.
Export citation and abstract BibTeX RIS

Original content from this work may be used under the terms of the Creative Commons Attribution 4.0 license. Any further distribution of this work must maintain attribution to the author(s) and the title of the work, journal citation and DOI.
1. Introduction
Childhood undernutrition, including underweight, stunting, and wasting, contributes significantly to the global disease burden [1]. In 2020, an estimated 149 million children under five were stunted, while 45 million were wasted [2]. Undernutrition is associated with an increase in diarrhoeal, respiratory, and infection-related mortality [3], as well as developmental delay in children [4]. Undernutrition is associated with 45% of deaths in under five aged children [2]. Low and middle income countries (LMICs) bear the greatest global burden of childhood undernutrition.
Bangladesh, a LMIC in South Asia, has a population of over 165 million in 2022, with under five children accounting for approximately 9.4% of the total population [5]. Despite a reduction in the prevalence of different forms of undernutrition in Bangladesh over time, such as stunting which decreased from 51% in 2004%–31% in 2017–18, underweight from 43% to 22%, and wasting from 15% to 8% among children under the age of five [6], child undernutrition remains a significant public health issue.
The three frequently used indicators for stunting, underweight and wasting may overlap (i.e. a child may be simultaneously stunted, wasted, and underweight) [7], and therefore using them independently to estimate the undernutrition prevalence may not provide a comprehensive picture [8, 9]. A joint indicator of undernutrition [i.e. the composite index of anthropometric failure (CIAF)] can estimate the prevalence of childhood undernutrition as well as provide a better understanding of the overall burden of undernutrition [10]. Using this comprehensive indicator, a child's undernutrition status can be determined as stunted, underweight, wasted, or any combination of the three. A recent study used this composite index to estimate the prevalence of childhood undernutrition in Bangladesh revealed that one in two children under the age of five is undernourished (as measured by CIAF) [11]. The prevalence of undernutrition varied across regions, with the Sylhet division having the highest prevalence (57%) and the Khulna division having the lowest (42.0%) [11].
Undernutrition among children is the consequence of several interrelated immediate and distal factors including sociodemographic, feeding practices, disease status, food security, health service accessibility, caregivers' skills, and capacity to deliver adequate nutrition practises, and environmental features (e.g. socio-cultural, climate) [12]. Most of the studies have focused on sociodemographic aspects of undernutrition in children. However, according to the World Health Organisation and the Intergovernmental Panel for Climate Change, climate change has the greatest impact on children's health and undernutrition [13] by affecting food security, disease transmission, and water availability.
Food security is a multi-faceted and interrelated concept that includes not just the availability of food but also its stability, accessibility, and utilisation [14, 15]. All dimensions of food security impacted by climate change may result in undernutrition among children. For instance, evidence suggests that caloric deficiency resulting from food insecurity is a contributor to undernutrition [3]. Additionally, environmental factors such as temperature, rainfall, and humidity can influence the pathogens that cause childhood diarrhoea [16], which can in turn cause undernutrition in children [17]. Research, for example, has shown that diarrhoea increases the risk of stunting in children [18]. Either directly or indirectly, climate change influences the nutritional status of children.
Bangladesh is one of the most climate-vulnerable countries in the world owing to its geographical location. According to the Climate Risk Index-2021, Bangladesh confronted 185 extreme weather events (2000–2019) due to climate change [19]. In terms of food security, a substantial risk is expected because of its higher reliance on climate-sensitive industries including agriculture and fishery [20]. This county has been experiencing changes in climatic conditions over time. The average temperature has risen by 0.5 °C between 1976 and 2019. Future projections suggest that the average annual temperature and rainfall would increase by 1.4 °C and nearly 74 mm respectively by 2050 [21].
Climate change may hinder the efforts undergoing to combat child undernutrition via food security and prevention of early childhood illness (e.g. diarrhoea). For example, following the early monsoon flash flood, research indicated a significant rise in household food insecurity among wetland (Haor) communities in the north-eastern area of Bangladesh [22]. A study showed that a greater number of heavy rain days and hot days increased the risk of childhood diarrhoea in Bangladesh [23]. Research also suggests that climate change will impede progress towards reducing childhood undernutrition in many countries, and a future with moderate or severe climate change impacts is more likely to increase the number of undernourished children than a future without climate change [24].
There has been little research exploring the link between climatic conditions and undernutrition [25–35]. Most of these studies evaluated different indicators of undernutrition separately in relation to climatic characteristics; no studies have evaluated the impact of climate-related factors on the combined burden of undernutrition (as measured by CIAF) in developing countries such as Bangladesh. Most of these investigations relied on traditional regression models, whereas spatial models have been utilised in a relatively limited number of studies [25–32]. The issue with traditional models is that they are unable to account for the influence of location when evaluating location-related characteristics. Even though a multilevel model can adapt to area-level variation, it does not consider spatial relationships between areas, fails to provide comprehensive information on the spatial distribution of outcomes, and is unable to distinguish between unstructured and structured spatial effects [36–38]. Structured spatial effect considers the hypothesis that closely spaced areas are more likely to be correlated in terms of the prevalence of childhood undernutrition. In contrast, unstructured spatial effect accounts for spatial variation owing to the effects of unobserved area-level factors that are not related to nearby areas [39]. When spatial autocorrelation, effects, and potential sources of spatial variation are ignored, the significance level of area effects may be overestimated. This, in turn, can lead to incorrect inferences, which can mislead those responsible for formulating policy to reduce malnutrition among children.
This study used data from the 2017–2018 Bangladesh Demographic and Health Survey (BDHS) to examine the relationship between undernutrition (according to the CIAF) and environmental variables (temperature and rainfall). This study addressed the following research questions: Do the rainfall and temperature of residential areas influence childhood undernutrition? Does the residential location have any influence on undernutrition?
2. Methods
2.1. Data
This study analysed secondary data from the 2017–18 BDHS. To collect a nationally representative sample, this survey employed a two-stage stratified cluster sampling procedure. Using the probability proportional to cluster size method, in the first stage of sampling this survey chose 675 survey clusters (also called primary sampling units) [6]. However, the survey was only completed in 672 clusters (249 in cities and 423 in rural areas), and three clusters were left out because they were impacted by floods. In the second stage of sampling, on average, 30 households were selected randomly from each cluster using a systematic sampling technique [6]. A total of 19 457 out of 20 160 selected households were successfully surveyed (household response rate = 96.5%) [6]. Standard questionnaires (e.g. household questionnaire for selected households, woman's or man's questionnaire for eligible individuals, and biomarker questionnaire for selected individuals), as well as standard tools, were used to measure the anthropometrics (i.e. electronic SECA 878 scales for weight, Shorr boards for height) and biomarkers (i.e. the LIFE SOURCE UA-767 Plus BP monitor, the HemoCue 201 RT analyser) [6]. In addition, this survey collected the geo-coded locations of the survey clusters' centroids, as depicted in figure 1. In order to ensure confidentiality, the survey authority randomly displaced these locations. Urban locations had a maximum displacement of 2 km, while rural locations were displaced up to 5 km (with only 1% experiencing displacement up to 10 km). The DHS authority derived environmental features (such as temperature and rainfall levels) at the cluster level using these locations. The cluster identity number was used to create a link between geo-covariate data and individual-level data.

Figure 1. Geocoded locations of survey clusters in the BDHS 2017–18 on a district map of Bangladesh (left); and stochastic partial differential equations (SPDEs) mesh (lines) combined with the survey cluster locations (right). The SPDE mesh discretises a continuous spatial domain into interconnected triangles for statistical modelling.
Download figure:
Standard image High-resolution imageThis study examined the nutritional status of under-5 year-old children using the CIAF. Research suggests a list of anthropometric failure subgroups (A to F and Y): (A) no failure; (B) wasting only; (C) wasting and underweight; (D) wasting, stunting, and underweight; (E) stunting and underweight; (F) stunting only; and (Y) underweight only [10, 11, 40]. Children are considered undernourished if they have any anthropometric failing (B to F and Y), according to the CIAF; otherwise, they are not undernourished [10, 11, 40]. In this survey, anthropometric measurements of children under the age of five were taken with standard instruments by qualified personnel [6]. This survey used electronic SECA 878 scales to obtain weight measurements, while height measurements were conducted using Shorr boards. The presence or absence of stunting, wasting, or underweight was determined by whether or not the children had a height-for-age, weight-for-height, or weight-for-age z-score that was less than −2 standard deviations from the World Health Organisation's reference median [6].
The average annual rainfall [millimetres (mm)] was used to measure the rainfall variable in this survey. Data were derived from the Climate Hazards Group InfraRed Precipitation with Station version 2.0 dataset [41]. The temperature variable was measured using the average monthly temperature (in degrees Celsius) derived from the WorldClim Version 2 dataset [41]. Survey cluster-level (i.e. residential area-level) rainfall and temperature data were available for 5 year intervals (e.g. 2005, 2010, and so on), and we used 2017 data interpolated from 2010, 2015, and 2020 data because it was the year closest to the survey year. An earlier study [28], extracted environmental variables close to the survey year using the interpolation method. A set of covariates was considered as adjusted variables suggested by earlier literature [25, 28, 33, 35]. We included child age (month), child sex (boys, girls), child fever (yes, no), diarrhoea (yes, no), child breastfeeding status (yes, no), mother's age (year), mother's education (no education, primary, secondary, and higher), mother's body mass index (BMI; kg m−2), household size, household wealth status (poorest, poorer, middle, richer, and richest), household source of water (improved, unimproved), material of floor (natural/rudimentary/others, finished), and place of residence (urban, rural). The survey authority calculated a wealth index score using principal component analysis on household features and assets, and then divided household wealth scores into quintiles: poorest, poorer, middle, richer, and richest [6]. This survey collected data on household floor material and drinking water source. In this study, the household floor material was divided into 'finished' (ceramic tiles, cement, carpet, and vinyl or asphalt strips) and 'natural/rudimentary/others' (earth/sand, dung, wood planks, palm/bamboo, and others). Household drinking water sources were categorised as 'improved' (piped water, tube-well/borehole, protected well, protected spring, rainwater, and bottled water) or 'unimproved' (unprotected wells, unprotected springs, tanker truck, cart with tank/drum, and surface water). This survey asked mothers if their child had diarrhoea or fever in the 2 weeks before the interview [6]. The children were classified as 'yes' if they had diarrhoea or a fever and 'no' otherwise.
Among the respondents, anthropometric data were available for 7806 children. We excluded those who were twins (n = 129), those who were not usual residents of the household (n = 857), those for whom mothers' BMI values were not available (n = 16), and those for whom data on fever status was not available (n = 3). Following exclusion, the analytical sample comprised 6801 respondents residing in 672 survey clusters.
2.2. Statistical analysis
A descriptive analysis of the analytic sample was performed. To assess the association between rainfall, temperature, and childhood undernutrition, a spatial mixed effect logistic regression was used, which was a generalised linear model with a logit link adjusted for structural and unstructured spatial effects, which helped to adjust and estimate the within-area correlation and between-area variation. This model was adjusted for a set of covariates.
The binary response variable  represents the undernutrition status of children based on the CIAF, where
  refers to the any anthropometric failure, i.e. undernourished children and
  refers to the child does not belong to an undernutrition group. The probability of a child being undernourished is represented by
  . By defining demographic and socio-economic variables as
  and the environmental factors
  , we write the conditional distribution of
  given
given  and
and  follows Bernoulli distribution as:
The measurements of the variables are observed in spatial clusters; hence we include the spatial random field in the modelling using a spatial random effect logistic model. Hence, we write
where  is the functional form of the fixed effect part of the model. In this paper, we used a linear function to represent the demographic, socio-economic and environmental variables and hence write
  . Here,
  and
and  are the parameters corresponding to the variables
  and
and  . The term
  is defined as the spatial random effect. As indicated earlier, we further adjusted the spatial random effect by identifying the structured and unstructured spatial effects, such that
  ; where
  is the cluster level design matrix and we define
  as the unstructured and
  as the structured spatial effects respectively. Here, we define
  as is a sparse precision matrix that follows a Gaussian Markov random field [42]. Using stochastic partial differential equations (SPDE) approach [43], we define a set of knots to estimate the precision matrix using Matern covariance function [42]. In this paper, we use a cross-validation method to select the optimal number of knots. For optimisation, we use the automatic differentiation and Laplace approximation [44], which is one of the fastest optimisation methods for complex non-linear random effect models [45]. The SPDE mesh was constructed to depict the spatial process, and the k-means method was utilised to identify the locations of knots (figure 1).
A two-step modelling approach was employed: (1) rainfall adjusted for covariates and spatial effects; (2) temperature adjusted for covariates and spatial effects. Due to their high correlation (i.e. correlation coefficient = 0.69), rainfall and temperature, were assessed separately. To perform all analyses, we used R programming language.
3. Results
The distribution of variables evaluated in this study is shown in table 1. A total of 6801 children between the ages of 0 and 59 months were analysed in this study, with the majority of them being boys (52.4%) and an average age of 29.4 months (SD 17.5). Most of the participants were from poor households (43%), were located in rural areas (65%), had access to improved drinking water sources, and had natural or rudimentary flooring in their homes. The mothers of the children were on average 26.0 years old (SD 5.7), and 47% of them had a high school education. At the time of the survey interview, 58.6% of children were breastfed. About 33.7% and 5.2% of children, respectively, had fever and diarrhoea in the 2 weeks prior to the survey date. More than 39% of children were undernourished (as measured by CIAF), and mothers average BMI was 22.6 kg m−2 (SD 4.0). Children and mother pairs residing in areas with a mean average monthly temperature of 24.9 °C (SD 0.9) and a mean average annual rainfall of 2735.9 mm (SD 864.5).
Table 1. Distribution of all variables and bivariate relationship between undernutrition and exposures or covariates.
| All | Undernutrition defined by CIAF |
P-value | ||
|---|---|---|---|---|
| Total | No | Yes | ||
| 6801 | 4132 (60.8%) | 2669 (39.2%) | ||
| Child age | <0.001 | |||
| Mean (SD) | 29.38 (17.47) | 28.581 (18.026) | 30.62 (16.51) | |
| Chid sex | 0.553 | |||
| Girl | 3236 (47.6%) | 1978 (61.1%) | 1258 (38.9%) | |
| Boy | 3565 (52.4%) | 2154 (60.4%) | 1411 (39.6%) | |
| Child fever | <0.002 | |||
| No | 4512 (66.3%) | 2801 (62.1%) | 1711 (37.9%) | |
| Yes | 2289 (33.7%) | 1331 (58.1%) | 958 (41.9%) | |
| Child diarrhoea | 0.274 | |||
| No | 6450 (94.8%) | 3909 (60.6%) | 2541 (39.4%) | |
| Yes | 351 (5.2%) | 223 (63.5%) | 128 (36.5%) | |
| Child breastfeeding status | 0.570 | |||
| No | 2815 (41.4%) | 1699 (60.4%) | 1116 (39.6%) | |
| Yes | 3986 (58.6%) | 2433 (61.0%) | 1553 (39.0%) | |
| Mother's age | 0.303 | |||
| Mean (SD) | 26.05 (5.70) | 25.99 (5.60) | 26.14 (5.84) | |
| Mother's education | <0.001 | |||
| Higher | 1065 (15.7%) | 825 (77.5%) | 240 (22.5%) | |
| No education | 520 (7.6%) | 245 (47.1%) | 275 (52.9%) | |
| Primary | 2020 (29.7%) | 1089 (53.9%) | 931 (46.1%) | |
| Secondary | 3196 (47.0%) | 1973 (61.7%) | 1223 (38.3%) | |
| Mother's BMI | <0.001 | |||
| Mean (SD) | 22.59 (4.03) | 23.09 (4.04) | 21.82 (3.88) | |
| Household size | 0.151 | |||
| Mean (SD) | 5.75 (2.54) | 5.72 (2.51) | 5.81 (2.59) | |
| Household wealth status | <0.001 | |||
| Middle | 1223 (18.0%) | 753 (61.6%) | 470 (38.4%) | |
| Poorer | 1350 (19.9%) | 723 (53.6%) | 627 (46.4%) | |
| Poorest | 1551 (22.8%) | 789 (50.9%) | 762 (49.1%) | |
| Richer | 1361 (20.0%) | 870 (63.9%) | 491 (36.1%) | |
| Richest | 1316 (19.4%) | 997 (75.8%) | 319 (24.2%) | |
| Household water source | 0.045 | |||
| Unimproved | 153 (2.2%) | 81 (52.9%) | 72 (47.1%) | |
| Improved | 6648 (97.8%) | 4051 (60.9%) | 2597 (39.1%) | |
| Household floor material | <0.001 | |||
| Natural/rudimentary/others | 4369 (64.2%) | 2449 (56.1%) | 1920 (43.9%) | |
| Finished | 2432 (35.8%) | 1683 (69.2%) | 749 (30.8%) | |
| Place of residence | <0.001 | |||
| Rural | 4436 (65.2%) | 2576 (58.1%) | 1860 (41.9%) | |
| Urban | 2365 (34.8%) | 1556 (65.8%) | 809 (34.2%) | |
| Area-level rainfall (mm) | <0.001 | |||
| Mean (SD) | 2735.89 (864.55) | 2671.65 (831.77) | 2835.29 (904.18) | |
| Range | 1527.07–5620.38 | 1527.07–5620.38 | 1527.07–5620.38 | |
| Area-level temperature (°C) | <0.001 | |||
| Mean (SD) | 24.86 (0.86) | 24.94 (0.81) | 24.74 (0.92) | |
| Range | 21.06–26.29 | 21.06–26.29 | 21.06–26.29 | |
a P-values are derived from ANOVA tests for continuous variables and Chi-square tests for categorical variables.
Table 1 also demonstrates the bivariate relationship between exposures and covariates and undernutrition status. Undernutrition status was statistically significantly associated with children's age, child fever, mothers' education, mothers' BMI, household wealth status, household water source, household floor materials, place of residence, area-level rainfall and temperature.
The average age of undernourished children was 30.6 months (SD 16.5). Children with fever had a 4% point higher prevalence of undernutrition than children who did not have fever. The prevalence of undernourished children decreased with their mothers' education level, from 52.9% among children with non-educated mothers to 22.5% among those with higher educated mothers. The average BMI of undernourished children's mothers was 21.8 kg m−2 (3.9). The prevalence of undernutrition decreased as household wealth increased. Children in households with unimproved water sources had an 8% point higher prevalence of undernutrition than children in households with improved water sources. Similarly, the percentage of undernourished children living in households with natural or rudimentary floor material types was 13% points higher than that for children living in households with finished floor material types. Rural children had a higher prevalence of undernutrition than urban children. Undernourished children lived in areas with a mean annual rainfall of 2835.3 mm (904.2) and a mean monthly temperature of 24.7 °C (0.9).
The results of the fitted multivariable model are shown in table 2. Rainfall had a significant positive effect on the odds of being undernourished (AOR 1.15, 95% CI 1.07–1.24). An increase (i.e. SD because we used scaled rainfall in the model) in residential area average annual rainfall was associated with a 15% higher odds of childhood undernutrition. The effect of rainfall on undernutrition was statistically significant because the 95% CI 1.07–1.24 did not contain 1. The temperature odds ratio for undernutrition was 0.86 (95% CI 0.80–0.93), implying that increasing average monthly temperature (i.e. by SD) was associated with 14% lower odds of having undernutrition among children.
Table 2. Multivariable spatial mixed effect logistic model relating rainfall and temperature to childhood undernutrition adjusted for covariates.
| Undernutrition defined by the CIAF | ||||
|---|---|---|---|---|
| Exposures | AOR | 95%CI | AOR | 95%CI |
| Area-level rainfall (mm, scaled) | 1.15 | 1.07–1.24 | — | — |
| Area-level temperature (°C, scaled) | — | — | 0.86 | 0.80–0.93 |
| Spatial effect | Estimates | Estimates | ||
| Matern range | 0.16357 | 0.07–0.38 | 0.150988 | 0.06–0.37 |
| σO (spatial SD, structured) | 0.39724 | 0.23–0.67 | 0.405882 | 0.24–0.70 |
| σG (group SD, unstructured) | 0.16968 | 0.06–0.50 | 0.169964 | 0.06–0.50 |
AOR—Adjusted odds ratio; CI—confidence interval. Models are adjusted for covariates—child age, child sex, child fever, child diarrhoea, child breastfeeding status, mother's age, mother's education, mother's BMI, household size, household wealth status, household source of water, material of floor, and place of residence.
The effects of geographic location on undernutrition are shown in table 2. The unstructured and structured effects of location on undernutrition differ, with the structured effect being greater than the unstructured effect. Clusters of closely spaced areas were more likely to be correlated in terms of the prevalence of childhood undernutrition. There was significant spatial variation in the prevalence of undernutrition because of unobserved or unmeasured area-level environmental factors that were unrelated to nearby areas as indicated by unstructured effect.
Figures 2 and 3 depicts the geospatial variation based on rainfall and temperature model, respectively, in the predicted probability of undernutrition. These risk maps showed regions with a lower and higher risk of childhood undernutrition. The risk of childhood undernutrition was greatest in the north-eastern, south-eastern, and southern regions of Bangladesh. For example, children from Sunamganj and Sylhet districts exhibited a higher risk of undernutrition, whereas children from Jessore, Satkhira, and Khulna districts exhibited a lower risk.
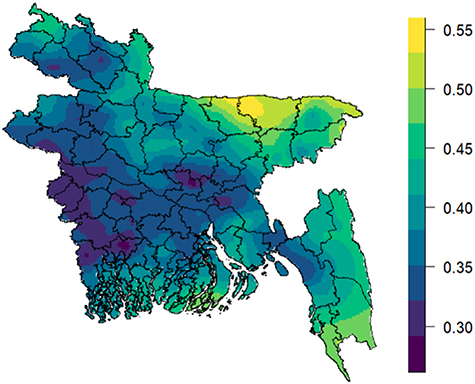
Figure 2. Predicted probability of undernutrition based on rainfall model (a lower risk of undernutrition is represented by a darker colour, while a higher risk is shown by a lighter colour).
Download figure:
Standard image High-resolution image
Figure 3. Predicted probability of undernutrition based on temperature model (a lower risk of undernutrition is represented by a darker colour, while a higher risk is shown by a lighter colour).
Download figure:
Standard image High-resolution image
4. Discussion
This study found a substantial association between rainfall and temperature with child undernutrition, as well as locational effects. This was a novel study because it explored the relationship between environmental factors and a composite measure of undernutrition (CIAF) instead of separate measures of undernutrition in the context of Bangladesh and capitalised an advanced modelling technique called the spatial mixed effects logistic regression modelling approach instead of the standard mixed effect logistic regression model or the spatial logistic regression model. The spatial mixed effect logistic regression model adjusts within- and between-area correlations, providing a more accurate estimate of standard errors of effects of risk factors (especially environmental variables), and drawing accurate statistical significance, which ultimately leads to correct inferences.
Our research reveals that a rise in precipitation and temperature has a significant association with childhood undernutrition, as partly supported by another research [25, 28, 34]. These findings are important because the effects of rainfall and temperature on child undernutrition (i.e. stunting, wasting, and underweight) have not been thoroughly investigated. Increased rainfall leads to an increase in childhood undernutrition, which is partly corroborated by previous studies in Bangladesh (demonstrating a non-linear link between rainfall and childhood stunting) [28], and Malawi (demonstrating a positive link between rainfall and stunting) [25]. However, this study did not find a nonlinear association between rainfall and childhood undernutrition. Rainfall, depending on its amount, pattern, and seasonality, can have both beneficial and negative effects on childhood undernutrition. Excessive rain could be a sign of potential flooding, which could disrupt food security [46], diminish dietary diversity, and increase the risk of diseases like diarrhoea, all of which could increase the risk of child undernutrition [47]. Floods can severely disrupt livelihoods of people. Flood-affected households face a slew of negative circumstances, including inadequate access to food due to crop loss, supply interruption, and an unexpected increase in food prices. Inadequate access to food may also result in a decline in the dietary diversity of children living in flood-affected households, which can have a negative impact on their nutritional status [47]. In addition, the episodes of diarrhoea and respiratory disease may increase during or after flooding due to water, sanitation and hygiene conditions, and health care seeking behaviour may change due to limited access to health care facilities, thus increasing the risk of childhood undernutrition [47]. Furthermore, shocks from heavy rains might exacerbate already-existing social disparities, for example, children born into more socially disadvantaged groups (e.g. poor households), are more likely to experience the greater effects of rainfall shocks than children born into less socially disadvantaged groups. This is because they may experience a greater loss of wealth when such shocks occur and may have fewer resources to deal with the negative effects of these shocks and to recover afterwards.
In contrast, our study reveals an inverse association between temperature and childhood undernutrition, meaning that a higher temperature is associated with a lower prevalence of undernutrition. This result is partly supported by prior research on temperature-stunting in Bangladesh [28]. Studies across nations that analysed temperature and other undernutrition indicators showed inconsistent results (i.e. some positives [25, 30, 31] and some negatives [26, 28]), but our study found a negative association, presumably because warming may have some beneficial effects on local agriculture. Specifically, higher temperatures may facilitate multiple cropping seasons per year, thereby enhancing agricultural production, improving food security, and influencing nutritional status of children. However, we could not generalise this result due to the limited research and inconsistent findings from other studies. According to research, a rise in temperature has a negative effect on crop productivity on a global scale [48], which may affect the diversity and quality of the human diet. Additionally, research shows that higher temperatures reduce children's diet diversity [49], and dietary diversity is associated with child nutrition status [50]. Mixed results for two important environmental factors warrant additional study.
Furthermore, this study found a notable spatial effect (i.e. residential location) on childhood undernutrition. The outcomes of mixed-effect spatial regression models suggest the existence of considerable spatial variation (i.e. structured random effects) and unstructured variation that may be attributable to unobserved factors [e.g. agricultural production in communities, household socioeconomic status (SES)]. Given that spatial variation is a few times greater than the remaining unstructured variation, unobserved factors may be more global than local. Such global spatial variation may be caused by, for example, the frequency of severe weather events and the loss of agricultural productivity at the community level (i.e. residential location). Mapping the predicted risk of child undernutrition helps policymakers in identifying high-priority areas for resource allocation. While the north-eastern region of Bangladesh exhibits lower income poverty compared to the south-western region [51], it also presents a higher prevalence of undernutrition and SES-related inequality in childhood undernutrition [52]. The study indicates that health disadvantages are spatially clustered, particularly in the north-eastern region. This may be due to specific environmental factors such as physical remoteness, inadequate transportation, substandard road infrastructure, wetland ecosystem, and conservative social norms [53]. These factors can affect the availability of food and resources that promote good health and enhance nutritional status of children. The potential negative effects of environmental factors on children's health could be exacerbated by climate variability, especially during flash floods (common in the north-eastern region) [54], when waterborne disease risk increases due to disruption in access to clean water and sanitation facilities, but communities are less likely to receive proper treatment due to limited accessibility to healthcare. Even though the prevalence of undernutrition among children in the south-western part of Bangladesh is low, this region's vast coastal areas make it vulnerable to natural hazards with rapid onset (e.g. cyclones) and slow onset (e.g. water salinity) [55, 56], which have a negative impact on population health. Therefore, it is essential to develop integrated strategies to reduce the vulnerability of various population groups, including children, and socially disadvantaged communities. This study offers recommendations for the use of geographical information during policy development, the use of spatial modelling when identifying risk factors for undernutrition, and the evaluation of additional environmental variables (including location) in future epidemiological research.
Given the future projections of changing climatic conditions in Bangladesh and the pace of reduction in undernutrition prevalence, the findings of this study could be impactful for climate-induced child undernutrition and future research. Importantly, most vulnerable children in terms of low SES as well as residing in climate-vulnerable regions (e.g. coastal regions) are likely to confront the greatest burden of climate-driven undernutrition. Moreover, in many regions, positive socioeconomic gains may not be sufficient to offset the negative effects of climate change, necessitating that all children be targeted during interventions [35]. For instance, targeted nutrition-sensitive interventions can be used to increase their resilience and reduce vulnerability. These interventions might include promoting climate-resistant crop varieties, irrigation, and cash transfers [35]. Policymakers should implement nutrition-specific interventions, such as nutritional education, in addition to the aforementioned initiatives [35]. Education and awareness-raising can equip individuals and communities with the necessary knowledge and skills to understand and address the impacts of the climate crisis. It is crucial for policymakers at all levels to obtain necessary information and resources to understand climate change, its impacts, and potential risk management strategies.
Even though this research has a list of strengths, it also has some weaknesses that are worth pointing out. Firstly, this was a cross-sectional study, so there was no way to establish the causal relationship. Secondly, this study has not explored the relationship between environmental factors and undernutrition longitudinally; this may be something that can be done in future research. Thirdly, this study examined survey-cluster level environmental features in relation to childhood undernutrition, and we anticipated that the values of these features at the household and survey cluster levels would be similar. However, this may not be true in all circumstances; consequently, additional research on the influence of a household-level environmental variable on undernutrition is required. More research is needed to explore these issues.
5. Conclusions
This study found a significant relationship between environmental characteristics and child undernutrition, as well as spatial effects in Bangladesh. Therefore, intervention efforts for combating child undernutrition should prioritise the most climate-vulnerable areas (e.g. flood-impacted, and coastal areas). Spatial effects, or the effects of places, need to be considered in analytical models to reduce bias. Assessing locational effects could be critical for understanding spatial variations and vulnerable areas while developing policies and interventions.
Acknowledgments
The authors would like to thank the organisation that conducted the survey and made the dataset publicly available.
Data availability statements
Survey data are available on request from the DHS program website (https://dhsprogram.com/Data), whereas environmental data are readily available from the DHS program (spatial data repository) website (https://spatialdata.dhsprogram.com/covariates/).
Conflict of interest
No potential conflict of interest.
Ethical approval
This study has utilised the publicly available secondary 2017–18 BDHS data, which was downloaded from the DHS program website (https://dhsprogram.com/Data) with permission. This survey received ethical approval from the ICF International Institutional Review Board and the Bangladesh Medical Review Council. Therefore, no further ethical clearance was required.
Funding
There is no funding associated with the work featured in this article.
Author contributors
JRK conceptualised the study, planned the data analysis, performed the analysis, and drafted the manuscript. KSB planned the data analysis, performed the analysis, and contributed to writing the manuscript. MSH offered intellectual input and provided critical revision. All authors have approved the final version of the manuscript for publication.