


Abstract
Satellite observations since the early 1980s have revealed a trend of 'Earth greening' across global terrestrial ecosystems. Dryland vegetation is more sensitive to climate change and human activities. China's drylands are among the largest in extent worldwide, and large-scale ecological restoration of these areas has been implemented since the late 1970s, which has resulted in more complicated but still poorly quantified vegetation dynamics. To figure out the vegetation dynamics and associated driving forces, we provide an assessment of the vegetation dynamics from 1982 to 2015 using the CO2 fertilization effect function, principal component regression, Residual Trend analysis, and Breaks For Additive Seasonal and Trend methods based on the ERA5 climate factors and GIMMS 3.1 normalized difference vegetation index datasets. This study shows that anthropogenic impacts and CO2 fertilization have jointly led to vegetation greening in China's drylands since the 1980s, and ecological restoration has accelerated this greening since the 2000s. The results show that the vegetation greening in China's drylands (41.51% of the study area, +0.60 × 10⁻³ yr−1) is mainly driven by CO2 fertilization (+0.55 × 10⁻³ yr−1) and anthropogenic activities (+0.12 × 10⁻³ yr−1). The anthropogenic effects are especially higher on the Loess Plateau (+1.01 × 10⁻³ yr−1) and the Three-North region (+0.23 × 10⁻³ yr−1). The vegetation dynamics shifts in 6.73% (31.64 Mha) of China's drylands were directly attributed to anthropogenic impacts around the 2000s. When the anthropogenic effect was intensified, the vegetation dynamics shifted from no change to greening and vice versa, which significantly intensified the vegetation greening since the 1980s. These results capture the processes of ecological programs and provide an assessment of the effects of ecological restoration. This work provides a credible attribution of the vegetation greenness dynamics and trend shifts in China's drylands, thus facilitating a better understanding of regional environmental change and management.
Export citation and abstract BibTeX RIS

Original content from this work may be used under the terms of the Creative Commons Attribution 4.0 license. Any further distribution of this work must maintain attribution to the author(s) and the title of the work, journal citation and DOI.
1. Introduction
Areas with an aridity index of less than 0.65 are commonly regarded as drylands, and they cover approximately 41% of the global land area (Fensholt et al 2012, Lian et al 2021). Vegetation change in drylands has a significant impact on the global carbon balance, and such dynamics dominate the interannual variability of global vegetation greenness (Poulter et al 2014, Humphrey et al 2018, Yao et al 2020). Vegetation growth and socioeconomic development in drylands are constrained by water scarcity, and the dryland environment is sensitive and vulnerable to climate change and human activities (Shukla et al 2019). China's drylands are among the largest worldwide and home to 580 million people (Li et al 2021a). Desertification processes have historically threatened the socioeconomic development of this region (Chen and Tang 2005, Wang et al 2006). To halt environmental degradation, a series of ecological restoration projects and ecological protection policies have been implemented in China's drylands since the late 1970s, such as the Three-North Shelter Forest Program and the Grain for Green Program (Wang et al 2010, Bryan et al 2018, Mao et al 2018, Niu et al 2019). Nevertheless, there is still much debate on the role of vegetation restoration in drylands under the context of climate change (Wang et al 2008, 2010, Cao et al 2011, 2020, Chu et al 2019). Therefore, further research on the vegetation dynamics in the drylands of China is important for clarifying and predicting regional and global environmental changes and their impacts.
Vegetation dynamics research typically employs the normalized difference vegetation index (NDVI), which is a remote sensing index related to vegetation greenness and biomass (Higginbottom and Symeonakis 2014, Pinzon and Tucker 2014). Previous studies have mainly analyzed linear trends in the NDVI and corresponding driving factors (Jamali et al 2015, Pan et al 2018). However, the dynamics of vegetation and the effects of the driving factors are both staged (Wu et al 2020). An abrupt change in vegetation (a shift in the trend of vegetation greenness) indicates an abrupt change in driving factors (Ratajczak et al 2018). The IPCC AR6 report shows that climate change is ongoing and that the frequency of extreme weather events is increasing (IPCC 2021). Environmental changes and feedback mechanisms may push ecosystems into a state of rapid and irreversible change, with potentially catastrophic results, such as desertification (Scheffer et al 2001, Scheffer and Carpenter 2003, Berdugo et al 2020). The shift in vegetation greenness trends in drylands and underlying factors are therefore issues that require focused attention. Although the dominant driver of vegetation dynamics in China's drylands has been classified from different perspectives, the direct factor underlying the trend shift has not been proven (Wang et al 2006, He et al 2019, Chen et al 2021, Li et al 2021a, Tian et al 2021).
Currently, several factors that affect vegetation dynamics have been identified, including moisture conditions and CO2 concentrations (Piao et al 2020). The moisture condition is the main climatic factor that affects vegetation dynamics in drylands, while the vapor pressure deficit (VPD) and soil moisture (SM) represent the demand and supply of water to the surrounding environment for plant growth, respectively (Liu et al 2020). Although drought from SM and VPD has a severe impact on vegetation (Humphrey et al 2018, Yuan et al 2019, Zhou et al 2019), few studies have considered the effects of both SM and VPD on vegetation in China's drylands. Previous studies have also shown that the increase in vegetation productivity was mainly associated with CO2 fertilization (Lu et al 2016, Lian et al 2021). One possible explanation is that the elevated CO2 concentrations initially increase the rate of the dark reaction of photosynthesis in plants, and on the other hand, higher CO2 concentrations result in lower stomatal conductance, which alleviates water deficits and indicates the integrated effect between CO2 fertilization and climate change (Franks et al 2013, Guerrieri et al 2019). Few previous studies have examined the effects of elevated CO2 concentrations on vegetation. Therefore, this study investigated the effects of CO2 and climate factors VPD and SM to simultaneously fill previous research gaps.
Although climate change and elevated CO2 concentration were influenced by human activities (IPCC 2021), the degree and extent of direct anthropogenic impacts on vegetation are also key issues in the analysis of vegetation dynamics and can provide an important basis for ecological restoration and socioeconomic development (Chen et al 2019, Zhang et al 2021). Previous studies have commonly quantified anthropogenic impacts by characterizing the human footprint, such as Gross Domestic Product, population, and livestock carrying capacity. Using socioeconomic and climatic indicators, Naeem et al (2021) showed that vegetation greening of the Loess Plateau during 2000–2018 was dominated by increased rainfall. However, Cao et al (2017) found that the arable land area and population were the main factors for the same region. Generally, the diverse forms of anthropogenic impacts on the natural environment are still difficult to display with single indicators (Venter et al 2016). Moreover, existing models of vegetation dynamics quantify anthropogenic impacts mainly through changes in the proportion of vegetation functional types (Zhu et al 2016) and by modeling the behavior of humans (Chang et al 2016). However, model setups are complex, anthropogenic impacts are multifaceted, and existing model simulations cannot fully characterize direct anthropogenic impacts (Piao et al 2015). Wessels et al (2012) used the residual trend analysis method (RESTREND) to calculate vegetation dynamics that cannot be explained by natural factors as being directly caused by anthropogenic activities. The method has been well evaluated at both local and regional scales (Wessels et al 2007, Burrell et al 2020, Li et al 2021b), suggesting that the RESTREND method is valid for distinguishing contributions between natural and anthropogenic factors.
This study aims to (a) examine the changes in vegetation greenness in China's drylands from 1982 to 2015 and (b) investigate the driving factors of vegetation green change in China's drylands. We collected vegetation greenness, climate, and CO2 concentration data and analyzed the variations in vegetation greenness and the contribution of natural and human factors using linear trend and shifted trend analyses.
2. Materials and methods
2.1. Study area
The total area of China's drylands is approximately 5.45 million km2, with the aridity index becoming progressively wetter from west to east. China's drylands include northeastern, northwestern, northern, and part of western China, and are composed of 20 provinces or municipalities (figure S1 available online at stacks.iop.org/ERL/17/044062/mmedia). According to the Climate Change Initiative's land cover products (mean NDVI values below 0.1 were excluded), the main land cover types and areas in China in 2000 were grassland (225.88 Mha), cropland (152.19 Mha), forestland (60.28 Mha), bare land (49.01 Mha), mosaic vegetation (32.22 Mha), sparse vegetation (22.62 Mha), and urban land (2.75 Mha) (table S1). Since the late 1970s, ecological restoration projects have been implemented in China's drylands. By 2015, a total of 66.07 Mha had been afforested under the implementation of the Three-North Shelter Forest Program, the Grain for Green Program, and the Beijing-Tianjin Wind and Sand Source Control Project (China 2017). The Grain for Green Program has been implemented on the Loess Plateau of China since 1998 (figure 1). The Three-North Shelter Forest Program and Beijing-Tianjin Wind and Sand Source Control Project have mainly been implemented in the Three-North region (figure 1).

Figure 1. Study area, including the land cover types and ecological restoration regions. AI: Aridity index (i.e. the ratio of mean annual rainfall to mean annual potential evapotranspiration). The black dashed line indicates the contour of the aridity index. Dryland is defined as an area with an AI below 0.65. This information is available online (https://figshare.com/articles/Global_Aridity_Index_and_Potential_Evapotranspiration_ET0_Climate_Database_v2/7504448/3).
Download figure:
Standard image High-resolution image2.2. Datasets
ERA5 reanalysis data were generated by the European Climate Model ECMWF in combination with satellite data (Hersbach et al 2020). The indicators used in this study include the surface 2 m temperature, soil water (0–7 cm), relative humidity, and cloud cover probability with a monthly average temporal resolution and 0.1° spatial resolution. The data are available at the following website: https://cds.climate.copernicus.eu/cdsapp#!/search?type=dataset. CO2 concentration data were obtained from the Hawaii Weather Monitoring Station (https://climate.nasa.gov/vital-signs/carbon-dioxide/), and these data from 1982 to 2015 were used to represent CO2 concentration variations in China's drylands. Vegetation indices were derived from GIMMS 3.1 NDVI from 1982 to 2015, with a temporal resolution of 15 days and a spatial resolution of 1/12° (Pinzon and Tucker 2014). Monthly data were generated by calculating the monthly averages, with a spatial resolution resampled to 0.1° in R 4.1. Regions with an annual mean NDVI value below 0.1 were excluded from the analysis. Monthly averages of the climate and vegetation indices from May to September were used as annual growing season averages. Land cover data were generated using global 300 m resolution European Space Agency-generated land cover data for 1992, 2000, and 2010 from the Climate Change Initiative (Kirches et al 2014). This land cover classification system includes 22 types, which were integrated into seven types: cropland, forest, grassland, sparse vegetation, mosaic vegetation, bare area, and urban area. The land cover data were compared across the three periods, and the areas showing the conversion of land cover types were grouped as 'changed'.
2.3. Method
2.3.1. Calculation of VPD
The VPD represents the atmospheric moisture conditions. VPD was calculated using equation (1) (Venturini et al 2011)

where Ta represents land surface temperature (°C) and RH represents the surface relative humidity.
2.3.2. CO2 fertilization effect
By combining the results of existing CO2 enrichment experiments, Franks et al (2013) found a pattern of relative proportional changes in plant productivity at varying CO2 concentrations and showed that this pattern occurred across plant types and initial concentrations. As shown in equation (2), CO2 fertilization is related to the CO2 concentration. As CO2 accumulates in the atmosphere, the ratio of CO2 fertilization relative to the original effects will increase
where Rel(t) represents the relative CO2 assimilation rate (%), Ca,(t) represents the atmospheric CO2 concentration (µmol mol−1) at year t, and Γ* represents the CO2 compensation point in the absence of dark respiration (µmol mol−1). We set Ca0 to the CO2 concentration in 1980 (∼339 µmol mol−1) and Γ* to 40 (µmol mol−1). We assume that the increased proportion of NPP dynamics is equal to the increased proportion of gross primary productivity dynamics and the NDVI is a proxy of NPP. Thus, NDVIadjusted can represent vegetation greenness independent of the effect of CO2 fertilization (equation (3)). The effect of CO2 fertilization on vegetation trends is equal to the trend of NDVIraw minus the trend of NDVIadjusted

2.3.3. Principal component regression analysis (PCR) and RESTREND
Considering the significant coupling between the above factors, such as VPD and SM, VPD and temperature, the PCR method can be used in this study to differentiate between climatic factors (Seddon et al 2016). The VPD, SM, temperature, and cloud cover data were standardized and then converted to four independent principal components (equation (4)). Multiple linear regression was performed between the principal components and the adjusted NDVIadjusted values (equation (5)). The residuals in the relationship between NDVIadjusted and climate factors were considered the changes caused by anthropogenic impacts. When the relationship between the principal components and NDVIadjusted was not significant (P < 0.1), the effect of climate on vegetation dynamics was zero. The linear trend of the residual was calculated as the anthropogenic effect
where P1, P2, P3, P4 represent the principal components of climatic factors (equation (4)). A trend analysis of the residuals was conducted to obtain the anthropogenic impacts on the trend of vegetation greenness during 1982–2015.
2.3.4. Breakpoint detection
The breaks for additive season and trend (BFAST) method, which identified time series with potential breakpoints, had been applied to vegetation dynamics detection (Verbesselt et al 2010). In this paper, we used the BFAST method to analyze the trend shifts and their driving factors. The shortest segment was set at 0.25 of the total length, i.e. eight years. Potential breakpoints of the growing season NDVI on the pixel scale were identified between 1982 and 2015. The most significant breakpoint was tested with the Chow test (P < 0.05). The BFAST method and Chow test were implemented in RStudio using the 'Bfast' package (Verbesselt et al 2018).
3. Results
3.1. Vegetation dynamics in China's drylands during 1982–2015
From 1982 to 2015, 41.51% of the vegetation greenness in China's drylands showed a significant increase (P < 0.05; figure 2) and 8.40% showed significant decrease (P < 0.05). The areas with greening were mainly distributed in the northwestern and central-eastern parts of the study area (e.g. Shaanxi, Shanxi, Liaoning, Gansu, Southern Inner Mongolia, and Xinjiang provinces), while the areas with decreases in vegetation greenness were mainly distributed in the eastern drylands (e.g. eastern Inner Mongolia and Heilongjiang provinces). The overall greenness of China's drylands showed an increasing trend (+0.60 × 10⁻³ yr−1), and the overall greenness of the Loess Plateau and the Three-North region also showed an increasing trend with +1.70 × 10⁻³ yr−1 and +0.60 × 10⁻³ yr−1, respectively. Overall, the vegetation greenness in all land classes except sparse vegetation and urban areas showed a significant increase from 1982 to 2015, with the greatest increase in the greenness of cropland (+0.95 × 10⁻³ yr−1), woodland (+0.60 × 10⁻³ yr−1), land transformation areas (+0.75 × 10⁻³ yr−1), and mosaic vegetation (+1.10 × 10⁻³ yr−1) (table S1).
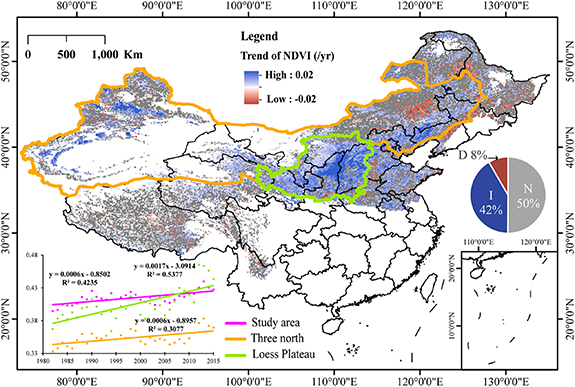
Figure 2. Trends in the vegetation growing season from 1982 to 2015. The scatter plot in the lower-left corner indicates the overall change in vegetation of study area (pink line), Three-North (orange line), and Loess Plateau (green); and the pie chart indicates the proportion of vegetation greenness showing increases (blue), decreases (red), and no significant change (gray).
Download figure:
Standard image High-resolution imageBreakpoint detection at the pixel scale showed that the areas with significant breakpoints accounted for 12.85% (61.28 Mha) of the dryland area, with temporal concentrations in 1998–2000 and 2005 (figure 3(a)). For the areas with breakpoints, the vegetation showed a mean greening trend of +2.10 × 10⁻³ yr−1 before the breakpoints and an enhanced greening trend of +4.20 × 10⁻³ yr−1 after the breakpoints. Further statistics on trend changes at the pixel scale showed that the main types of trend shifts were maintaining the trend of greening, switching from no significant change to greening, and switching from greening to no significant change (figure 3(b)).
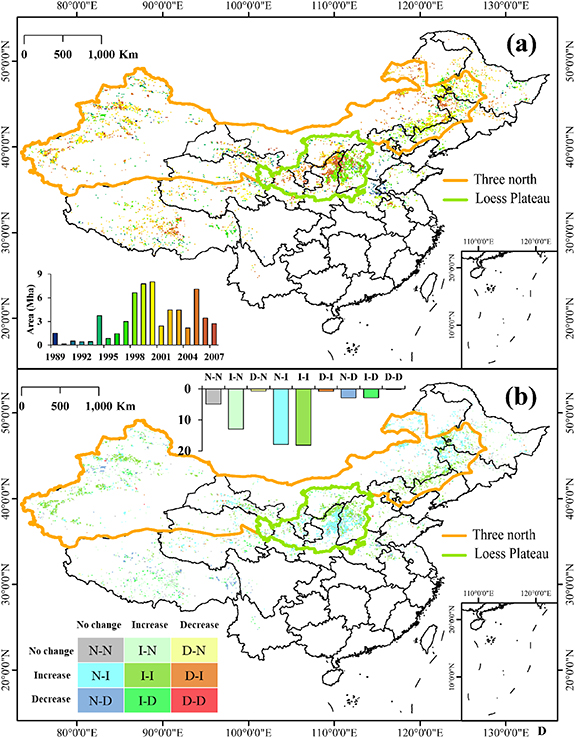
Figure 3. (a) Spatial-temporal pattern of the breakpoint; and (b) conversion type of the trend at the breakpoint. N: No significant change, I: Increasing, D: Decreasing.
Download figure:
Standard image High-resolution image3.2. Driving factors of vegetation change trend between 1982 and 2015
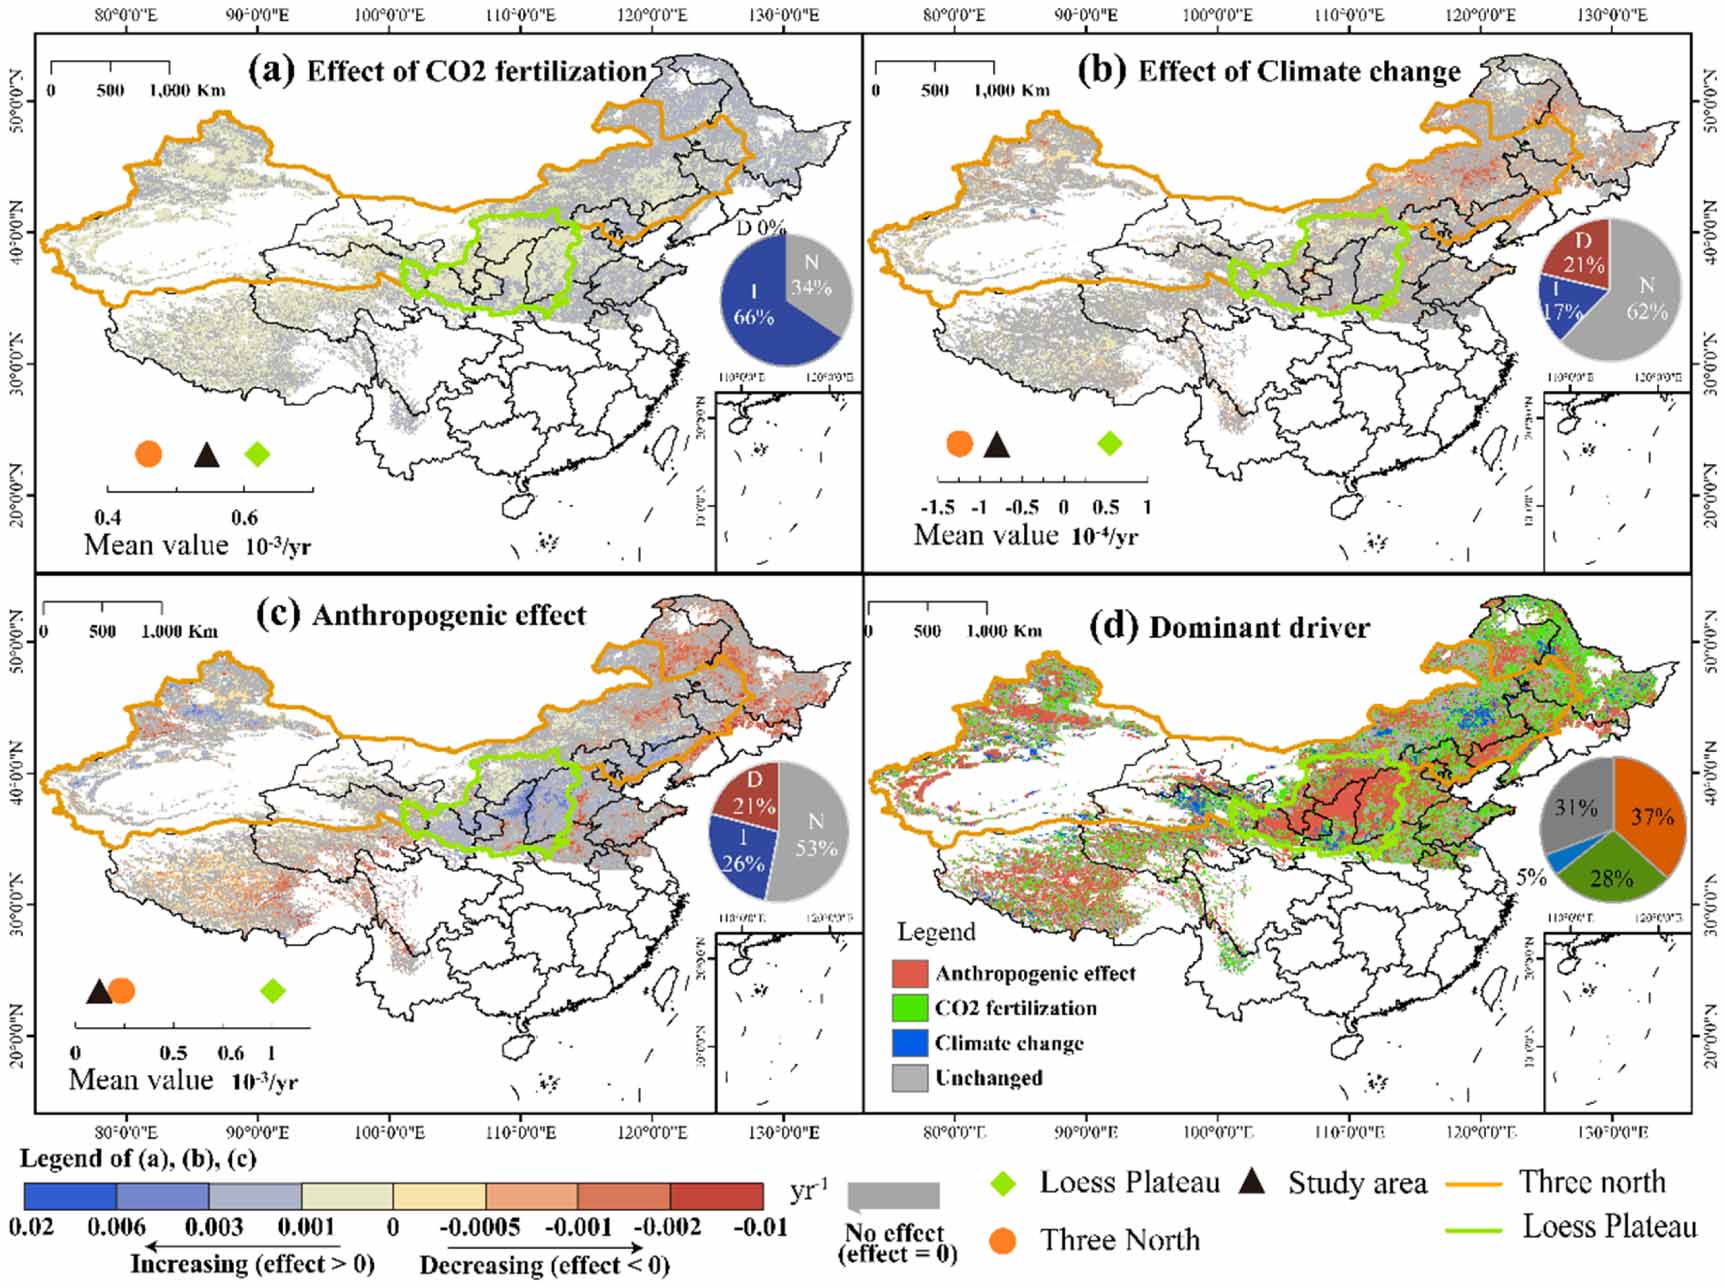
The effect of CO2 fertilization on vegetation was mainly positive (66%), with an overall effect of +0.55 × 10⁻³ yr−1 (figure 4(a)). Vegetation was the most sensitive to VPD, but SM was the dominant climatic factor for vegetation change during the study period (figure S2). The effect of climate change on vegetation was mainly negative (21%), which primarily occurred in the eastern drylands (e.g. central-eastern Inner Mongolia, northeastern China) (figure 4(b)), with an overall effect of −0.08 × 10⁻³ yr−1. The positive and negative anthropogenic effects on vegetation accounted for 26% and 21% of the area, respectively, with the positive effect mainly distributed in the Loess Plateau, northern Tianshan mountains, western Xinjiang, and western Liaoning Provinces, the negative effect mainly distributed in the northeastern drylands (e.g. eastern Inner Mongolia, western and southeastern Heilongjiang, central Liaoning, and eastern Jilin provinces), with an overall effect of +0.12 × 10⁻³ yr−1 (figure 4(c)).
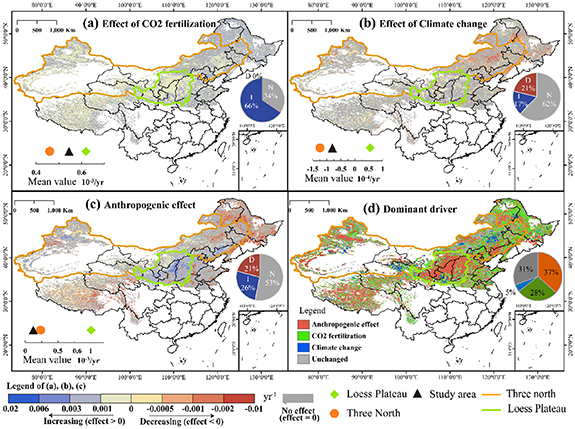
Figure 4. Effects of (a) CO2 fertilization, (b) climate change, and (c) anthropogenic effects; (d) dominant drivers of vegetation dynamics from 1982 to 2015; (e) histogram representing the proportion of vegetation change trend in the study area; and (f) comparison of the mean values of effects in the Three-North region, the Loess Plateau, and the study area.
Download figure:
Standard image High-resolution imageBy comparing the effects of CO2 fertilization, climate change, and anthropogenic impact, the factor with the largest absolute value of effect was extracted as the dominant factor (figure 4(d)). The percentage of changes was dominated by anthropogenic effect was 37%, followed by CO2 and climate change, which accounted for 28% and 5% of the total drylands in China, respectively. The anthropogenic effects varied significantly between regions, with positive effects on the Loess Plateau (+1.01 × 10⁻³ yr−1) and the Three-North region (+0.24 × 10⁻³ yr−1), and a significantly higher effect on the Loess Plateau than the mean value of the study area (figure 4(c)). Decreased greenness was caused by the effects of climate change and anthropogenic impacts in the southern foothills of the Daxingan Mountains. The change in VPD dominated the vegetation degradation in this region (figure S2). In the Tibet and Qinghai provinces, the effect of climate change was positive while the anthropogenic effect was negative. The negative effects of climate change and anthropogenic impacts coexisted in urban and forest areas, and in urban areas, they exceeded the positive effect of CO2 fertilization (table S1).
3.3. Causes of vegetation trend shifts
The calculation procedures in 3.2 were followed to calculate the dominant factors of vegetation change before and after the breakpoint. The results are shown in figure S3. Before the breakpoint, anthropogenic impacts on vegetation were mainly observed in the southeastern part of the Three-North region (including southeastern Inner Mongolia and western Liaoning Provinces) (figure S3(e)). After the breakpoints, anthropogenic impacts were mainly observed in the Loess Plateau region (including northern Shaanxi, southern Inner Mongolia, Shanxi, Ningxia, and eastern Gansu Provinces) (figure S3(f)). For the areas with breakpoints, the area dominated by anthropogenic impacts increased from 42.32% to 52.04% (figures S3(g) and (h)). Compared to the area before the breakpoints, the area dominated by the CO2 fertilization effect significantly decreased (from 13.38% to 6.39%), and the area dominated by climate change significantly increased (from 6.25% to 15.70%) (figures S3(g) and (h)). The results of the breakpoint analysis and RESTREND showed when anthropogenic impacts diminished to a nondominant factor, vegetation dynamics shifted from greening to no change (A-U&I-N,7.98 Mha); when anthropogenic impacts strengthened to a dominant factor, vegetation dynamics shifted from no change to greening (U-A&N-I,11.76 Mha); and when anthropogenic impacts were maintained as a dominant factor, the slope of greening increased (A-A&I-I/C-A&I-I,12.91 Mha) (figure 5(a)). The above four types account for 6.73% of the study area and 56.72% of the area where breakpoints exist, or approximately 31.64 Mha (figure 6). Figure 6(b) shows the mean trend in certain situations, and it demonstrates that the overall greening trend of vegetation can be attributed to specific-stage human-induced greening (figure 5(b)). For example, although weakened anthropogenic effects induced a shift in vegetation dynamics from greening to no change (figure 5(a), I-N&A-U), the overall trend was greening (figure 5(b), I-N&A-U).
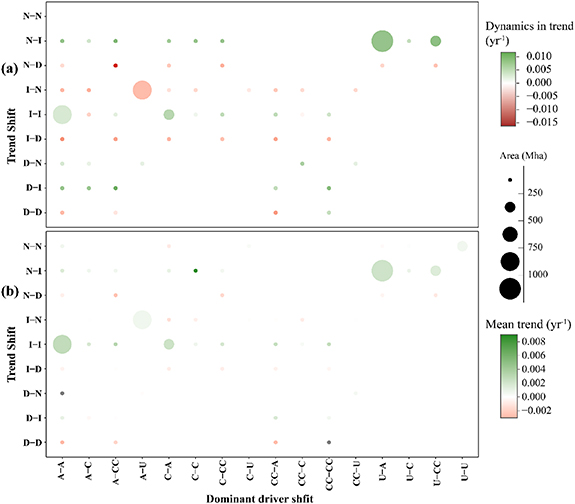
Figure 5. (a) Dynamics in the trend and (b) mean trend under the trend shift and dominant driver shift conditions. U: unchanged, CC: climate change, C: CO2, A: anthropogenic effect; D: decrease, I. increase, N: nonsignificant change.
Download figure:
Standard image High-resolution image
Figure 6. Spatial patterns of the trend shift related to anthropogenic impacts. (a)–(c) Temporal distribution of the conversion of trends and dominant drivers in the Loess Plateau, western Three-North region, and eastern Three-North region, respectively.
Download figure:
Standard image High-resolution imageThese analyses were further performed for the Three-North region (figures S4(c), 6(b) and (c)) and the Loess Plateau (figures S5 and 6(a)). In the Three-North Region, the main types included a shift in vegetation greenness trend from no change to greening and an acceleration of vegetation greening trend when anthropogenic impacts strengthened to a dominant factor or a shift in the vegetation dynamics from greening to no change when the anthropogenic impacts diminished to a nondominant factor (figure S4(a)). The apparent difference in the temporal distribution was between the eastern (approximately 1999, figure 6(c)) and western (approximately 2000 and 2005, figure 6(b)) Three-North region. On the Loess Plateau, the main trend was a shift in vegetation dynamics from no change to greening (approximately 1998, figure 6(a)) and acceleration of greening trends (approximately 1998 and 2003, figure 6(a)) when human activity intensified as the dominant factor (figure S4(a)).
4. Discussion
4.1. Anthropogenic effects largely contributed to vegetation greening
Anthropogenic impacts dominated vegetation dynamics in 37% of China's drylands and had an overall positive effect. Areas with greater improvement were mainly observed on the Loess Plateau and in the Three-North region. In addition, the most significant anthropogenic dominance was found in grassland, cropland, sparse vegetation cover, mosaic vegetation cover, and areas with land cover change (table S1). On the one hand, the increase in the average greenness of cropland was caused by the increase in yield and the agricultural extension (Chen et al 2019). On the other hand, the improvement was also associated with ecological conservation and restoration, such as the Grain for Green Program, in which arable land on slopes >25° had been returned to the previous forest and grassland types and original disturbance to natural forests had been prohibited, and the Three-North Shelter Forest Program, in which forest degradation areas had been restored (Bryan et al 2018). Moreover, vegetation restoration had also been implemented in sparsely vegetated areas, including the Mu us and Kubuqi Deserts (Yu et al 2020, Lin et al 2021).
Compared with the work of Zhang et al (2015) and Chen et al (2021), our study promotes an understanding of the processes of intensified greening. The implementation of ecological restoration can be divided into two phases based on the implementation of the Three-North Shelter Forest Program (TNSFP), which decelerated after 2000, and implementation of the Grain for Green Program (GTGP), which accelerated after 2000 (figure 7). This corresponds to the significant increase in ecological investment (Bryan et al 2018). We found that the implementation of ecological projects has been the dominant driver of trend shifts in China's drylands. When the dominant factor shifted to anthropogenic impacts between 1999 and 2004, the vegetation greenness shifted from no change to increasing. This mapped with the spatial patterns of ecological project implementation of the Grain for Green Program (figure 7). The trend of increasing vegetation greenness was significantly intensified after the breakpoint, with anthropogenic impacts as the dominant factor, indicating an increase in the intensity and effect of ecological restoration. When the dominant factor shifted from anthropogenic impacts to unchanged, the vegetation greenness shifted from increasing to no change in approximately 2000. This suggests that the positive effect of ecological restoration was constant after 2000. These results capture the process of ecological restoration and provide an assessment of ecological projects. This result is different from the study by He et al (2019), in which the intensified greening of China after 2000 was attributed to an enhanced summer monsoon and warming hiatus. Although the degradation of planted forests was observed for 3.23 Mha of the Three-North region (National Forestry and Grassland Administration 2020) and excessive afforestation had been criticized (Cao et al 2011, Zhang et al 2018), decreased vegetation greenness was barely detected in this study. This may be because the increased greenness in the prebreakpoint period covers this declining dynamic or the hysteresis between vegetation functional degradation and greenness decline.

Figure 7. Accumulated area of ecological restoration in China's drylands (China 2017). TNSFP: Three-North Shelter Forest Program; BSSCP: Beijing-Tianjin sand source control project; GFGP: Grain for Green Program.
Download figure:
Standard image High-resolution image
4.2. The interaction of ecological restoration, climate change, and CO2 fertilization
The results of our study are different from those from Naeem et al (2021), who found that both climate change and anthropogenic activities determine vegetation greening. However, we found that the positive effects of CO2 fertilization and anthropogenic impacts offset the negative effects of climate change and resulted in an overall increase in vegetation greenness (figure 4). On pixel scale, the effect of CO2 fertilization was wide and strongly offset the negative anthropogenic effect (20.84% vs. 10.15%) and climate change (21.23% vs. 6.36%) (table S2). Similar results had been reported by Piao et al (2015) and Wang et al (2006), who found that CO2 fertilization is the dominant factor of vegetation greening in China, and climate change has negative effects on vegetation greening.
We found similar patterns of the effects of climate change and the anthropogenic (figure 4). For the integration of anthropogenic and climate change effects (A + CC), the proportion of increases (24.02%) and decreases (24.10%) is relatively similar to the proportion under their single impact (A: 26.06%, CC: 16.63%; A: 20.84%, CC: 21.23%) (table S2). This indicated the potential synergistic effects between them. On the Loess Plateau, the positive effect of climate change and the anthropogenic effect was found, which has also been observed by Tian et al (2021) and Chen et al (2021). The main reason for this finding may be that ecological restoration improved the local environment through plant-atmospheric interactions, resulting in favorable climate conditions that enhanced the growth of restored vegetation (Zhang et al 2021). Besides, we also found the opposite effect between climate change and anthropogenic impact on vegetation greening of the Tibet province (figure 4). In this region, the ecosystem is specifically sensitive and vulnerable. Warming relieved the limitation of temperature on plant growth, and increased moisture from snowmelt facilitates plant growth on the Tibetan Plateau (Shen et al 2015, Piao et al 2020). The effect of climate change to some extent compensated for the destruction of vegetation from human activities.
5. Conclusions
This study analyzed the vegetation dynamics and the driving forces in China's drylands during 1982–2015 using the CO2 fertilization effect equation, principal component regression, RESTREND, and BFAST method. The following results were obtained:
- (a)Vegetation greenness in China's drylands increased significantly from 1982 to 2015, and 12.85% (62.18 Mha) of the drylands showed a significant trend shift in vegetation greenness, demonstrating significantly intensified greening since the 2000s.
- (b)The anthropogenic impacts and CO2 fertilization effect jointly determined the vegetation greening in China's drylands. The positive effects of anthropogenic activities offset the negative effects of climate change, and the positive anthropogenic effect was significantly greater in the Three-North region and the Loess Plateau.
- (c)Anthropogenic impacts were closely related to the shift in vegetation dynamics, showing that significant greening was intensified as anthropogenic impacts increased.
This research demonstrated that the anthropogenic impacts and CO2 fertilization effect jointly determine the vegetation greening in China's drylands, and in 6.73% (31.64 Mha) of China's dryland, the shift in vegetation dynamics between greening and no change was directly influenced by anthropogenic impacts. This study provides new evidence for the factors driving vegetation dynamics and can facilitate assessments of ecological restoration. The intensity, spatial distribution, and transformation of anthropogenic impacts on vegetation obtained in this study are credible, and the base map of anthropogenic impacts in this study can provide key information for other studies.
Acknowledgments
This study was supported by the National Natural Science Foundation of China (No. 41991230), the Fundamental Research Funds for the Central Universities, Bayannur Ecological Governance and Green Development Academician Expert Workstation (YSZ2018-1), and the Science and Technology Project of Inner Mongolia Autonomous Region (NMKJXM202109).
Data availability statement
The data generated and/or analysed during the current study are not publicly available for legal/ethical reasons but are available from the corresponding author on reasonable request.