

Abstract
Aridity regulates the terrestrial ecosystem productivity in water-limited regions. The aridity index (AI) is often defined as the ratio of annual precipitation to annual potential evapotranspiration. However, how the drying and wetting influence the vegetation response and its characteristic along aridity gradient remains unclear. Here, we examined trends of the AI and normalized difference vegetation index (NDVI) in the drylands of East Asia from 1982 to 2015, which denoted the drying and wetting trends and vegetation response, respectively. The results show that the variability in land area and AI from 1982–2015 was lower in the whole dryland than its subtypes including hyper-arid, arid, semi-arid, and dry sub-humid regions. Drying and wetting trends were observed in each AI interval along a spatial aridity gradient. Wetting trends are prevalent owing to their area and magnitude were twice those of drying trends. Spatial variation of aridity shaped the pattern of trends in vegetation response to drying and wetting trends; drier regions had smaller and narrower ranges of variation in NDVI trends relative to wetter regions. A shift in AI trends and NDVI trends along the spatial aridity gradient occurred at 0.4 of AI. Distinct patterns of vegetation response to aridity change were observed across the aridity threshold, and the transition region was identified in the studied drylands. The results suggest that changes in the subtypes might be masked by the entire drylands and then leading to failure in recognizing the transformation of the subtypes. This implies that terrestrial carbon storage variability prediction should consider the spatial aridity changes to avoid the uncertainties due to the divergent vegetation response to AI trends at different aridity levels.
Export citation and abstract BibTeX RIS

Original content from this work may be used under the terms of the Creative Commons Attribution 4.0 licence. Any further distribution of this work must maintain attribution to the author(s) and the title of the work, journal citation and DOI.
1. Introduction
Aridity index (AI) is defined as the ratio of annual precipitation to annual potential evapotranspiration, and the decrease in AI denotes drying trends and vice versa. The AI is a comprehensive index for water availability in drylands. Drying and wetting trends are widespread climatic phenomena in a long time series (Sheffield et al 2012, He et al 2019), which substantially affect plant growth and vegetation cover in global drylands (Feng and Fu 2013, Huang et al 2015). Increasing aridity would decrease soil water availability, thus limiting photosynthesis and ecosystem carbon sequestration (Peng et al 2013, Doughty et al 2015, Frank et al 2015, Xu et al 2019). In contrast, drylands can rapidly become large carbon sinks in wet years as vegetation productivity increases because soil water is less constrained (Poulter et al 2014, Chen et al 2021). Recent research has indicated that 'vegetation decline', which can be observed in satellite data, is a key feature in the first stage of ecosystem transition (Berdugo et al 2020). Differences in the direction and magnitude of the vegetation productivity response to long-term drying and wetting trends along the spatial aridity gradient are not clear. Therefore, clarifying the trajectory and magnitude of vegetation activity in drylands, in response to changes in the temporo-spatial AI, could improve terrestrial carbon cycle predictions under aridity changes and provide an early warning signal of the ecosystem transition.
Drylands account for 40% of the world's land area and provide support for 38% of its population (Smith et al 2019, Li et al 2019b), their geographical extent varies over time largely because of climate change (Feng and Fu 2013, Huang et al 2017). By the end of the 21st century, the area of drylands is projected to increase by 10% over that evident in 1961–1990 (Feng and Fu 2013), and aridity strengthening would result in half of the global land surface being covered with drylands (Huang et al 2017). Furthermore, Sheffield et al (2012) observed a mixture of wetting and drying trends because of the increase in potential evapotranspiration in 58% of the land area and a decrease of 42% in the rest area. For example, central and western Asia experienced drying trends from 1980 to 2008, whereas northern Asia became wetter (Li et al 2015, El Kenawy et al 2016). Moreover, the magnitude of the land-atmosphere feedback was always counteracted by the average effects of the opposing smaller-scale trends within a region (Zeng et al 2017). Little change has been observed in aridity trends due to this tradeoff between regions that are experiencing wetting and regions that are witnessing drying (Greve et al 2014). Regional heterogeneity of drying and wetting trends resulted in the mean weak aridity trends and the complicated interplay between climate change and vegetation activity. The pattern of drying or wetting trends of dryland subtypes (hyper-arid, arid, semi-arid, and dry sub-humid regions) with different aridity level is uncertain.
Drylands play a dominant role in determining the trends and variability of global terrestrial carbon sinks (Ahlström et al 2015, Poulter et al 2014, Smith et al 2019). The expansion of drylands decreases carbon sequestration and exacerbates the risk of ecosystem degradation (Huang et al 2015). Aridification led to abrupt changes in plant productivity at aridity value of 0.54 to identify the systemic ecosystem changes (Berdugo et al 2020). The alleviation of aridity increased vegetation growth over global drylands (He et al 2019), but the patterns varied among climate zones and biomes (Xu et al 2018). Vegetation activity responds more rapidly to drying trends in arid biomes than in semi-arid or sub-humid biomes (Vicente-Serrano et al 2013). Vegetation productivity is affected by aridity conditions, depending on their resistance to and resilience during long-term climate change (Schwalm et al 2017). Vegetation productivity dynamics tend to exhibit nonlinear responses to hydroclimate change in drylands (Berdugo et al 2020, Smith et al 2019). These are characterized in part by inconsistencies in the response of the ecosystem to climate change over periods ranging from years to decades (Walker et al 2020) and by asynchronous inter-annual variability at seasonal or longer temporal resolutions (Piao et al 2019). Carbon loss due to less water availability could be compensated for by the subsequent growth increase in wetter periods (Jiang et al 2019, Chen et al 2020). Regional differences could be accounted for by different responses in drylands and humid lands (Huang et al 2015). Therefore, the response of vegetation growth to drying and wetting trends was constrained by the spatial aridity conditions, but the evolutionary trajectory of vegetation activity to temporo-spatial aridity variation in drylands is not fully understood.
To reduce the knowledge gap, we investigated the changes in the AI in drylands and their subtypes, and then the vegetation activity pattern with aridity changes in drylands of East Asia. Aridity decreased in the Asia drylands during 1948–2008 (Li et al 2019a), and a shift to wetter conditions occurred in arid northwestern China since the mid-1980s (Shi et al 2007). Dryland in East Asia is a global hotspot area to invest the climate change (Qi et al 2012) and vegetation productivity (Yao et al 2020). Based on the hypothesis that small changes in aridity index would lead to large variation of vegetation index if the different response observed when wetting or drying occurred across an aridity threshold. Furthermore, the identification in the variability of the aridity threshold transition zone would be important for accurate prediction in terrestrial carbon cycle dynamics, owing to the variability of the subtype was usually masked by the average little change in the whole region. In this study, we first identify the consistency of the variability among the whole drylands and its subtypes in the area and AI magnitude. Second, we characterize the heterogeneous patterns of changes in drying and wetting trends along aridity gradient in the past decades. Lastly, we evaluate the vegetation index trends along aridity gradient to explore how the spatial aridity regulated the interaction of vegetation index trends with the temporal aridity changes in drylands. Clarification of the vegetation productivity dynamics according to the aridity condition variation in spatial and temporal scale provides an early warning signal of ecosystem productivity change.
2. Materials and methods
2.1. Study region
The drylands of study are located in East Asia (25° 59 N–53° 19 N, 73° 26 E–125° 59' E) (figure 1(a)), and have an arid and semi-arid climate, with mean annual temperatures ranging from −3 to 9 °C and mean annual precipitation typically less than 700 mm. Vegetation growth and survival are usually constrained by water availability (Zhao et al 2020). Grasslands covered more than 45% on average from 1980 to 2015, and unused land (saline, Marshland, sandy land and bare land, etc, with less than 5% vegetation coverage) accounted for more than 41%, while other land use/cover types (forest, farmland, etc) covered less than 15% of the drylands. The grassland and unused land were decreased by 1.2% and 1.6% respectively in the past four decades, respectively, while other land use types were increased by less than 1%. Land use area and land use change were calculated according to the land use map (http://www.resdc.cn/) from 1982 to 2015, covering seven years: 1980, 1990, 1995, 2000, 2005, 2010, and 2015.

Figure 1. Location of drylands and their subtypes (a) and the mean NDVI from 1982–2015 (b).
Download figure:
Standard image High-resolution image2.2. Aridity index
The aridity index (AI, dimensionless) is the ratio of annual precipitation (PPT) to annual potential evapotranspiration (PET). In this study, we calculated PET using the Penman–Monteith model (Penman 1948, Monteith 1965), which performs well because its robustness relates to how well it accounts for the physical basis of aridity, which includes changes in available energy, relative humidity, and wind speed, rather than just accounting for temperature (Sheffield et al 2012). This also agrees well with a great deal of evidence regarding the change in pan evaporation in many regions (Abtew et al 2011, Liu et al 2019).
We obtained meteorological data from 756 national meteorological sites from the China Meteorological Data Service Center (http://data.cma.cn/en) covering 1982–2015, which mainly included precipitation (PPT), net radiation, soil heat flux, air temperature, wind speed, and relative humidity. The site-level data were interpolated at 10 km and daily resolutions using the software package ANUSPLIN with elevation as a covariate (Hutchinson and Xu 2013), which provides an interpolation of noisy multivariate data using thin-plate smoothing splines from observation data acquired from meteorological stations. ANUSPLIN is widely used to interpolate climatic variables (Ukkola et al 2015). The quality of the interpolated meteorological dataset has been fully evaluated and found to have reliable accuracy (Yu et al 2004, Zhao et al 2020). We then calculated yearly PET and total PPT using gridded data and extracted the study region data. A hypothetical reference crop with an assumed crop height of 0.12 m, a fixed surface resistance of 70 s m−1 was used, closely resembling an extensive surface of grassland cover. Furthermore, we calculated the net radiation using the actual albedo, which is the mean value of white-sky albedo and black-sky albedo from Global Land Surface Satellite (GLASS) products (http://glass.umd.edu/). The PET equation (Allen et al 1998) used in this study was recommended by the Food and Agriculture Organization (http://fao.org/3/x0490e/x0490e08.htm).


where PET is the potential evapotranspiration (mm day−1), Rn is the net radiation (MJ m−2 day−1), G is the soil heat flux (MJ m−2 day−1), γ is the psychrometric constant (kPa °C−1), T is the air temperature (°C), u2 is the wind speed at 2 m above the surface (m s−1), Δ is the slope of the vapor pressure deficit curve (kPa °C−1), es is the saturation vapor pressure (kPa) at temperature T, and ea is the actual vapor pressure (kPa). AI is the aridity index (unitless), PPT is the total annual precipitation (mm), and PET is the total annual potential evapotranspiration (mm).
2.3. Vegetation index
We used the Global Inventory Modeling and Mapping Studies 3rd generation (GIMMS 3 g) normalized difference vegetation index (NDVI) from 1982 to 2015, which has been widely demonstrated to well represent plant growth owing to its long time-series record (Fensholt and Proud 2012, Tian et al 2015). The band ratio format of NDVI can eliminate or weaken the topographic effects on vegetation index (Matsushita et al 2007). We resampled NDVI data with a 8 km and 15-day resolution using the nearest method in ArcGIS 10.2 to match the AI resolution (10 km). NDVI is a good indicator of surface vegetation cover, and increasing and decreasing NDVI are referred to as 'greening' and 'browning', respectively (Alcaraz-Segura et al 2010).
2.4. Data analysis
Drylands were divided into four subtypes according to mean AI from 1982 to 2015 (Huang et al 2015): hyper-arid (AI < 0.05), arid (0.05 ≤ AI < 0.2), semi-arid (0.2 ≤ AI < 0.5), and dry sub-humid (0.5 ≤ AI < 0.65) regions (figure 1(a)) to explore the AI trends. Spatial patterns of the mean annual NDVI during 1982–2015 are shown in figure 1(b). NDVI is closely related to aridity conditions because water availability strongly constrains plant growth (Vicente-Serrano et al 2013, Gouveia et al 2017, Zhang et al 2017). Drying and wetting were defined as negative and positive trends in AI, respectively. Moreover, the mean AI value indicates the spatial differentiation of the aridity conditions. Vegetation response was defined as the vegetation index trends.
First, the annual AI values during 1982–2015 were used to investigate the changes in area and magnitude over the past decades. Second, trends in AI and NDVI were identified using the nonparametric Mann–Kendall test (Mann 1945, Kendall 1975). Patterns of AI trends and their area ratio are clarified along aridity gradient. Lastly, the spatial AI gradient groups were divided at 0.05 intervals and the group of temporal AI trends was divided with each 10−3 yr−1 interval. P-values were given at a significance level of 0.05.
3. Results
3.1. Spatial variability of aridity in drylands
The area of drylands in the study region is less variable than the dryland subtypes. Semi-arid land accounts for the largest proportion of the total area (32.1%), followed by arid land (23.4%), dry sub-humid land (11.0%), and hyper-arid land (9.2%) (figure 2(a)). The geographical extent of drylands (AI < 0.65) shows a slight inter-annual variability, with the coefficient of variation (CV) of 4.4% from 1982 to 2015. Hyper-arid land has the largest CV of 35.8%, followed by dry sub-humid land of 17.7%, arid land of 12.2%, and semi-arid land of 10.0%, in area percentage, respectively. No significant trends are observed in the area of the entire drylands. The semi-arid area has the smallest inter-annual variability, which is the most widely distributed subtype, whereas the hyper-arid area has the greatest inter-annual variability, which covers the smallest area.

Figure 2. Proportion of the total area (a) and aridity index (AI) (b) for the hyper-arid, arid, semi-arid, and dry sub-humid regions from 1982 to 2015. Box plots display the median (solid line), mean (dashed line), interquartile range (upper and lower edges of box), the 10th to 90th percentiles (whiskers), and outliers (values more than 3 standard deviations from the mean; circles).
Download figure:
Standard image High-resolution imageThe mean AI value of drylands has a smaller variability than that of the subtypes. The mean value of AI ranges from 0.22 to 0.28 in drylands, and with a CV of 6.6% in the study period. While, the hyper-arid has AI of 0.03 ± 0.008 (mean ± standard deviation, the same hereinafter) with CV = 23.1%, the arid land has AI of 0.10 ± 0.012 with CV = 12.0%, the semi-arid land has AI of 0.32 ± 0.028 with CV = 8.6%, and the sub-humid land has AI of 0.53 ± 0.044 with CV = 8.3% (figure 2(b)). In all, subtype lands show greater inter-annual variability in both the area proportion and the mean AI value than the entire studied drylands during 1982–2015.
3.2. Drying and wetting trends
The mean AI trend first increases and then decreases, and shows a convex downward shape along the spatial AI gradient (figure 3). The largest value of mean AI trend is 1.1 × 10⁻³ yr–1 in the semi-arid region with the AI ranging from 0.35 to 0.4. Wetting, as AI increases, occurs in nearly 65.3% of the drylands area, whereas drying trends cover approximately 34.7%. The wetting area merely doubles that of the drying trend. The average magnitude of the drying and wetting trends increases with increasing spatial AI. In the hyper-arid area, with the lowest AI values, the magnitudes of the drying and wetting trends are −0.21 × 10⁻³ yr–1 and 0.21 × 10⁻³ yr–1, respectively. In the dry sub-humid area, with the highest AI values, the magnitudes of the drying and wetting trends are −2.36 × 10⁻³ yr–1 and 2.74 × 10⁻³ yr–1, respectively.

Figure 3. Grouped AI trends and their area ratio at spatial AI intervals of 0.05, and the distributions of AI trends and the P values. Bars denotes the mean ± standard deviation.
Download figure:
Standard image High-resolution image3.3. Vegetation response to aridity changes
Figure 4 shows the NDVI trend variation along the temporo-spatial aridity changes and indicates that average NDVI trends increases with increasing spatial AI (figure 4(a)) and decreases with increasing temporal AI trends (figure 4(b)). Spatial AI variation shapes the pattern of changes in the NDVI trends along temporal AI trends. The range of NDVI trends and AI trends narrows as spatial AI decreases (figure 4(c)). In hyper-arid regions, NDVI trends range from –0.3 × 10⁻³ yr–1 to 0.3 × 10⁻³ yr–1 with AI trends ranging from −1 × 10⁻³ yr–1 to 1 × 10⁻³ yr–1. In contrast, in the dry sub-humid region, NDVI trends span the range of AI trends of −9 ×10⁻³ yr–1 to 10 × 10–3 yr–1.

Figure 4. Variation of NDVI trends along with the temporo-spatial aridity changes. The inset figure shows the frequency of grids in each AI (a) or AI trend group (b). Shade shows the standard deviation of NDVI trends (a), (b). The numbers in the ellipse and oval flatness denote the average value and direction of NDVI trends, respectively (c). Right-slanted ellipses denote increasing NDVI, whereas left-slanted ellipses denote decreasing NDVI (c). The dotted lines represent the boundary of subtypes, which was divided with AI value in Y-axis, which denote the hyper-arid, arid, semi-arid, and dry sub-humid regions from up to down, respectively (c).
Download figure:
Standard image High-resolution imageThe temporal AI trends that denote the turning point from greening to browning decreases as spatial AI increases, when drying occurs (figure 4(c)). The AI trend threshold that shifts from greening to browning is –3 × 10⁻³ yr–1 and −4–−6 × 10⁻³ yr–1 in semi-arid and arid sub-humid regions, respectively. An asymmetric pattern in the NDVI trend amplitude variation is observed during drying and wetting in all subtypes. For instance, in arid subtype regions, the average NDVI trends for drying are 0.1 × 10⁻³ yr–1, 0.2 × 10⁻³ yr–1, and 0.13 × 10⁻³ yr–1, and for wetting are 0.15 × 10⁻³ yr–1, 0.15 × 10⁻³ yr–1, and 0.05 × 10⁻³ yr–1 within the range of 1 × 10⁻³ yr–1, respectively.
Grouped AI trends and NDVI trends at the AI interval of 0.05, and similar AI turning points are 0.38 (p < 0.001) and 0.42 (p < 0.001), respectively (figure 5(a)). AI trends increase when AI < 0.38 and decrease when AI > 0.38. NDVI trends slightly increase when AI < 0.42, and increase at an accelerated rate when AI > 0.42, with a spatial AI increasing gradient. Then, we divided the drylands into two groups based on the AI value of 0.4, with a mean of 0.38 and 0.42, and a divergent pattern of vegetation response to drying and wetting trends was observed (figures 5(b), (c)). NDVI trends first increase and then decrease as AI < 0.4, whereas they decrease as AI > 0.4, with AI trends increasing from drying to wetting trends. Although greening dominates the drylands (figure 5(d)), browning occurs when the AI trend exceeds the threshold of drying or wetting trends (figures 5(b) and (c)). This suggests the importance of threshold identification and the response pattern of vegetation response to drying and wetting trends in predicting vegetation productivity dynamics. Furthermore, buffer regions of AI threshold around 0.35 < AI < 0.45 across the overall drylands from eastern north to western south (figure 5(d)).

Figure 5. Variation of AI trends and NDVI trends follow changes in AI (a). Variation of NDVI trends follow changes in AI trends when 0 < AI < 0.4 (b) and 0.4 ≤ AI < 0.65 (c). Geographical distribution of NDVI trends and the P value and the region of 0.35 < AI < 0.45 (d). Blue and red circles indicate the average value of AI trends and NDVI trends within each AI group (a). Black circles indicate the average value of NDVI trends within each AI trend group (b), (c). Bars denote one third of standard deviation. AItp showed the turning point of AI value derived from the regression equation (a), (b).
Download figure:
Standard image High-resolution image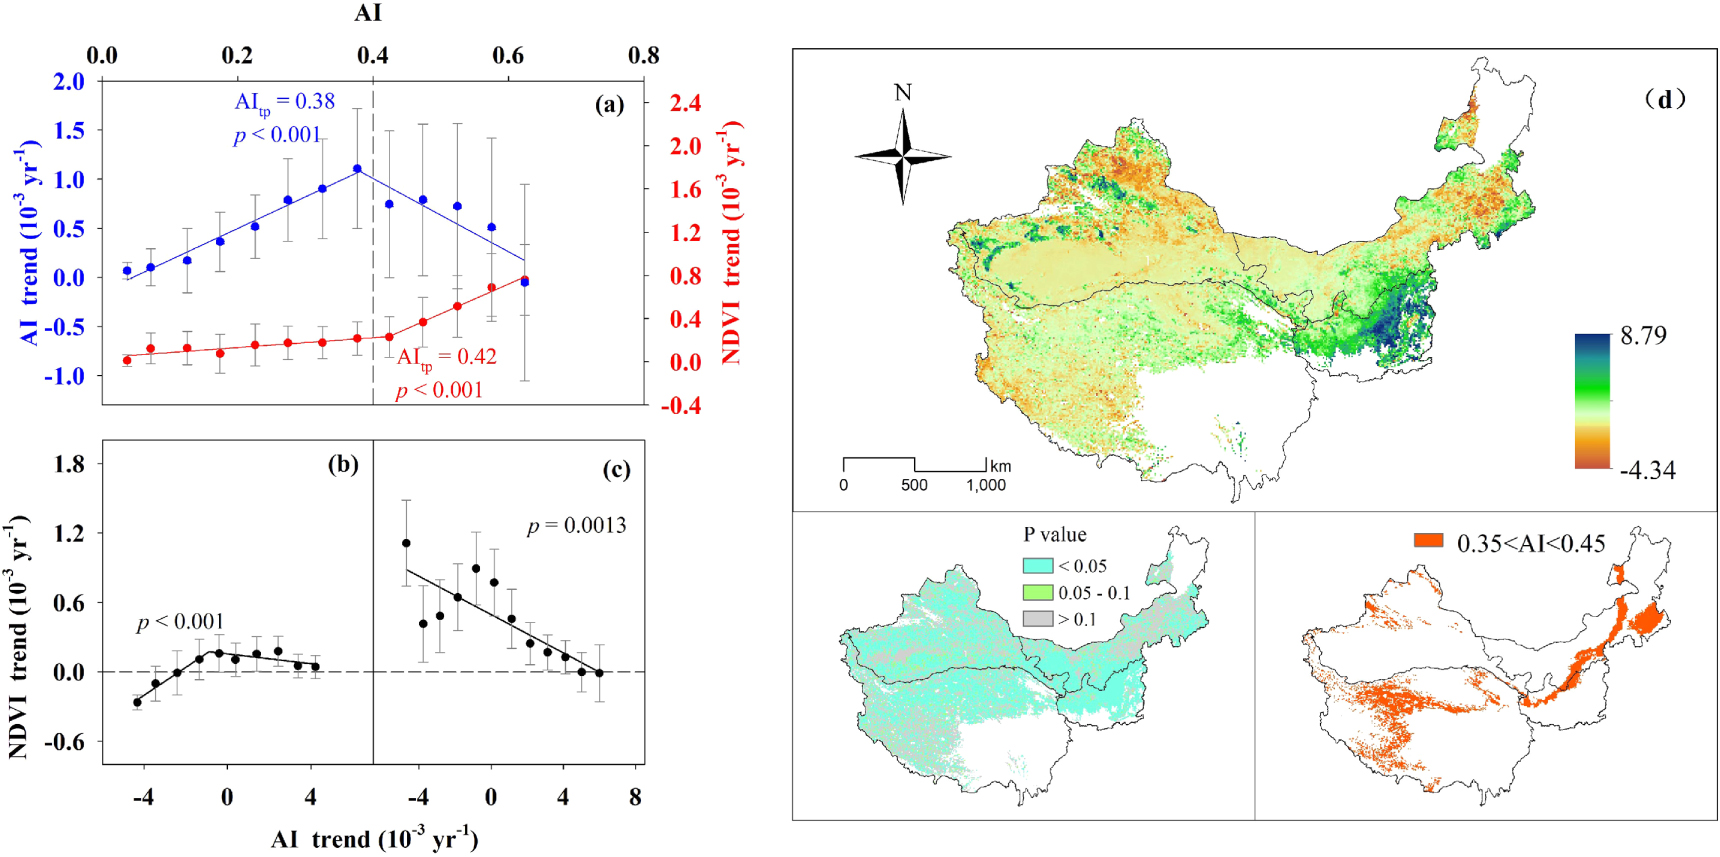
4. Discussion
4.1. Variation of temporo-spatial aridity
The drylands of East Asia exhibited relatively small changes in both the area and average AI value compared to their subtypes (hyper-arid, arid, semi-arid, and dry sub-humid regions) over time period from 1982 to 2015. This indicates that transformations among different subtypes probably occurred and would result in an abrupt change in vegetation productivity (Xu et al 2018) for the distinct response across the aridity threshold. It implies that the local effect of aridity changes should be taken into consideration as they probably produce large uncertainty in vegetation growth that usually is hidden by the regional large-scale change characteristic. The variability in the extent and AI value of the whole dryland was weaker than that in each subtype. This indicates that a transition existed among subtypes that could have been masked and should be considered in the future. Transitional areas may even result in a shift for the entire dryland in response to an abrupt change in each subtype.
Average wetting was in agreement with other reports that the increase in precipitation is much greater than the decrease in potential evapotranspiration (Wang et al 2011, Wu et al 2011). Results conformed to the wetting trends evidently (Huo et al 2013, He et al 2019), and did not fully follow the 'dry gets drier and wet gets wetter' paradigm, which was consistent with the previous reports (Greve et al 2014, Huang et al 2015). Prevalent drying and wetting trends were observed for each aridity gradient group. A mixture of drying and wetting trends counteracting each other led to smaller overall trends, agreeing with the conclusion of small changes in global aridity that were derived using different aridity indicators (Sheffield et al 2012, He et al 2019). This emphasizes the importance of heterogeneity in the magnitudes and areas of drying and wetting trends for ecosystem responses to climate change. Moreover, the heterogeneity of wetting and drying trends would probably cause the average drying, and then the unreasonable attribution of drying to warming alone, which could lead to misinterpretation of the terrestrial and atmospheric feedbacks (Sheffield et al 2012, Zhou et al 2019). This emphasizes the importance of the spatial pattern of drying and wetting trends.
4.2. Vegetation response to drying and wetting trends
Vegetation greening predominated in our study region, confirming the previous conclusion that the drylands of Asia showed increases in NDVI (He et al 2019). We observed a shift in changes in AI trends and vegetation trends across a spatial AI threshold of nearly 0.4. This means that spatial aridity changes would result in the transition of distinct vegetation response to drying and wetting, which could be explained by the different capacity of resistance to drought among the subtypes (Xu et al 2018). When drying occurred, NDVI trends did not appear to decrease immediately; rather, it first increased (greening) and then decreased (browning). The capacity of resistance depended on the spatial aridity, which improved with increasing spatial AI (wetter). The reason for this is that soil degradation and low water availability constrain photosynthesis and the simple and fragile system structure and ecosystem functions in drier ecosystems (Huang et al 2015, Zhao et al 2019b). The threshold of drying trends existed from positive NDVI trends to negative NDVI trends in each subtype, which decreased with increasing spatial aridity. In drylands, vegetation activity is constrained by water availability (Zhao et al 2020) and is positively correlated with the AI (Huang et al 2015). NDVI trends presented regional differentiation along the aridity gradient, which was lower in drier regions than in wetter regions due to low vegetation cover and productivity (Xu et al 2019). The trajectory of vegetation trends in response to temporal changes in aridity is regulated by the spatial aridity gradient. Our findings suggest the importance of the region with an AI of approximately 0.4, and the changes in the extent of these regions could provide an early warning of the ecosystem shift under climate change. Our results indicate that vegetation greening was observed in most regions with moderate drying and wetting trends. Excessive drying and wetting hindered the NDVI increase. Vegetation dynamics exhibited a nonlinear relationship with climate change (Zhao et al 2020, Berdugo et al 2020). First, greening was attributed to the strong acclimation of the grasslands, which cover most of the drylands, to climate change, leading to the development of high resilience and a high ability for plant growth to recover from adverse conditions (Marcolla et al 2011, Reichstein et al 2013). Second, grassland was a typical vegetation that is highly sensitive to drying (Zhang et al 2017). Drought events substantially decreased terrestrial carbon sequestration (Ciais et al 2005, Zhang et al 2017, Xu et al 2019, Zhao et al 2019a), but the effect of a single drought event on vegetation productivity might not be significant if it contradicted long-term trends owing to the nested structure of hierarchical complexity (Ryo et al 2019). Lastly, wetting promotes increased carbon sequestration in water-constrained drylands, but NDVI did not increase indefinitely owing to the shift of dominance to other environmental factors that affected plant growth (Keenan and Riley 2018, Zhao et al 2020).
4.3. Uncertainties
There are some uncertainties as follows. First, owing to the absence of continual monitoring of soil moisture data over a long period at the regional scale, using satellite data to investigate the effect of changes in aridity on vegetation activity may lead to underestimation of the results (Wang et al 2011, Stocker et al 2019). Cross-validation was necessary using observational data in the field. The AI should be combined with the impact of environmental changes on the relationship between vegetation and water to avoid overestimating the actual aridity intensity (Keenan et al 2020). Aridity index represent the changes of aridity to clarify its impact on vegetation activity in this research, and could not mirror the complex nature of aridity fully. Second, ecosystem shifts have occurred frequently in the past, but it is a challenge to characterize the impact of current climate change on vegetation. Note that the threshold is not fixed, but will change over time as a result of vegetation adaptation to climate change in the long term e.g. over centuries or even millennia (Hillebrand et al 2020). Research on threshold changes based on long-term data is important. Third, a specific ecosystem occupies a temporo-spatial niche that can maintain the state of dynamic equilibrium. Excessive drying or wetting can lead to ecosystem imbalance and even collapse. Wetting and drying trends exhibited high spatial heterogeneity, and the threshold of ecosystem productivity shift between subtypes would be determined by the dynamic balance between the response and adaptation of ecosystems to aridity trends. Lastly, short-term (multiple-event) and long-term (overall trend trajectory) processes would be analogous to local and regional-scale examinations in spatial ecology research (Ryo et al 2019). A shift in the ecosystem would occur at varied time scales, depending on the covariation between the internal variability and its sensitivity to external forcing (Hall et al 2019). It will be necessary to combine long-term field observations with the terrestrial system model (Sheffield et al 2012, Piao et al 2019, Berdugo et al 2020) to explore the mechanisms underlying the response of ecosystems to climate change.
5. Conclusions
We investigated the changes in the extent and the AI value of drylands and then explored the NDVI trend response to temporo-spatial aridity changes in drylands of East Asia during 1982–2015. No significant changes were observed for the whole dryland, but there was an increased variability for dryland subtypes (hyper-arid, arid, semi-arid, and dry sub-humid regions). Average wetting was prevalent in all the subtypes owing to both the area, and the AI trends of wetting doubling that of drying. Distinct vegetation adaptive patterns for drying and wetting trends across an aridity threshold indicates that the transformation of subtypes might lead to ecosystem shifts. It emphasizes the importance of the monitoring of subtype dynamics and the importance of the transition zone for the prediction of terrestrial carbon dynamics. Avoiding further dryland expansion and paying more attention to the transition zone between subtypes is significant for understanding the evolution of climate-carbon feedback and providing an early warning of vegetation changes in global drylands.
Acknowledgments
This study was supported by the International Partnership Program of Chinese Academy of Sciences (121311KYSB20170004), and China Postdoctoral Science Foundation (2020M670439).
Data availability statement
The data that support the findings of this study are openly available at the following URL/DOI:https://ecocast.arc.nasa.gov/data/pub/gimms/3g.v1/; http://data.cma.cn/en.
Conflict of interest
The authors declare that they have no conflict of interest.
Author contributions
Wei Zhao and Xiubo Yu conceived the study. Wei Zhao and Yu Liu collected and analyzed the data, and drew the graphs. Wei Zhao wrote the manuscript. Li Xu, Zhi Chen and Shenggong Li reviewed and revised the manuscript.