

Abstract
Africa's economic and population growth prospects are likely to increase energy and water demands. This quantitative study shows that energy decarbonisation pathways reduce water withdrawals (WWs) and water consumption (WC) relative to the baseline scenario. However, the more aggressive decarbonisation pathway (1.5 °C) leads to higher overall WWs than the 2.0 °C scenario but lower WC levels by 2065. By 2065, investments in low-carbon energy infrastructure increase annual WWs from 1% (52 bcm) in the 2.0 °C to 2% (85 bcm) in the 1.5 °C scenarios of total renewable water resources in Africa compared to 3% (159 bcm) in the baseline scenario with lower final energy demands in the mitigation scenarios. WC decreases from 1.2 bcm in the 2.0 °C to 1 bcm in the 1.5 °C scenario, compared to 2.2 bcm in the baseline scenario by 2065, due to the lower water intensity of the low-carbon energy systems. To meet the 1.5 °C pathway, the energy sector requires a higher WW than the 2.0 °C scenario, both in total and per unit of final energy. Overall, these findings demonstrate the crucial role of integrated water-energy planning, and the need for joined-up carbon policy and water resources management for the continent to achieve climate-compatible growth.
Export citation and abstract BibTeX RIS

Original content from this work may be used under the terms of the Creative Commons Attribution 4.0 license. Any further distribution of this work must maintain attribution to the author(s) and the title of the work, journal citation and DOI.
1. Introduction
Africa is facing severe water and energy challenges [1]. Population increase [2], together with rapid urbanization [3] and economic growth [4], are expected to increase water and energy needs in Africa. The interdependency of these two resources is important for Africa, which is vulnerable to climate change [5]. The continent hosts economically diverse countries (figure 1) with unevenly distributed energy and water resources (supplementary B table 16 available online at stacks.iop.org/ERL/17/044048/mmedia).
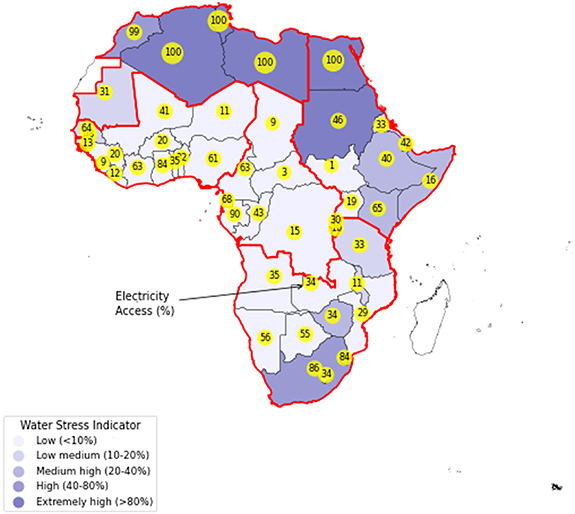
Figure 1. Water stress (%) indicator (2013–2017) and electricity access level (%) (2016) by country. The level of water stress: freshwater withdrawal as a proportion of available freshwater resources is the ratio between total freshwater withdrawn by major economic sectors and total renewable freshwater resources, after taking into account environmental water requirements [27]. Electricity access refers to the percentage of people in a given area that have, stable access to electricity. Countries are grouped into power pools shown by the red outline. The list of countries per power pool is shown in table 1. (Data source: FAO [28], IEA [7], Map created by the authors.)
Download figure:
Standard image High-resolution image
Figure 2. Water withdrawal and consumption in Africa across the scenarios (in mcm). (a) Water withdrawal in a million cubic meters (mcm) across the Reference, 2.0 °C and 1.5 °C scenarios in 2015 and 2065. Note in the Reference scenario in 2065, Egypt withdraws ∼32000 mcm and Nigeria ∼72000 mcm—these values are clipped at 20000 mcm on the plot. (b) Water consumption in mcm across the Reference, 2.0 °C and 1.5 °C scenarios in 2015 and 2065. (c) Water withdrawal in mcm at a continental level across the Reference, 2.0 °C and 1.5 °C scenarios. (d) Water consumption in mcm at a continental level across the Reference, 2.0 °C and 1.5 °C scenarios. The evaporative losses due to hydropower are not included in the water consumption figures.
Download figure:
Standard image High-resolution imageTable 1. List of African countries per power pool considered in the analysis (with the ISO 3166-1 alpha-2 [29] country code in brackets).
| Central Africa (CAPP) | Eastern Africa (EAPP) | Northern Africa (NAPP) | Southern Africa (SAPP) | Western Africa (WAPP) |
|---|---|---|---|---|
| Cameroon (CM) | Burundi (BI) | Algeria (DZ) | Angola (AO) | Benin (BJ) |
| Central African Rep. (CF) | Djibouti (DJ) | Libya (LY) | Botswana (BW) | Burkina Faso (BF) |
| Chad (TD) | Eritrea (ER) | Mauritania (MR) | Lesotho (LS) | Côte d'Ivoire (CI) |
| Congo (CG) | Ethiopia (ET) | Morocco (MA) | Malawi (MW) | Gambia (GM) |
| Democratic Rep. of Congo (CD) | Kenya (KE) | Tunisia (TN) | Mozambique (MZ) | Ghana (GH) |
| Equatorial Guinea (GQ) | Rwanda (RW) | Namibia (NM) | Guinea (GN) | |
| Gabon (GA) | Somalia (SO) | South Africa (ZA) | Guinea Bissau (GW) | |
| Sudan (SD) | Swaziland (SZ) | Liberia (LR) | ||
| South Sudan (SS) | Zambia (ZM) | Mali (ML) | ||
| Tanzania (TZ) | Zimbabwe (ZW) | Niger (NE) | ||
| Uganda (UG) | Nigeria (NG) | |||
| Egypt (EG) | Senegal (SN) | |||
| Sierra Leone (SL) | ||||
| Togo (TG) |
Northern and Southern Africa are two of the most water-stressed regions in the continent (figure 1). Overall, more than 300 (∼25%) million people in Africa live in water-scarce regions [3, 6]. Furthermore, the reliable supply of water is prone to disruptions in countries with low energy access [7, 8]. The Central and Western regions contain the highest share of Total Renewable Water Resources (TRWR) [9], 53% and 25%, respectively, while Northern Africa the lowest (1%). This distribution makes an integrated energy-water approach fundamental to mitigate future challenges [10].
Fuel processing and power plant operation require different amounts of water, indicated as water withdrawal (WW) and water consumption (WC). WW [11] is the amount of water removed from the ground or diverted from a water source for use. WC [11] is the amount of water that is evaporated, transpired, incorporated into products or crops, or otherwise removed from the immediate water environment and not returned to the original water source after being withdrawn (also called blue water footprint [12]). The reliable operation of thermal power plants depends on water availability [13] and water temperature for cooling purposes. They comprise a high share (81%) of installed electricity production capacity in Africa in 2016 [14], showing an increasing trend in the future [14, 15]. Water is also required for household use and agricultural purposes [16, 17]. Therefore, water availability is a crucial component of a nation's energy security together with energy resources [3, 18–23], geopolitical stance [24] and energy strategy [25, 26].
Computational models provide insights into the continent's future energy transformation, energy-water nexus linkages and climate change [30]. Flörke et al [31] conducted a global water use assessment using a water model in 177 countries during 1950–2010, demonstrating the relationship between water use and global-socioeconomic development. Lohrmann et al [32] estimated water demand for power production on a global, regional and country-level with mitigation strategies for the period 2015–2050 considering a high temporal and spatial resolution. Pavicevic et al [33] modelled the power system of Africa with a higher temporal resolution (8760 time periods in a year) than this study, considering the effect of climate change (39 climate years). They modelled the power system of Africa, using the Dispa-SET unit commitment and power dispatch module soft-linked it with the LISFLOOD model and examined two scenarios (Baseline, High interconnection) [34]. However, the Dispa-SEt is a rolling-horizon optimal dispatch model (horizon length of four days, base year 2018) and does not optimise power system capacity expansion. Previous studies on estimating water requirements in the energy sector have focused on either a continental [35–38] or regional [25, 26, 39, 40] level. Several studies have examined the effects of climate change upon the power sector, such as supply disruption [26, 41–43], increase in electricity prices [44] and environmental impacts [45–48].
This study builds on past work by providing a quantitative multi-annual analysis estimating energy requirements, WW and consumption, carbon dioxide emissions, and costs of covering the future needs of the energy system in Africa, including trade links among the African nations. A continental-scale analysis captures the disparities in energy and water resources between nations and resulting energy trade flows, essential for understanding a cooperative whole-Africa response to climate change.
The energy systems of forty-eight African countries, with a focus on the power sector, are modelled individually using an open-source cost-optimization modelling framework (OSeMOSYS) [49]. We model three different original scenarios for the period 2015–2065 [50]. The Reference scenario assumes no change from national renewable energy policies after 2017. In two mitigation scenarios (2.0 °C, 1.5 °C), the final energy demands are lower due to energy efficiency measures and the annual emission levels are constrained to the emission pathways compatible with the 2.0 °C, 1.5 °C scenarios [51, 52]. For each one of the scenarios, the influence of water availability in the energy system is examined. The matrix of scenarios analysed is available in appendix table 2.
2. Methodology
We developed a model to evaluate energy supply and water requirements to cover the energy needs of the African continent during the period 2015–2065. The model was developed using the open-source modelling system for long-term energy planning OSeMOSYS [49]. The objective function is to minimize total energy system costs, rather than, for example, co-optimize the energy and water sectors. Other energy resources were also included in the model except for adding the water analysis, and the dataset was updated based on the latest available information. The OSeMOSYS model developed to conduct the study 'Energy projections for African countries' [50], itself was further extended from the TEMBA [34] model. For the purpose of this study, the model by Pappis et al [50] was further extended by including the following: (a) country specific fuel export possibilities, (b) water loss due to evaporation in hydropower plants, (c) the influence of water availability in the evolution of the energy system by examining 15 more scenarios and (d) WWs for fuelwood consumption in the households sector by collecting more data relevant to WC factors for fuelwood production in each African country and linking the OSeMOSYS results with an accounting model. Furthermore, the latest available data on the energy system of Africa was also updated, considering national energy policies. The above additions make the latest version of the TEMBA model [50] (used for this study) one of the most detailed frameworks available on Africa, that can facilitate the dialogue on future energy pathways inclusive of the water footprints. In the following subsections, the detailed methodology to develop the model is described.
2.1. Energy-water model development
The energy-water model was developed using the OSeMOSYS [49] for medium to long-term energy planning. OSeMOSYS is a bottom-up modelling framework that uses linear optimization techniques to satisfy an exogenously defined energy demand. OSeMOSYS has been employed in the scientific literature to provide insights on possible transformation pathways of large energy systems and their impacts on the economy, society and the environment [53]. The open-source method of the study assists in overcoming the lack of transparency needed to address future long-term decarbonisation trajectories [54].
The electricity supply system, including a simple representation of other energy sources (heavy fuel oil, light fuel oil, gas, coal, biofuel & waste), of forty-eight (48) African countries was modelled individually and linked via electricity interconnectors and natural gas pipelines to shape the African model. Countries were then associated with the following regional power pools [55]: Central African power pool (CAPP), East African power pool (EAPP), Northern Africa power pool (NAPP), South African power pool (SAPP) and Western African power pool (WAPP) to identify trades. NAPP, as it is reported here, is officially called the Maghreb Electricity Committee, or COMELEC. The analysis provided results on a continental-regional-country level at an annual temporal resolution for the period 2015–2065. Country-specific hourly electricity generation profiles and seasonality of the electricity load were considered in the analysis.
To estimate the WW and consumption per type of technology and consequently the water demand by a country, we considered different cooling types: dry cooling, natural and mechanical draft tower, once-through cooling tower with freshwater (OTF) and once through cooling tower with salt water (OTS) per type of technology (power generation). Based on the identified cooling type, specific water factors were assigned (supplementary B table 24).
The detailed methodology is presented in the supplementary material A section.
2.2. Decarbonisation scenarios
To explore plausible future developments of the African energy sector, we developed three scenarios. The Reference scenario assumes that there is no change from the national renewable energy policies after 2017. In the two mitigation scenarios (2.0 °C, 1.5 °C), the fuel demands of each African country are derived from the JRC GECO 2018 report [51] and disaggregated based on socio-economic factors (gross domestic product (GDP) [51], population [2]). The mitigation scenarios (2.0 °C, 1.5 °C) assume future emission reduction targets aiming at a global mean temperature increase of 2.0 °C with a 67% probability [51, 52] and 1.5 °C increase with a 50% probability by 2100. The emission reduction targets under these scenarios are modelled as emission limits posed on a regional and not country level.
In the Reference scenario, the carbon dioxide emissions increase by approximately three times, compared with 2015 levels, reaching to 3466 Mt of CO2 by 2065. The annual emission levels are constrained to the emission pathways compatible with the 2.0 °C, 1.5 °C scenarios [51, 52]. Carbon removal technologies were also introduced in these two scenarios.
Under the 2.0 °C and 1.5 °C scenarios, we assume the implementation of energy efficiency policies and a significant reduction in fossil fuel consumption (figure 4). Consequently, the total final energy demand increases by only 79% and 49%, respectively, by 2065 over 2015 levels instead of 148% in the Reference scenario.
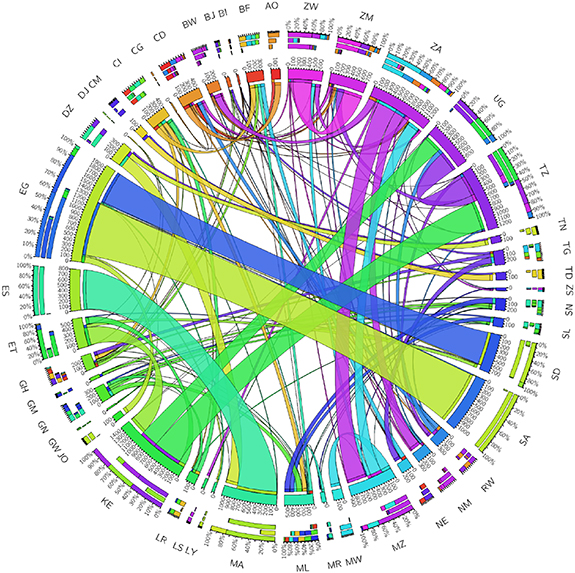
Figure 3. Cumulative electricity trade (2015–2065) among the African countries in the Reference scenario (in TWh). The outer circle represents the ISO 3166-1 alpha-2 [29] country code of each African country. The three bars (percentage mix), starting from the outlying to the innermost bar, refer to (i) exported electricity, (ii) imported electricity, (iii) the difference between the exported and imported electricity. The colour of the bar (arc), on the inner circle, is specific to the country where electricity is exported or imported from and the scale indicates the absolute values of electricity trade in TWh. Flow bands present the traded electricity among the countries. Flow bands attached to a country's inner circle represent exports from that country and vice-versa. Country codes can be found in table 1 (ES: Spain, JO: Jordan, SA: Saudi Arabia). The cumulative electricity trade among the African countries in the 2.0 °C and 1.5 °C scenarios can be found in the supplementary A (figures 52 and 53).
Download figure:
Standard image High-resolution image
Figure 4. Total final consumption (Mtoe) and total primary energy supply in Africa across the scenarios. (a) Total final consumption (Mtoe) in Africa across the scenarios (2015, 2065). (b) Total primary energy supply (Mtoe) in Africa across the scenarios (2015, 2065).
Download figure:
Standard image High-resolution image2.3. Influence of water availability scenarios
The influence of future water availability in each country is considered in the optimization process in two different ways. For hydropower plants, different capacity factors are considered according to a dry and a wet scenario developed by Sterl et al [56]. The capacity factors from Sterl et al [56] have been adapted to the timescale considered in this article (more information presented in the supplementary material A). For thermal plants with cooling systems, different options are considered. The WW for cooling is restricted, implemented as a share of the withdrawal from the scenarios (Reference, 2.0 °C and 1.5 °C) accordingly. In the first case, water availability refers to the availability of river flow and reservoirs modelled as changes in capacity factors for hydropower plants. In the second case, water availability is linked to WW for thermal power plant cooling, Four different cooling types considered in the analysis (dry cooling, natural and mechanical draft tower, OTF and OTS), so water availability refers to freshwater and saline water used. However, water availability is not categorised in freshwater and others in this study and the optimization process (appendix table 2).
3. Results
Our results show that fossil fuels remain the least-cost option in countries currently under high risk of water scarcity, further increasing their WWs in the future. Under mitigation scenarios (2.0 °C, 1.5 °C), a reduction in demand in comparison to the Reference scenario, coupled with low-carbon technologies, leads to an increase in WW. This transformation highlights the role of nuclear, solar photovoltaic (PV), hydropower and carbon capture with storage technologies (CCS) in Africa's energy future. Higher levels of electricity and gas trade are required to achieve lower emission limits affordably, highlighting the role of transit countries and key net exporters. Nevertheless, higher electricity exports in specific countries lead to higher levels of WW and consumption.
3.1. Future energy sector water requirements in the African continent
In the Reference scenario, WWs in Africa grow by almost eight times from 2015, reaching 159 billion cubic meters (bcm) in 2065. This increase corresponds to approximately 3% (in 2065) of the TRWR (5290 bcm in 2015) in the continent [28], assuming no changes in future precipitation patterns. This growth is mainly due to the penetration of high water-intensive technologies (coal, oil) and increased hydropower share. However, WC remains relatively constant between 2015–2065, reaching 2 bcm in 2065, primarily due to the penetration of renewable energy technologies.
In the Reference scenario, in the NAPP and CAPP, there is a decrease in WC due to the transformation of the future energy mix to a higher share of renewables and the use of less water-intensive thermal generation technologies. On the other hand, in the EAPP, SAPP and WAPP, the increase in WC is explained by the adoption of water-intensive thermal generation technologies. NAPP, EAPP and WAPP experience increased WWs by 2065 while SAPP and CAPP experience a decrease, 13% and 61%, respectively.
In the mitigation scenarios, overall WW increases over time (2.0 °C, 52 bcm, TRWR 1%) (1.5 °C, 85 bcm, TRWR 2%). This increase is lower than that in the Reference scenario, 67% and 47% lower in the 2.0 °C and 1.5 °C scenarios, respectively, by 2065. Also, decarbonizing the energy sector further decrease WC from 1.2 bcm in the 2.0 °C to 1 bcm in the 1.5 °C scenario, compared to 2.2 bcm in the baseline scenario by 2065 (figure 2). These results support the message that pathways towards decarbonisation of the energy sector in Africa lead to higher WW and lower WC. This observation highlights the critical role of clean technologies with a low water footprint versus hydropower with integrated water resources management that secures water for other purposes (e.g. agriculture, municipal services).
Each power pool presents a different transformation pathway regarding WW and consumption. National and regional policies need to differ based upon the specific energy and water context of African nations. Specifically, EAPP shows higher WC in the 2.0 °C than the Reference scenario. This increase is primarily due to the higher penetration of natural gas technologies in Egypt. Egypt increases its primary energy production due to a decrease in the country's imports and an increase in its electricity exports. Similarly, WAPP increases WC more in the 2.0 °C than the Reference scenario, mainly due to nuclear investments in Mali. SAPP exhibits the most dramatic transformation in WWs in deeper decarbonisation of the energy system. Higher WWs are required in the mitigation scenarios than the Reference primarily due to nuclear and carbon capture investments with sequestration. Consequently, WC is considerably less in the mitigation scenarios than in the Reference. This transformation is mainly due to changes in the energy mix in Angola, South Africa and Zimbabwe which increase their exports in the mitigation scenarios. Lastly, investments primarily in CCS technologies (with biomass) in Egypt, Morocco, Chad, Guinea, Gabon, Uganda, Nigeria, Benin, Côte D Ivoire, Ghana, Senegal, Mali, increase WWs to higher levels in the 1.5 °C than the 2.0 °C scenarios (supplementary figures 2–10).
In the Reference scenario, the evaporative losses due to the increased use of hydropower plants increase almost four times (174 bcm) by 2065. To attain deep decarbonisation goals in the energy sector (1.5 °C), higher use of hydropower plants is required, leading evaporative losses to reach 180 bcm by 2065. The WAPP is responsible for the majority of these losses while the NAPP the minority. Notably, countries with considerable hydropower potential (e.g. Angola, Cameroon, DRC, Ethiopia, Nigeria, Zambia) experience increased evaporative losses in the future (supplementary B figures 11–13).
The evolution of fuelwood consumption in households is another important aspect influencing overall WC in the continent. Specifically, in the Reference scenario, the green (precipitation) and blue water (groundwater through capillary rise) [57] consumption was 7435 mcm and 354 mcm in 2015, and increases to 8270 mcm and 396 mcm in 2065, respectively. This increase is because fuelwood consumption in households corresponds to most of the biofuels and waste demand in the energy sector in Africa. WAPP represents most of the fuelwood WC amongst the African Power Pools, primarily due to Nigeria since it also has higher WC factors than NAPP and SAPP. EAPP (Ethiopia) has the 2nd highest WC in Africa, followed by SAPP (Democratic Republic of Congo), CAPP (Cameroon) and NAPP (Libya). All the power pools increase their water needs while NAPP presents the highest rise despite its lowest WC for fuelwood overall. To decarbonize the energy system, higher levels of green (2.0 °C-9447 mcm, 1.5 °C–9144 mcm) and blue WC (2.0 °C–477 mcm, 1.5 °C–454 mcm) are required (supplementary B figures 14–15).
3.2. The role of inter-regional trades, national mega-projects and transit countries
Fossil-fuel reserves, renewable potential and water resources are unevenly distributed in Africa. The results show how trade among African countries could support more affordable attainment of lower emission levels, decrease electricity generation costs and influence water resources management. However, the drivers of trade to minimize the overall energy system costs (on a continental level) interact with the differences in national energy resources of neighbouring countries, differences in energy demand, and technological availability.
The largest electricity net exporters by 2065 are Kenya, South Africa and Sudan, while the main net importers are Uganda, Burkina Faso and Mali. The high potential for renewables in the EAPP makes the region the largest net exporter of electricity. Besides, some exporting countries assist importing countries in decreasing their fossil-fuel dependency in the decarbonisation scenarios. Zimbabwe is one of the countries which undergo a transformation from a net exporter in the Reference scenario to a net importer in the decarbonisation scenarios to reduce its fossil fuel-based generation capacity, importing on average 14 TWh of electricity annually. Also, the importing countries use imports to decrease their electricity supply costs (e.g. Kenya). The potential implementation of the Grand Inga project in the Democratic Republic of Congo, together with trade links, could increase the electricity exports to neighbouring countries and displace part of their fossil-fuel-based generation.
A notable finding of this study is identifying some countries as transit traders, including Egypt, Sudan, South Africa and Tanzania (figure 3). Indicatively, under the Reference scenario, Egypt imports 659 TWh (94%) of its cumulative electricity imports from Sudan. Egypt also exports approximately 1194 TWh (96%) of its cumulative electricity exports (2015–2065) to Asia. In parallel, 64 TWh or 15% of Sudan's total electricity exports are derived from imports of electricity generated in Ethiopia.
These results highlight the importance of an enhanced electricity trading scheme on the continent to reduce greenhouse gas emissions and system costs. Nevertheless, this could come at the expense of increasing WW and consumption in the main electricity exporter countries in the Reference scenario, particularly Ethiopia, Guinea, South Africa and Zimbabwe, having consequences for managing their national water. However, countries such as Congo, which increase their electricity net imports in all scenarios, experience a concurrent decrease in WC. Investment decisions in large hydro-electricity generation projects cannot be separated from water resource management and electricity trade and require regional coordination across countries, tailored to the local geopolitical and hydrological realities.
Also, specific gas pipeline projects (e.g. West African, Trans-Saharan) could change the role of certain countries (Algeria, Mozambique, Nigeria) to energy exporters, assisting neighbouring countries to transform their energy sector.
3.3. Transformation of the energy system
The evolution of the energy mix of a core group of fossil fuel resource-rich countries plays an essential role in African greenhouse gas emissions. For example, South Africa and Lesotho are responsible for most of the continent's coal consumption' Nigeria and Egypt are large consumers of oil products. The results show that Algeria, South Africa, Nigeria, Egypt and the Democratic Republic of Congo consume most of the continent's natural gas, in final energy terms. The analysis of how the final energy consumption evolves among the scenarios can be found in supplementary B.
In the Reference scenario, the total African primary energy supply more than doubles compared to 2015, reaching 1853Mtoe by 2065. While the share of fossil fuels increases over the years (64%), renewables experience a gradual decrease, eventually reaching 36% of the total primary supply by 2065 (figure 4). Without a carbon constraint, coal, as the cheapest source of electricity, constitutes most of the continent's primary energy supply, followed by oil and biomass. Nuclear power disappears from the electricity supply system by 2065. The WAPP stands out as the largest energy supplier (35%) in Africa, followed by EAPP (28%), SAPP (19%), NAPP (11%) and CAPP (7%) in 2065. WAPP is also the largest supplier (37%) of fossil fuels and renewables (32%) in the continent in 2065.
However, in the 2.0 °C and 1.5 °C scenarios, due to the relatively lower final energy demand, African countries increase their 2065 total primary energy supply by only 50% and 31%, respectively, compared to 2015. Moreover, the primary supply of fossil fuels in those two scenarios declines dramatically throughout the years, reaching 27% and 8% by 2065. On the contrary, renewables increase by 64% and 72%, respectively, by 2065 (figure 4).
As natural gas reserves are scattered among nations, the role of natural gas trade through pipelines and liquified natural gas (LNG) terminals is key to decarbonize the African energy system. Countries with natural gas reserves, such as Algeria, Nigeria, or Mozambique, increase their natural gas exports significantly to reduce the consumption of more polluting fossil fuels in the continent. In particular, Mozambique increases its gas exports to South Africa for replacing coal in the power sector with natural gas.
Under the mitigation scenarios, natural gas supply to Europe through the Northern African countries gradually declines, which is in line with Europe's aim to become a climate-neutral continent by 2050. The Western African power pool and specifically Nigeria, are the leading natural gas supplier in the African continent. Several coastal countries (Côte D Ivoire, Ghana, Morocco, Sudan, Senegal, Tunisia, Tanzania and South Africa) increase their LNG imports. This increase in imports leads to lower emission limits by replacing the above countries' fossil fuel capacity in the power sector and decreasing their water requirements.
3.4. Evolution of the electricity supply sector
In the Reference scenario, the overall generation capacity in Africa rises ten-fold from 181 GW (2015) to 1863 GW (2065). The share of renewables increases from 19% (2015) to 78% (2065), while the percentage of thermoelectric capacity decreases from 82% (2015) to 22% (2065). Hydropower was the dominant renewable source in 2015. However, as the costs of renewable (solar, wind) technologies are declining throughout the years, solar PV technologies represent most of the continent's installed capacity by 2065. In the decarbonisation scenarios, the percentage of renewables reach even higher figure 86% (2.0 °C) and 87% (1.5 °C) in 2065 and resulting in generation capacities of 1843 GW (2.0 °C) and 1833 GW (1.5 °C).
In the Reference scenario, CAPP is electrified almost exclusively by renewables (94% of installed capacity) in 2065. At the same time, EAPP hosts most of the continent's renewable installed capacity (427 GW) and NAPP experiences the highest increase (46 fold) in all scenarios. As expected, CAPP becomes the leading hydropower producer as the Democratic Republic of Congo and EAPP (Sudan, Uganda) continue to invest in hydropower. Concentrated Solar Power technologies are limited to NAPP (Morocco) and EAPP (Egypt) and geothermal to EAPP (Kenya, Ethiopia). In mitigation scenarios, to achieve the emission targets, CCS technologies and nuclear power plants are required along with the replacement of coal-based power plants by natural gas.
Nevertheless, to encourage decarbonisation of the energy sector, the technological maturity of CCS technologies needs to be considered, along with the feasibility of nuclear energy in the African context. Socio-economic concerns of nuclear power exceed the scope of this analysis [58]. In decarbonisation scenarios, WAPP (Nigeria, Ghana), Egypt and Morocco present most of the continent's nuclear capacity in the future, mainly replacing thermal capacity. In the same scenarios, SAPP (Angola, South Africa, Zambia, Zimbabwe) invests in biomass with CCS technologies while Egypt invests in natural gas with CCS.
Our results show that to decarbonize the energy sector, the gas-fired power generation technologies and the penetration of renewables, CCS and nuclear technologies replace coal-based power generation. In the Reference scenario, electricity generation in Africa increases from 64Mtoe (2015) to 510Mtoe (2065). Renewables gradually penetrate the electricity mix reaching 57% (2065) from 18% in 2015 and 75% in both the 2.0 °C and 1.5 °C scenarios. Solar PV technologies followed by hydropower are the dominant power generation renewables in the future. In the Reference scenario, coal-based power generation is the primary thermal power source in the long-term instead of natural gas in the decarbonisation scenarios where thermoelectric generation is lower than in the Reference scenario (45% in 2065), specifically 34% (2.0 °C) and 31% (1.5 °C) by 2065.
Also, technologies combining CCS constitute 9% (2.0 °C) and 8% (1.5 °C) of the total electricity generation by 2065. An insight among the scenarios is that the coal-based power generation regions, SAPP and WAPP, replace their generation significantly by wind and solar in the first case while in the second case with natural gas and nuclear.
3.5. Finance
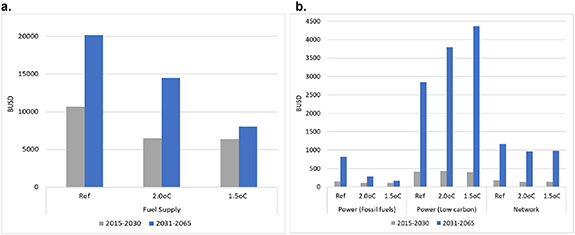
In the Reference scenario, the total system costs associated with the energy sector in Africa, including only the costs for the supply and conversion of energy and exclude costs on the demand side, are estimated at USD2015 24 520 trillion. Under the mitigation scenarios, the total costs, excluding costs of energy efficiency measures and welfare losses due to demand reduction, are lower by 29% (2.0 °C) and 54% (1.5 °C) than the Reference scenario for 2015–2065. In the mitigation scenarios, the penetration of renewable technologies leads to fuel supply savings of 32% (2.0 °C) and 53% (1.5 °C) compared to the Reference scenario (figure 5). As expected, mitigation scenarios are capital-intensive and the capital investments in the power sector are higher by approximately 9% (2.0 °C) and 19% (1.5 °C) compared to the Reference scenario (figure 5). Despite that, the lower operating expenses show that decarbonisation options, including energy efficiency measures, are beyond any doubt the cost-efficient pathways. This indicates that increasing the ambition of climate targets results in lower cumulative costs. All scenarios assume universal access to clean energy by 2065, hence the high investment projections in 2030–2065.
Figure 5. Comparison of fuel supply costs in the energy sector and capital investment costs in the power sector in Africa among the scenarios (in BUSD). (a) Comparison of fuel supply costs in the energy sector in Africa among the scenarios, (b) comparison of capital investment costs in the power sector in Africa among the scenarios.
Download figure:
Standard image High-resolution image
Therefore, developing strategies for the African continent should prioritize sustainable technologies, demand-side management, and set ambitious targets. This also applies to oil-producing countries of the continent (e.g. Algeria, Tunisia) since they are expected to profit from electricity trading leading to savings on their total fuel costs by 48% (2.0 °C)/46% (1.5 °C) and power system costs by 28% (2.0 °C)/7% (2.0 °C) compared to the Reference scenario, improving in parallel their water productivity by approximately 50%.
3.6. Influence of water availability in the transformation of the energy system
Water availability would affect the evolution of the energy system in Africa in different ways. Under limited hydropower-based generation, higher WWs and consumptions are required due to the higher penetration of fossil fuel technologies. Contrary, under decreased WWs for cooling purposes, WC also reduces in the Reference and mitigation scenarios. In the first case, more renewables are required, while in the mitigation scenarios, more nuclear investments (supplementary C).
In the Reference scenario, changes in water availability for hydropower plants result in higher WW (7%) and consumption (25%) under a Dry scenario, while under a Wet scenario result in lower withdrawals (1%) and higher consumptions (2%) by 2065. Compared to the Reference, the continental installed capacity under the Dry scenario is higher (1%) and under the Wet scenario is lower (3%) in 2065. Under the Dry scenario, the lower hydropower capacity factors mean that coal is more economically competitive, despite increasing WC and withdrawal. In the Dry scenario, the lower capacity of hydropower plants (62%) results in a higher capacity of coal power plants (18%) and other renewables (5%) by 2065. On the contrary, in the Wet scenario, higher capacity factors in hydropower plants lead to higher electricity generation than the Reference base scenario. However, the installed capacity of hydropower plants is lower (17%) in 2065 and of gas power plants is higher (6%) to meet the peak demand.
Also, the levels of electricity trades are estimated to be lower in the Dry scenario and higher in the Wet scenario than the Reference due to lower costs of generating electricity in the continent. CAPP is transformed from an exporter in the Reference base scenario to an importer in the Dry scenario, while SAPP from an importer in the Reference base scenario to an exporter in the Dry and Wet scenarios due to its coal-based power generation. Due to its hydro and coal-based generation, SAPP increases its exports under the Wet scenario.
Lastly, the changes in water availability affect the costs of generating electricity, with the Reference (Dry) scenario presenting the highest ones and vice-versa. The total system costs related to the power sector are higher in the Dry scenario (1.4%) than the Reference accordingly, while in the Wet scenario, lower (<1%) during 2015–2065 (supplementary B figures 59–139).
The 2.0 °C (Dry) and 1.5 °C (Dry) scenarios correspond to higher WWs and consumptions in the mitigation scenarios. In comparison, wetter ones lead to lower withdrawals and consumptions than the respective 2.0 °C and 1.5 °C base scenarios. To further decarbonize the energy system (1.5 °C), higher WWs are required under 1.5 °C (Dry) and 1.5 °C (Wet) scenarios than the 2.0 °C scenario combination, respectively, due to the higher penetration of nuclear and biomass technologies. However, in the 1.5 °C scenario, fewer WC is needed in Dry and Wet scenarios than in the 2.0 °C.
4. Conclusions
The results offer insights into how the policy agenda on sustainability and economic growth could be strengthened at the global and continental level by considering the interdependency of energy and water sectors in Africa.
Previous studies have highlighted the role of low-carbon electricity in meeting climate change targets. Our results indicate that to meet the 1.5 °C pathway, the African energy sector requires higher WW overall and per unit of final energy, so proper water resource management is essential. The reason behind this is the penetration of nuclear and carbon capture with sequestration technologies. Aside from further increasing evaporative losses in the mitigation scenarios, hydropower creates new opportunities as it is an enabling infrastructure for effective water resources management. The additional services (water storage, flood risk mitigation) may counterbalance the associated withdrawals. Moreover, to achieve deep decarbonisation targets, higher levels of green and blue WC are required if the share of fuelwood consumption in households remains at current levels.
The results highlight the important role of energy trade and show that cooperation between neighbouring countries would reduce overall costs and greenhouse gas emissions at the whole-Africa level. However, these results emphasize the key strategic role some countries play due to their access to energy and water resources. Specifically, the high renewable potential in EAPP makes the region the largest net exporter of electricity. Some net electricity importing countries (e.g. Congo) decrease their fossil-fuel dependency and reduce WC levels. Findings also reveal the future role of some countries as key net exporters and transit hubs. In any case, integrated and transboundary water resource management is a sine qua non of Africa's sustainable development and needs to be harmonised with energy investments.
The findings show that national strategies differ depending upon their indigenous energy resources while increasing electricity trade and substituting fossil-fuel-based power generation to reduce generation costs. The integrated model highlights the linkage between energy and water security. As nations invest in new power plants to increase electricity exports, this could come at the cost of their available water resources and increase geopolitical tensions. The increased ambition of African energy and climate targets would probably reduce energy exports to non-African countries, negatively affecting non-African countrie's energy security and limit potential trade options. This would, however, be outweighed by the significantly lower system costs of transforming Africa's energy sector in line with ambitious climate targets.
If countries were to continue energy exports at the current level, the effects upon WWs demonstrated in these results would be exacerbated. In the decarbonisation scenarios, exports of primary fossil fuel resources decrease at a level commensurate with global action on climate change. Large exporting countries, such as Algeria, Nigeria, South Africa, need to consider the trade-offs between the revenues of energy exports with other countries, the local consumption that will boost economic growth and increase water requirements and energy security.
Countries such as Egypt, Algeria, Morocco, South Africa and Angola, are expected to construct significant thermal generation capacity on the coast, using seawater for cooling as the water is freely available. Thus, the associated risks with climate change (e.g. sea-level rise) need to be considered.
The continental and national scale insights could inform the National Determined Contributions targets (to be reviewed in 2020) [58], by demonstrating the broader African context of national greenhouse gas emission targets and global-national policies [58] by addressing the challenges indicated in the United Nations Sustainable Development Goals (SDGs) in particular SDG6, SDG7, SDG13 [8]. National and governmental institutions and universities involved in capacity-building activities could benefit from this open-source study since the provided datasets could strengthen the capacity for developing others and extending existing energy systems models.
There is scope for further work based on the results of this study. Combining agricultural and municipal WWs [28] for each African nation with our results would show the impact of the scenarios upon levels of water-stress [27]. Linking a water-systems model to the energy-system model of this study would provide insights into the resilience of the African continent in terms of water and energy under climate change. Hydrological modelling of each of the planned dams would provide more accurate quantification of dam productivity and impacts. Broader social and environmental effects of hydropower and nuclear, which are outside the scope of this study, should be further examined at a power pool or regional scale along with mitigation strategies to understand the implications of those technologies better. Battery storage for solar PV and pumped hydropower storage are only implicitly modelled due to the macroscopic nature of the study that focuses on Africa's urgent need for access to energy and water and computational constraints (e.g. the computational time increases). Better data (e.g. country available information on future power plant investments, cooling types) and spatial techniques (e.g. soft-link with a geographic information system (GIS)) could help identify and allocate the different cooling technologies to future thermal power plants. Linking a spatial database of power plants with precipitation patterns and cooling technologies would improve the estimation of water factors. Also, incorporating country-specific reserve margins rather than using an average, the power sector projections would improve the representation of national energy systems. Lastly, the costs of energy efficiency measures and reduction in energy service provision are not endogenously accounted for in the model.
Acknowledgments
The Division of Energy Systems (Kungliga Tekniska Högskolan) is grateful to the Joint Research Centre of the European Commission for the financial support of the initial study (Contract Number C936531 -JRC/PTT/2018/C.7/0038/NC). Also, we would like to thank Ignacio Hidalgo González for his inputs in the development of the model. The computations were enabled by resources provided by the Swedish National Infrastructure for Computing (SNIC) at the PDC Center for High Performance Computing, KTH Royal Institute of Technology, partially funded by the Swedish Research Council through Grant Agreement No. 2018-05973. Furthermore, we would like to thank Andreas Sahlberg and Babak Khavari (Kungliga Tekniska Högskolan) for assisting in the identification of the cooling type of power plants. The views expressed are purely those of the authors and may not in any circumstances be regarded as stating an official position of the European Commission.
Data availability statement
The data that support the findings of this study are openly available. The dataset used to develop the model can be found in the Zenodo repository [59]. The detailed model results by country, power pool and continental level for the different scenarios can be found in the JRC Data Catalogue repository under the WEFE collection [60].
The data that support the findings of this study are openly available at the following URL/DOI: 10.5281/zenodo.4889373.
Contributions
I P developed the energy model used in this study, writing-review and editing of the paper and produce some of the figures. V S contributed to the methodology and involved in reviewing-editing of the paper and visualization of the results, M H provided inputs to develop the energy model and involved in the reviewing-editing of the paper, H M involved in the reviewing-editing of the paper, I K involved in the reviewing-editing of the paper, R G S contributed to the methodology and involved in the reviewing-editing of the paper, A S reviewing-editing of the paper and visualization of the results, W U supervised the development of the energy model and paper, provided inputs to develop the energy model, involved in reviewing-editing of the paper and produced some of the figures.
Conflict of interest
The authors declare no competing interests.
Code availability
The OSeMOSYS code used to develop the model for Africa can be found in a Github repository. The current version of the TEMBA model takes up to 16 h to solve using a commercial-grade solver (such as CPLEX or Gurobi) and requires up to 64 GB of memory.
: Appendix. Scenarios
The matrix of scenarios examined for each one of the main scenarios (Reference, 2.0 °C, 1.5 °C) as part of this study is presented below (appendix table 2).
Table 2. Scenario matrix input parameters.
| Climate impact on hydropower | Decreased water withdrawals for cooling purposes | |||||
|---|---|---|---|---|---|---|
| Original | Dry (suppl. table 46) | Wet (suppl. table 46) | 5% | 10% | 15% | |
| Reference | Current renewable policy targets | Lower CF factors for hydropower plants | Higher CF factors for hydropower plants | Decrease of annual water withdrawal levels by 5% on a power pool level from 2025 onwards than the Reference (Original) | Decrease of annual water withdrawal levels by 10% on a power pool level from 2025 onwards than the Reference (Original) | Decrease of annual water withdrawal levels by 15% on a power pool level from 2025 onwards than the Reference (Original) |
| 2.0 °C | Current renewable policy targets and annual emission limits aligned with the 2.0 °C scenario trajectories [51]. | Lower CF factors for hydropower plants | Higher CF factors for hydropower plants | Decrease of annual water withdrawal levels by 5% on a power pool level from 2025 onwards than the 2.0 °C (Original) | Decrease of annual water withdrawal levels by 10% on a power pool level from 2025 onwards than the 2.0 °C (Original) | Decrease of annual water withdrawal levels by 15% on a power pool level from 2025 onwards than the 2.0 °C (Original) |
| 1.5 °C | Current renewable policy targets and annual emission limits aligned with the 1.5 °C scenario trajectories [51]. | Lower CF factors for hydropower plants | Higher CF factors for hydropower plants | Decrease of annual water withdrawal levels by 5% on a power pool level from 2025 onwards than the 1.5 °C (Original) | Decrease of annual water withdrawal levels by 10% on a power pool level from 2025 onwards than the 1.5 °C (Original) | Decrease of annual water withdrawal levels by 15% on a power pool level from 2025 onwards than the 1.5 °C (Original) |