

Abstract
Research on plastic pollution has rapidly expanded in recent years and has led to the discovery of vast amounts of microplastics floating on the surface of subtropical oceanic gyres. However, the distribution of floating plastic in the ocean is still poorly constrained, and there is a lack of information from a few meters from the coastline where the largest plastic emissions take place. Here, we provide a comprehensive study on the loads of plastic debris in the coastal surface waters of the NW Mediterranean Sea using data from 124 manta trawl deployments collected along 7 months by citizen scientists. Our results reveal that pollution by microplastics in the nearshore is likely subject to seasonal variations associated to a combination of hydrodynamic and anthropogenic pressures. The high proportions of microplastics found indicate that potential breakdown of plastics in the nearshore may take place in line with previous works. We prove that citizen science is a powerful tool in plastic research to monitor microplastics in the nearshore as it provides scientifically meaningful results while stimulating citizen engagement. Future studies may benefit from targeting specific scientific open questions by using the citizen science methodological approach presented here.
Export citation and abstract BibTeX RIS

Original content from this work may be used under the terms of the Creative Commons Attribution 4.0 license. Any further distribution of this work must maintain attribution to the author(s) and the title of the work, journal citation and DOI.
1. Introduction
Investigations on plastic pollution began in the remote open ocean far away from the coastal zone. (Carpenter and Smith 1972) became the first to document what 30 years later would be known as 'microplastics'—plastic particles smaller than 5 mm (Thompson et al 2004)—in the Sargasso Sea. In the decade of the 90s, large accumulations of plastics were found floating in the North Pacific Subtropical Gyre (Moore et al 2001), and the North Atlantic Subtropical Gyre (Law et al 2010). Since then, extended research has focused on the role of ocean gyres and the open ocean on plastic accumulation (Law et al 2010, van Sebille et al 2012, 2015, Cózar et al 2014, Eriksen et al 2014, Lebreton et al 2018). However, there appears to be a major fraction of all plastic dumped into the ocean since 1950 that is missing as it has not been found in surveys tracking floating plastic debris in the open ocean by now. The current estimates ranging from 14.4 to 269 Mt of plastic accumulated at the open ocean surface layer (Cózar et al 2014, Eriksen et al 2014, van Sebille et al 2015) are significantly lower than the predicted tens of millions of metric tons that should be floating in the ocean based on accumulated global plastic emissions (Jambeck et al 2015), although Weiss et al (2021) recently demonstrated 2–3 orders of magnitude lower microplastic inputs by rivers relative to current estimates.
During the last decade, several studies have suggested that plastic entering the ocean likely sinks to the seafloor, either because of negatively buoyancy or because biofouling increases density of floating plastic (Woodall et al 2014, Kaiser et al 2017, Kane et al 2020). But there are recent evidences that a natural sorting for plastic debris is occurring in coastal environments, where a major part of entering plastics are stranded and captured, and only a small fraction eventually escapes and accumulates in the open ocean (Lebreton et al 2019, Onink et al 2021). Considering the predicted growth in plastic waste (Borrelle et al 2020), knowledge of the occurrence and fate of microplastics in the coastal zone and the mechanisms governing their temporal variability and capture and release is a key challenge that needs to be urgently addressed. This is also required to detect potential hot-spots, current trends in floating plastic budgets (Galgani et al 2021), constrain and calibrate numerical models (Kaandorp et al 2020) and eventually assess the implementation of regulatory and management frameworks, such as the Marine Strategy Framework Directive (Directive 2008/56/EC), or the Single-Use Plastics Directive (Directive (EU) 2019/904).
In 2020 we initiated the citizen science project 'Surfing for Science' based on floating microplastics collection by volunteers, so-called citizen scientists, with enhanced spatial and temporal coverage. During 7 months, starting from October 2020, 14 social, environmental and sports associations distributed along 330 km in the north-western Mediterranean coast organized citizen scientists to acquire scientific samples in the nearshore from paddle surf boards or other boats with a weekly/biweekly frequency (figure 1). This project represented a paradigm shift in microplastic research, allowing to fill the gap in knowledge of this transition coastal area, and actively involving citizens in the acquisition of scientific samples and the generation of new scientific data.

Figure 1. The study area, showing nearshore sampling locations conducted by citizen scientists over a 330 km stretch along north-western Mediterranean coast (A), a zoom-in on five beaches sampled in Barcelona city (B) and a volunteer conducting a survey with the paddle trawl and a stand-up paddle board (C). The associations that provided the structure for implementing the citizen science project where SK Kayak (Llançà), Ocean Cats (Palamós), Base Nàutica (Arenys de Mar), Escola del Mar (Montgat), Blue Salt School (Llevant—Barcelona), Anèl·lides, Oceanogami i Base Nàutica (Mar Bella—Barcelona), Ungravity Freestyle Company (Nova Icària—Barcelona), Manihi Surf School (Barceloneta—Barcelona), Anywhere Watersports (Sant Sebastià—Barcelona), Escola Garbí (Castelldefels), Club Nàutic (Comarruga), and Plàncton Diving (l'Ametlla de Mar).
Download figure:
Standard image High-resolution image2. Methods
2.1. Participatory process and sample acquisition
Camins et al (2020) provided the scientific community with the design of an affordable and easy to use manta trawl to be attached to a paddle surf board, a kayak, or any other paddling or rowing boat to acquire scientific samples to study microplastic pollution in the nearshore. The trawl comprised the net, with a mesh size of 0.33 mm and a collector bag (or cod end) at the end. The net dimensions used were 0.38 × 0.30 m in most locations. Exceptionally, a net of 0.34 × 0.26 m was used in one single location (i.e. Sant Sebastià beach; figure 1). The Wikiloc Outdoor, S.L. free App (Wikiloc 2019) installed in a smartphone was used for geolocation while trawling (including latitude, longitude, time, and distance trawled). Flowmeters could not be handed out to all participatory associations. Instead, previous work was conducted to determine the distance shift between the track distance measured by the GPS systems and flowmeter measurements (figure S1 available online at stacks.iop.org/ERL/17/045018/mmedia).
For every trawl, the citizen scientist entered the water with the trawl on the surf board or other boat, to which it was attached, and paddled/rowed to the beginning of the transect. Then the volunteer started paddling for about 1 h (between 1 and 2 km; figure 1(C)) following a consistent parallel transect to the coast when possible. Alternatively, concentric transects were performed in locations with beaches bounded by breakwaters or harbors to ensure representativeness of the area (e.g. Barcelona; figure 1(B)). After each trawl, the net was carried onboard before reaching back to shore and GPS recordings were interrupted. Once back to the beach, the paddle trawl was rinsed thoroughly with freshwater to ensure that all the plastic debris ended up into a replaceable collector bag, which was then sent directly back to the laboratory at the University of Barcelona.
2.2. Sample processing
Once in the laboratory the collector bag was inverted, and all debris were washed out in a 0.33 mm sieve. Plastics were carefully extracted using standard stainless-steel tweezers under a stereo-microscope (10× to 50×) in a clean laboratory. For all collected samples, microplastics between 0.33 and 5.00 mm and mesoplastics (i.e. 5.00–25.00 mm) were captured with multi-staged 0.33 and 5.00 mm sieves, respectively. Macroplastics (i.e. >25.00 mm) were manually extracted with forceps and carefully washed to assure that no smaller plastics remained attached to its surface. Plastics were then dried at room temperature and placed separately on a 90 mm glass Petri dish to obtain plastic count, measurements and properties. Each Petri dish containing plastic particles was scanned twice with a modified and color-calibrated HP G4050 flatbed scanner with a charge-coupled device sensor at high resolution (1200 dpi; 47.2 pixels mm−1). To enhance the background contrast with plastics, a dark background was used in the first scan, whereas a diffused and illuminated background was used in the second scan. Both scans were precisely aligned with custom scan software and processed with ImageJ v1.53 software (Schneider et al 2012). Images were uploaded to the Instagram social network (Surfing For Science Lab 2019) accompanied by the code of the sample and the map of the transect performed, and the associations involved were tagged.
Plastics were counted and the maximum length and surface area of each particle was recorded. Plastic items were also manually classified according to their nature and shape in rigid fragments, flexible/rigid films or sheets, filaments, foam, pellets and spheruloid or granular microbeads. Synthetic or cellulose fibers were not considered in this study, as fibers could pass through the net and external fiber contamination was not prevented. The mean color of each plastic was measured and automatically assigned to the colors in the reference color palette employed by Martí et al (2020), which recently provided a systematic method for color measurements of plastics. The color palette categorizes 120 colors into 13 main colors and 9 hues, besides transparent and translucent, and is based on standard Pantone© RGB scores. The Euclidean Distance between the mean color values of each plastic and the reference color palette was used to assign the color codes to each plastic.
After image processing, each sieved size fraction was weighted to the nearest 0.1 mg. Consistency between digital measurements and sieving of plastics was assured by manually transferring and reweighing all macroplastics and mesoplastics present in the sieved microplastics fraction, thus preventing overestimation of microplastics due to sieve fractionation (Michida et al 2019).
Finally, a subset of 285 random-selected microplastics (∼1.1% of the total) from two samples of each location were chemically identified using a Perkin Elmer Frontier FT-IR Spectrometer with a diamond crystal ATR accessory at the Scientific and Technological Centres of the University of Barcelona (CCiTUB). Microplastics were selected introducing an observer bias following the calculated proportions of colors and nature of microplastics found (i.e. the most common colors and shapes found were more often selected and analyzed). FT-IR spectroscopy allowed the identification of the polymer composition of each item based on IR absorption bands that represent the presence or absence of specific functional groups in the material. The spectral range analysed was between 4000 and 220 cm−1 with a 4 cm−1 resolution and 16 accumulations. The spectra collected were analysed with Open Specy v0.9.3 software (Cowger et al 2021) and OMNICTM PictaTM (Thermo Fisher 2021) to identify the compounds by comparing them to spectra references in library databases.
2.3. Quality control and quality assurance
Efforts were made to assure quality and consistency of the data during sampling acquisition and treatment. The project enrolled volunteers with and without scientific background, including college and graduate students, and devoted volunteers selected by the participating associations. Either way, project coordinators were reachable by volunteers in case of any eventualities in the sampling process. A sampling protocol was handed-out to participating associations with instructions for app usage and GPS recordings, approximate tow lengths and duration, sample storage and net washing after each use. After sample collection the collector bag was sent to the laboratory within zip-lock bags for scientifically reliable sorting. This is very important, as a sample contamination during the collected debris from the collector bag to a bottle, or volunteer bias if plastic debris are sorted in-situ would result in a bias in plastic abundances or characteristics. For instance, in this study >2000 plastic items were found in a single trawl, with an average size of 2.37 mm (range 0.39–49), so stringent and controlled sample processing in the laboratory by professionals is needed (Bonney et al 2014).
Back in the laboratory, selection of plastics and microplastics was carried out by a small group of observers associated to the University of Barcelona and the Surfing for Science project, including students, researchers and laboratory technicians. However, samples and selected particles were routinely verified by a single trained observer so that observer bias was reduced. Samples, sieves, and petri dishes were covered wherever possible to minimize periods of exposure, and a clean workspace was maintained by keeping all surfaces and equipment clean using ethanol wipes.
2.4. Data analysis
All data management and analyses were carried out using R v4.0.5 software (R Core Team 2021) using packages dplyr, ggplot2, stats, agricolae, car and rstatix and mapped and spatially analyzed using Quantum GIS v3.20 software (QGIS Development Team 2021). Tracks recorded by the volunteers using a smart-phone built-in GPS were manually corrected by removing inaccurate data points falling onshore or far from the expected trawl path. Unrealistic features, such as small deviations in the track were corrected by smoothing the tracks with the QGIS built-in algorithms.
The numerical and mass (dry weight) concentrations of plastic debris (items m−2, mg m−2) were calculated by multiplying the manta trawl mouth length by the tow length (determined by the flowmeter and the Wikiloc App). Plastic abundance and mass concentrations were log-transformed and compared among locations using one-way ANOVA's followed by Tukey's HSD post-hoc pairwise comparisons test on the means for significant responses. Any temporal trends were formally tested using a non-parametric Mann-Kendall's trend test. Wind and current speed and direction data for each sampling location was sampled from daily gridded data available from the Copernicus Marine Environment Monitoring Service (Clementi et al 2021) and the Environmental Research Division's Data Access Program data-sets (Remote Sensing Systems 2021), respectively. Further, population density (hab. km−2) around a 10 km circular buffer at each location was calculated using data from the Statistical Institute of Catalonia (IDESCAT 2016). The fractal dimension as a measure of rugosity of the coastline (i.e. Compa et al (2020)) was also calculated within this buffer area. Physical and anthropogenic forcing data was compared with plastic concentrations using Pearson correlations. A rolling average was calculated to test the influence of wind and current data on the previous 14 d of sampling. The normality of the residuals of the fitted values was checked using Shapiro–Wilk's test for the fixed factors and the homogeneity of variance using Levene's test where applicable. The data is presented as the mean ± standard deviation (SD) and the level of statistical significance level was set at 5%. 95% BCa bootstrapped confidence intervals (CI) of the mean concentrations are reported.
3. Results and discussion
3.1. Floating plastic debris in the nearshore
Early acknowledgment of the problem posed by plastic debris to ocean health involved observations by citizen scientists, such as local fishermen or beach users (Cundell 1973, Holmström 1975, Gregory 1991). Since then, our common understanding of the sources, pathways and sinks of plastics has been mainly attributed to growing research on beaches and in coastal and offshore areas (Cózar et al 2014, Suaria et al 2016, van Sebille et al 2020, Simon-Sánchez et al 2022). Unfortunately, far less is known about the concentrations, properties and composition of plastics in the nearshore, which seems to play an important role in beaching and trapping processes globally (Morales-Caselles et al 2021, Onink et al 2021, Sanchez-Vidal et al 2021). Over the past years, only some studies have shared insights on how plastics behave in the nearshore by means of numerical, laboratory and field studies under controlled or isolated boundary conditions (Hinata et al 2017, Ho and Not 2019, Forsberg et al 2020, Kerpen et al 2020, Alsina and van Sebille 2021). Furthermore, only few studies have successfully monitored floating microplastics in the nearshore at constant shallow depths and close distances from shore. For instance, van der Hal et al (2017), Vianello et al (2018) and Compa et al (2020), have sampled microplastics at distances as close as 5–10 m from shore and up to ∼5 m depths, Pedrotti et al (2016) and Ruiz-Orejón et al (2018) have sampled microplastics beyond ∼100 m from shore, whereas Zeri et al (2018) and Baini et al (2018) targeted areas beyond ∼500 m. In this study, a top-down citizen science approach was used to engage volunteers to collect scientific samples. The enrollment of volunteers and nature of sampling equipment allowed the collection of a total 129 samples of floating plastics at previously overlooked distances from shore and shallow depths (table 1). Five samples (∼4%) were discarded due to inaccurate or absent GPS tracks and excluded from the study. The total recorded area and filtered volume of the survey was approximately 65 264 m2 and 19 469 m3, respectively. Previous work showed that flowmeter measurements significantly decreased the average trawl distance by 23.1% (range 10.4–31.9), which likely had an impact on subsequent measurements of plastic mass and abundances (figure S1). Hereby, we discuss our results considering them only a minimum estimate of plastic loads in the nearshore of the investigated locations.
Table 1. Overview of the sampling conditions of each location and average total plastic concentrations with 95% BCa bootstrapped confidence intervals of the mean abundances and mass. Plastic concentrations expressed in items m−3 and mg m−3 are reported in table S2.
| Location | Tows | Date (start–end) | Distance from shore (m) | Tow depth (m) | Tow length (km) | Total plastic concentrations | |||
|---|---|---|---|---|---|---|---|---|---|
| Abundance (items m−2) | Mass (mg m−2) | ||||||||
| Mean (±SD) | 95% CI | Mean (±SD) | 95% CI | ||||||
| Llançà | 12 | 2020-12-04–2021-05-17 | 99.3 ± 9.4 | 4.5 ± 0.8 | 1.7 ± 0.1 | 0.07 ± 0.08 | 0.03–0.13 | 0.13 ± 0.30 | 0.01–0.40 |
| Palamós | 7 | 2020-11-29–2021-05-02 | 320.9 ± 114.6 | 18.9 ± 7.6 | 2.0 ± 0.0 | 0.16 ± 0.15 | 0.09–0.32 | 0.91 ± 1.93 | 0.14–4.55 |
| Arenys de Mar | 9 | 2020-12-19–2021-05-09 | 264 ± 106.9 | 4.7 ± 0.6 | 1.3 ± 0.5 | 0.15 ± 0.13 | 0.08–0.25 | 0.02 ± 0.01 | 0.01–0.03 |
| Montgat | 5 | 2021-02-25–2021-05-22 | 76.1 ± 60.7 | 2.5 ± 1.6 | 0.8 ± 0.3 | 0.32 ± 0.19 | 0.15–0.45 | 0.14 ± 0.14 | 0.04–0.27 |
| Llevant a | 12 | 2020-10-31–2021-05-23 | 126.8 ± 32.5 | 2.9 ± 0.7 | 0.9 ± 0.2 | 0.60 ± 0.64 | 0.34–1.03 | 0.15 ± 0.27 | 0.06–0.44 |
| Mar Bella a | 26 | 2020-10-09–2021-05-22 | 178.2 ± 80.3 | 2.9 ± 2.4 | 1.0 ± 0.3 | 0.35 ± 0.33 | 0.26–0.51 | 0.24 ± 0.63 | 0.06–0.60 |
| Nova Icària a | 5 | 2021-01-02–2021-04-03 | 157.9 ± 27 | 2.4 ± 0.7 | 1.2 ± 0.3 | 1.08 ± 1.79 | 0.20–3.44 | 0.37 ± 0.42 | 0.06–0.71 |
| Barceloneta a | 11 | 2020-12-19–2021-04-09 | 114.7 ± 28.3 | 0.4 ± 0.2 | 1.9 ± 0.3 | 0.32 ± 0.34 | 0.19–0.68 | 0.14 ± 0.13 | 0.08–0.23 |
| Sant Sebastià a | 12 | 2020-10-17–2021-04-01 | 122.3 ± 83.2 | 1.6 ± 1.2 | 1.2 ± 0.4 | 1.40 ± 2.01 | 0.57–3.01 | 0.54 ± 1.10 | 0.08–1.55 |
| Castelldefels | 10 | 2020-12-15–2021-05-23 | 127.8 ± 44.0 | 2.4 ± 0.7 | 1.8 ± 0.3 | 0.31 ± 0.46 | 0.12–0.81 | 0.17 ± 0.25 | 0.05–0.35 |
| Comarruga | 6 | 2020-12-16–2021-04-18 | 153.5 ± 77.3 | 2.3 ± 1.6 | 1.7 ± 0.1 | 0.16 ± 0.26 | 0.05–0.48 | 0.07 ± 0.10 | 0.01–0.17 |
| l'Ametlla de Mar | 9 | 2020-12-14–2021-04-29 | 60.4 ± 22.6 | 2.3 ± 0.6 | 1.9 ± 0.1 | 0.42 ± 0.92 | 0.08–1.40 | 0.18 ± 0.33 | 0.04–0.53 |
| Overall | 124 | 2020-10-09–2021-05-23 | 150.1 ± 90.4 | 3.6 ± 4.4 | 1.4 ± 0.5 | 0.44 ± 0.87 | 0.33–0.65 | 0.25 ± 0.67 | 0.16–0.41 |
| Min.-Max. | 5–26 | — | 10.0–860.0 | 0.2–34.0 | 0.31–2.36 | <0.01–6.18 | — | <0.01–5.25 | — |
3.1.1. Plastic loads and variability in the nearshore
We found a total 24 970 plastics in all samples collected across locations. Among all plastics found, 93.9% were microplastics, 5.7% mesoplastics and 0.4% macroplastics (table S1). This resulted in an overall average microplastic abundance of 0.41 ± 0.81 items m−2 (CI: 0.31–0.61), which was close to the total overall abundance (table 1). Average microplastic mass was 0.07 ± 0.19 mg m−2 (CI: 0.05–0.12) and was closely related to microplastic abundances (r = 0.76, p < 0.001). Coastal population has been among the main factors explaining (>60%) plastic loads in coastal waters of the Mediterranean Sea, followed by rivers (32%) and fisheries (6%) (Kaandorp et al 2020). Accordingly, we found rather bell-curved trend from north to south of the study area, and closely followed the year-round coastal population density profile (r = 0.45, p < 0.001 for abundance and r = 0.30, p < 0.001 for mass; figure 2). Despite statistical differences were found across locations regarding abundances (ANOVA, F11 = 3.47, p < 0.01) and mass (ANOVA, F11 = 2.46, p < 0.01), significant differences were only constrained to the low microplastic concentrations found in nearshore waters of Llançà—i.e. hosting >4.7 thousand inhabitants and a density of >170 hab km−2 (IDESCAT 2016)—compared to highly loaded samples collected in nearshore waters of Barcelona city—i.e. hosting >1.6 million inhabitants and a density of >16.4 thousand hab km−2 (IDESCAT 2016)—(figure 2). Overall, the estimated plastic loads were around the same levels found offshore in the central gyres of the world's oceans (e.g. Lebreton et al 2019, Wilcox et al 2020), and higher than most studies conducted within the Mediterranean Sea (Simon-Sánchez et al 2022), including samples taken at only ∼4 km from shore in the study area (de Haan et al 2019). Our results depict generally higher microplastic mass loads nearshore (r = 0.18, p = 0.04), as found by Pedrotti et al (2016) and Compa et al (2019), and suggests that it may harbor part of the missing floating plastic stocks globally (Thompson et al 2004, Onink et al 2021), together with the deep-sea floor, water column, beaches or animal lattices—i.e. see review by van Sebille et al (2020). However, we found lower average loads compared to previous work conducted nearshore around the Balearic Islands (Ruiz-Orejón et al 2018, Compa et al 2020), which seems to fit with both influence of seasonal population increase in summer leading to higher amounts of mesoplastics and macroplastics found there, and the seasonal variations of hydrodynamic structures occurring in summer that may potentially retain plastics nearshore (Macias et al 2019, Mansui 2020). Indeed, between October 2020 and June 2021, a trend towards lower microplastic loads was generally found towards February and March—e.g. see clear trends at Llançà and Castelldefels—, especially observed north and south of the study area, whereas higher concentrations were found before and after the summer months (figures 3 and S2). A decrease in microplastic loads nearshore was associated to higher nearshore wind and current speeds in February and March, suggesting that dilution by beaching, mixing in the water column of horizontal spreading of plastics may play an important role (figure S3). Furthermore, an increasing monotonic trend in abundance was only observed for Mar Bella (figure 3; Kendall's tau = 0.51, p < 0.001), where most of the sampling effort was concentrated (table 1 and figure 2). Meanwhile, plastic size also decreased over time (Kendall's tau = −0.44, p < 0.001), suggesting effective plastic breakdown in a period of only weeks to months and little alongshore and cross-shore transport during the survey. We suggest that artificial or naturally semi-enclosed beaches in the nearshore—e.g. limited by breakwaters or harbors, such as Mar Bella—may trap plastics more effectively leading to the formation of local temporary hot-spots. We further support these findings as higher microplastic loads positively associated to the coastal rugosity (r = 0.21, p = 0.01), as also previously found by Compa et al (2020) in the nearshore of the Balearic Islands. Furthermore, the high loadings of microplastics commonly found in some locations, for instance up to 5.62, 4.07 and 2.74 items m−2 in Sant Sebastià, Nova Icària and l'Ametlla de Mar, suggest that litter windrows (i.e. aggregation of floating litter at the submesoscale domain) may also play a role in nearshore waters by concentrating plastics on the order of ⩾10 relative to the background concentrations (Cózar et al 2021). For instance, this may be particularly important during moderate and steady winds or near river plume fronts (Cózar et al 2021).
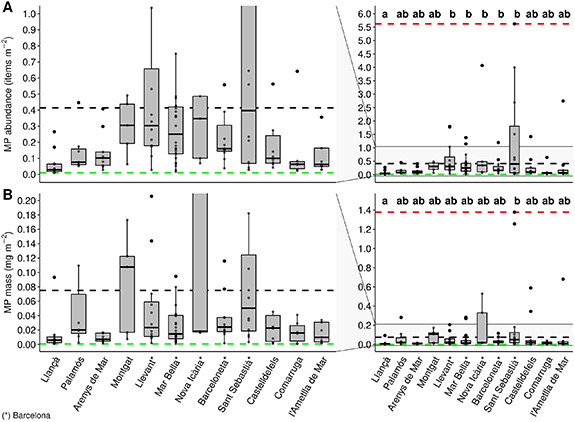
Figure 2. Abundance and mass concentrations of microplastics across locations in the north-western Mediterranean Sea (A) and (B). Dashed lines indicate survey averages (in black), minimum (in green) and maximum (in red) microplastic concentrations. Shared letters above each bar in (A) and (B) mean no significant difference according to Tukey's HSD pairwise comparison test with a 95% confidence interval.
Download figure:
Standard image High-resolution image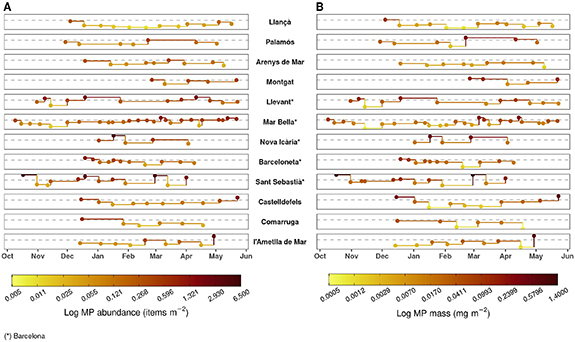
Figure 3. Summary of microplastic abundance (A) and mass (B) concentrations of the investigated locations over the sampled period. Note that all y-axes are log10 transformed.
Download figure:
Standard image High-resolution image3.1.2. Size distributions and plastic properties in the nearshore
Microplastics were almost exclusively found within nearshore waters (93.9%; see above and table S1). Plastics <1 mm represented 29.5% whereas most plastics were within the 1–5 mm size range (table S1). In figure 4(A) we show the particle size distributions (PSDs) of plastics compared to other studies conducted in the Mediterranean sea nearshore and offshore, and global ocean, which displays a power law regime up to 1 to 0.5 mm in length before decreasing towards smaller sizes. Our findings show that the nearshore may highly contribute to the floating microplastic oceanic stocks, as anticipated by (Onink et al 2021). The apparent higher relative amounts of microplastics found compared to other studies offshore (Cózar et al 2014, 2015) may result from the combination of effective fragmentation nearshore (Pedrotti et al 2016) and long residence times due to slow degradation of floating plastics in the coastal zone, which has been suggested to drive the current floating stocks of plastics, and likely respond to plastic inputs from years to decades back from now (Lebreton et al 2019, Weiss et al 2021). In any case, comparison of PSDs shows that our results are fairly comparable to those found by Pedrotti et al (2016) and Ruiz-Orejón et al (2018) in nearshore waters (<1 km), but progressively differ with offshore waters as plastic size becomes larger. This agrees with findings from Ryan (2015), suggesting that higher relative surface area to volume ratios of smaller plastics may lead to increased epiphytic growth and ballasting in coastal areas. We find little evidence for expected coastal trapping of larger plastics due to onshore Stokes drift (Isobe et al 2014). As pointed out above, seasonality in physical conditions during sampling may be responsible, for instance seasonal differences in onshore Stokes drift transport leading to increased beaching (Olivelli et al 2020), or windage (Ryan 2015), potentially reducing larger floating plastics in the nearshore.

Figure 4. Normalized plastic size distributions across studies (A) and plastic size moving averages of 200 plastics for each plastic shape found (B). In figure (A), data from the global ocean (red line; n = 7359) and the Mediterranean Sea (green line; n = 3901) is obtained with a 0.2 mm-mesh Manta Trawl. Blue lines include data from the Mediterranean Sea offshore at >10 km (light blue; n = 4469) and 1–10 km (medium blue; n = 1830) and nearshore at <1 km (dark blue; n = 8053) sampled with a 0.3 mm-mesh Manta Trawl. Purple line includes data from nearshore waters at <1 km (n = 3145) obtained with a 0.3 mm-mesh Manta Trawl around the Balearic Islands (Mediterranean Sea). In this study we counted a total 24 970 plastics within nearshore waters between 0.01 and 1 km (average 0.15 ± 0.12) from shore. Data from Pedrotti et al (2016) includes measurements from Cózar et al (2015). Size classes in the x-axis follow a 0.1-log series of 28 size classes starting from 0.2 mm. Note that the y-axis is log10 transformed.
Download figure:
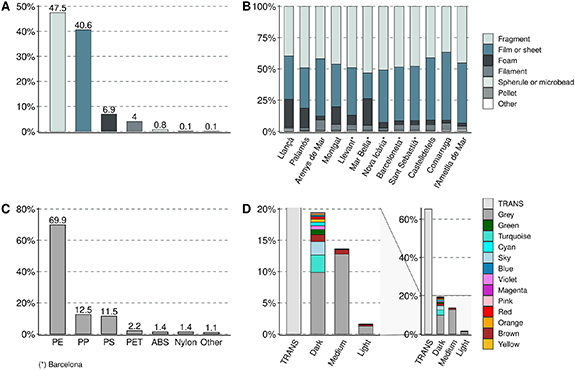
Standard image High-resolution imageInformation about the sources can be inferred from the types of plastics found and chemical analysis. We only found a few pellets and spherules and microbeads (<1%), although the latter may have not been effectively captured by the 0.33 mm-mesh net due to their small size (figures 4 and 5). Foams—e.g. sourced from food containers and fishing activity—and filaments—e.g. sourced from the fishing activity—constituted almost 11% of the plastics found (figure 5). However, the vast majority of plastics found were composed of fragments and films and sheets (>80%), which potentially originated from the breakdown of larger plastic pieces. We find a strong predominance of thin films and sheets compared to offshore areas, where fragments are usually found in much higher proportions (e.g. Suaria et al 2016). This observation fits with the higher amounts of wrappers (39%), bags (22%) and beverage containers (11%) selectively occurring in nearshore waters (Morales-Caselles et al 2021). Furthermore, rigid sheets may ultimately resemble fragments as their area-to-thickness ratios become more equal over time due to fragmentation. Small-sized plastics following breakdown can more easily escape nearshore dynamics (e.g. Isobe et al 2014), which may partly explain why more fragment-like plastics are identified in offshore waters. This can be observed in figure 5(B), where films and sheets loose predominance towards smaller sizes, as opposed to fragments. Differences in local sources may also potentially explain the differences of types of plastics found across locations—e.g. foams predominated towards the north, where also more fishing activity takes place—(Chi squared test, p < 0.001; figure 5(B) and table S1).
Figure 5. Percentages of different properties of floating plastics (n = 24 970) sampled by volunteers in the northwestern Mediterranean Sea. Plastics categorized by shape or category of all locations together (A) and across locations (B). A random subset (n = 285) of microplastics chemically identified with ATR-FTIR spectroscopy (C). Finally, all colors and color hues found associated to floating plastics including TRANS or transparent and translucent plastics without any associated color (D).
Download figure:
Standard image High-resolution image
Figure 5(C) shows that almost 70% of microplastics were identified as low and high density polyethylene (PE), followed by polypropylene (PP) and polystyrene (PS). Polyolefins (PE and PP) are the most produced polymers in Europe with over 49% demand, and used mainly in single-use food packaging and automotive parts (Plastics Europe 2020), which reasonably fits with our findings. Together with PS (in expanded form), which is mainly used in food packaging, fishing or insulation, these polymers are positively buoyant in seawater (ρ < 1.02 g cm−3) and consistently represent a great fraction of the microplastics found floating in nearshore waters in the Mediterranean Sea (Zeri et al 2018, Compa et al 2020), and elsewhere globally (Suaria et al 2016). Interestingly, a few polymers were found with higher density than seawater (ρ > 1.02 g cm−3), which may be explained by a combination of intensive mixing by waves and wind causing them to surge to the surface, and closeness to coastal sources. These added to 6.1% of the total, including polyethylene terephthalate—e.g. mainly used in plastic bottles and cosmetic packaging—, acronitrile butadiene styrene—e.g. required in multiple shock-absorbing or heat-resistant applications—, nylon—e.g. used in fishing gear—and others (<1%), including ethylene-vinyl acetate and PE/PP co-polymers.
Finally, over half out of the 120 colors of the reference palette were used for classification. Transparent and translucent plastics were most frequently found (65.3%), as they were associated to films and sheets, spherules or microbeads and pellets (see above). Plastics of different tones of gray, including black and white followed (23.9%). Other colors, grouped into bluish-green (i.e. sky, blue, cyan, turquoise and green), amber (i.e. yellow, brown and orange) and reddish (i.e. red, pink, violet and magenta) were less frequent, accounting only 6.8%, 2.8% and 1.2% of colors, respectively (table S1). Overall, the prevalence of transparent and translucent plastics is similar to findings of Martí et al (2020) globally (i.e. 47%). Conversely, we found less variety of colors in the nearshore than they found floating in enclosed seas at ∼5 km from shore. However, the low prevalence of amber-like plastics associated to yellowing or oxidative stress aligns with views that plastics in the nearshore may be relatively short-lived before reaching remote areas (Andrady 2011, Martí et al 2020). In any case, it is unclear how different colors can impact the ingestion rates of plastics by marine organisms, especially in coastal areas where marine biodiversity peaks. Recent findings show transparent and translucent and black plastics prevail in fish (∼40% and 30%), whereas white and blue plastics prevail in turtles (∼67% and 40%) and cetaceans (∼38% and 30%), which may respond to different feeding strategies or environmental exposure of organisms (see review by López-Martínez et al 2021).
3.2. The success of citizen science in plastic pollution studies
Citizen science in plastic pollution studies is not new, successful programs have incorporated volunteers to provide repeated sampling for time series as well as synoptic collections over wide geographic regions, and providing access to unexplored sites (van der Velde et al 2017, Zettler et al 2017). These programs have provided key contributions to the understanding of the impact of plastic pollution on the marine environment, and even though most projects have focused on macroplastics—as they are more easily sampled—microplastics have been recently in the spotlight.
Beach surveys and clean-up initiatives such as 'International Coastal Cleanup', 'World Cleanup Day', 'Marine Litter Watch', or 'International Pellet Watch', have increased our understanding on the nature and extent of plastic pollution in beaches at regional and global scales (Takada 2006, Storrier et al 2007, Hidalgo-Ruz and Thiel 2015, Bergmann et al 2017, Bosker et al 2017, 2017, Lots et al 2017, Nelms et al 2017, Haarr et al 2020, Roman et al 2020). The shallow seafloor has been investigated by volunteer divers of the 'Dive Against Debris' initiative that have provided scientific information on the abundances and characteristics of underwater litter (Consoli et al 2020). Furthermore, integrated large data-sets of marine litter collected by citizen science programs in rivers, beaches and shallow seafloors have provided a first overview of the origin, transport and ultimate fate of litter items as small as 0.5 mm up to 1 m in the global ocean (Hidalgo-Ruz and Thiel 2013, Rech et al 2015, Morales-Caselles et al 2021), and entanglement and ingestion of plastic debris by wildlife (Wilcox et al 2016) including fish destined for human consumption (Liboiron et al 2016) has also been documented through citizen science initiatives.
In contrast, there are less citizen science contributions to monitor plastic floating in the sea surface. The Trawlshare program developed by the 5-Gyres Institute engages sailors to collect scientific samples across the five subtropical gyres. Samples are sorted onboard using simplified protocols (Trawl For Plastic 2021). The same team of researchers went on several expeditions through all 5 subtropical gyres and published the first global estimate of all plastic of all sizes floating in the world's oceans, totaling 270 000 metric tons from 5.25 trillion particles (Eriksen et al 2014).
There is an ongoing need to provide scientifically robust data sets on floating plastic abundances and characteristics making use of the citizen science, as it provides clear advantages over conventional science by operating at greater geographical and temporal scales, reducing project costs and raising awareness (Paradinas et al 2021). Citizen science not only empowers volunteers as they participate in the collection of valuable scientific data, but it also provides health benefits and well-being by spending time and interacting with marine and coastal ecosystems (Borja et al 2020, Britton et al 2020).
4. Conclusions and final remarks
In the present work, a top-down citizen science approach was used to determine microplastic loads in the nearshore, an area previously undersampled by the scientific community. We demonstrate along with previous works around the globe that citizen science is a reliable and powerful tool that can provide invaluable scientific data at long and wide spatiotemporal scales. Accordingly, our findings show considerable microplastic pollution in nearshore waters, and a high spatial and temporal variability. A trend with decreasing loads towards February and March could be observed and was likely conditioned by local hydrodynamic conditions, such as surface currents and winds lowering floating microplastic loads. Furthermore, microplastic concentrates in the nearshore, either because of effective breakdown, coastal rugosity or seasonal changes in hydrodynamic conditions. The variety and closeness of sources in the nearshore and population density further contributed to the high variability of concentrations found. Our data, together with data on estimated plastic inputs from land and rivers, and from beach and offshore surveys can been used to constrain numerical models, which ultimately contribute to develop comprehensive risk assessments and our understanding of the cross-shore and vertical transport pathways, sinks, beaching and fragmentation processes of plastics and microplastics in the marine environment (van Sebille et al 2020). Samplings did not target specific sub-domains within the nearshore, such as the outer or inner nearshore (i.e. swash and surf zone), which is often affected by different turbulent motions affecting plastic abundance and mass (Ho and Not 2019). However, in the future, more targeted surveys demanding particular needs to answer specific scientific questions around plastic occurrences, distribution and dynamics in the nearshore may also benefit from the citizen science approach presented here.
Acknowledgments
We sincerely thank all volunteers involved in sample collection. The success of the Surfing for Science project is driven by their efforts and motivation to paddle for about 1 h even in winter conditions. We thank the Oceans and Human Health Chair and Rycsa.cat for their support with the trawls. We would also like to extend our gratitude to Guillermo Asensio and Vidal Martínez from Asensio Comunicació Visual for their amazing creative support, and Núria Ferrer and Pilar Hermo from the Scientific and Technical Centres of the University of Barcelona for technical assistance with the FT-IR spectrometer. This research has been supported by the Fundación Española para la Ciencia y la Tecnología (FECYT) Project FCT-19-14747, the Ajuntament de Barcelona Grant 20S02426-00, the Facultat de Ciències de la Terra, and a Catalan Government Grups de Recerca Consolidats grant to GRC Geociències Marines (ref. 2017 SGR 315). The authors declare nofinancial and non-financial competing interests.
Data availability statement
The data that support the findings of this study are openly available at the following URL/DOI: 10.34810/data149.