

Abstract
The spatial mapping of social-ecological system (SES) archetypes constitutes a fundamental tool to operationalize the SES concept in empirical research. Approaches to detect, map, and characterize SES archetypes have evolved over the last decade towards more integrative and comparable perspectives guided by SES conceptual frameworks and reference lists of variables. However, hardly any studies have investigated how to empirically identify the most relevant set of indicators to map the diversity of SESs. In this study, we propose a data-driven methodological routine based on multivariate statistical analysis to identify the most relevant indicators for mapping and characterizing SES archetypes in a particular region. Taking Andalusia (Spain) as a case study, we applied this methodological routine to 86 indicators representing multiple variables and dimensions of the SES. Additionally, we assessed how the empirical relevance of these indicators contributes to previous expert and empirical knowledge on key variables for characterizing SESs. We identified 29 key indicators that allowed us to map 15 SES archetypes encompassing natural, mosaic, agricultural, and urban systems, which uncovered contrasting land sharing and land sparing patterns throughout the territory. We found synergies but also disagreements between empirical and expert knowledge on the relevance of variables: agreement on their widespread relevance (32.7% of the variables, e.g. crop and livestock production, net primary productivity, population density); relevance conditioned by the context or the scale (16.3%, e.g. land protection, educational level); lack of agreement (20.4%, e.g. economic level, land tenure); need of further assessments due to the lack of expert or empirical knowledge (30.6%). Overall, our data-driven approach can contribute to more objective selection of relevant indicators for SES mapping, which may help to produce comparable and generalizable empirical knowledge on key variables for characterizing SESs, as well as to derive more representative descriptions and causal factor configurations in SES archetype analysis.
Export citation and abstract BibTeX RIS

Original content from this work may be used under the terms of the Creative Commons Attribution 4.0 license. Any further distribution of this work must maintain attribution to the author(s) and the title of the work, journal citation and DOI.
1. Introduction
Archetype analysis has become a fundamental tool in sustainability science to identify typologies of human-nature interaction (e.g. social-ecological systems). Characterizing archetypes of social-ecological systems (SESs) is useful to work with their complexity at an intermediate level of abstraction between specific case studies and general theories, facilitating knowledge comparison and generalization (Oberlack et al 2019). Specifically, the identification and mapping of SES archetypes as typologies of cases (sensu Oberlack et al 2019) allows to translate the SES concept into the territory and make it spatially explicit, by delineating territorial units that share similar social, ecological, and human-nature interaction patterns (e.g. SES archetypes by Rocha et al 2020, socio-ecological functional types by Vallejos et al 2020). SES maps can work as templates for decision-makers to develop more integrative and sustainable models of territorial management that consider the coupling between human and natural systems (Oberlack et al 2019, Sietz et al 2019). The diversity of approaches developed in the last years to map SESs has enriched our knowledge on their characteristics and dynamics worldwide (e.g. Alessa et al 2008, Ellis and Ramankutty 2008, Václavík et al 2013, Hamann et al 2015, Martín-López et al 2017, Dressel et al 2018, Levers et al 2018, Quintas-Soriano et al 2019, Rocha et al 2020, Vallejos et al 2020), although the conceptual and methodological pluralism could hinder cross-context and cross-scale comparisons (Balvanera et al 2017, de Vos et al 2019).
Recently, the identification of SES archetypes as typologies of cases has moved towards more integrative perspectives that consider the multidimensional aspects of human-nature interactions. Thus, there is a growing number of studies that use a broader range of social-ecological indicators (e.g. Václavík et al 2013, Dittrich et al 2017, Martín-López et al 2017, Lazzari et al 2019) and that cross-reference them with SES conceptual frameworks and model lists of variables (e.g. Dressel et al 2018, Rocha et al 2020, Vallejos et al 2020, Pacheco-Romero et al 2021), which can contribute to develop more comparable research (Cox et al 2020). However, in most of them, indicators are selected ad hoc by the researcher based on literature reviews, the research question, or practical reasons (e.g. data availability), but not from the statistical performance of the data itself. To our knowledge, hardly any studies have investigated how to empirically identify the most relevant set of indicators to map and characterize the diversity of SESs in a given region, which still represents a major challenge for archetype analysis (Eisenack et al 2019). Such studies would allow to produce more objective and generalizable knowledge on the causal factors that determine the distribution and dynamics of SESs across contexts and scales, enhancing the interconnectedness of place-based social-ecological research (Václavík et al 2016).
Knowing which are the most relevant general variables for the study of SESs is a current scientific endeavor to foster the development of more harmonized social-ecological research and monitoring protocols through a shared language (Balvanera et al 2017, Holzer et al 2018, Mirtl et al 2018, Cox et al 2020, Pacheco-Romero et al 2020). However, to date, only first steps have been taken to identify such variables, and the generated knowledge is still sparse. For instance, some studies have built reference lists of variables for characterizing and monitoring SESs (Ostrom 2009, McGinnis and Ostrom 2014, Frey 2017, Cox et al 2020, Pacheco-Romero et al 2020). Other initiatives are developing frameworks to identify essential variables for sustainable development goals (Reyers et al 2017, Lehmann et al 2020), for conservation management in natural protected areas (Guerra et al 2019), or for measuring and monitoring ecosystem services (Balvanera et al 2022). To advance in the identification of essential variables for SESs, the knowledge produced through place-based social-ecological research is fundamental. In this sense, the potential of SES mapping studies could be fostered through new approaches that systematically identify the most relevant indicators for characterizing the diversity of SESs across territories.
In this study, we propose an approach to identify the most relevant indicators to map SES archetypes. Our goal was to enhance objectivity in the indicator selection process by a more standardized and repeatable method that facilitates the comparability and knowledge generalization of SES mapping studies. Specifically, we developed a data-driven methodological routine to detect and map SESs by identifying the most statistically meaningful indicators to capture the social-ecological diversity. We operationalized a reference list of variables and a conceptual framework (Pacheco-Romero et al 2020) to organize the indicator's database and characterize the identified SESs. We used the pilot case study of Andalusia (southern Spain) to illustrate the common process of responding the following three questions when mapping SES archetypes:
- (a)What are the most relevant indicators to identify and characterize the diversity of SES archetypes?
- (b)What are the main SES archetypes and the characteristics that define them?
- (c)What does our data-driven selection of indicators contribute to previous expert and empirical knowledge on key variables for characterizing and mapping SESs?
2. Materials and methods
2.1. Database development
We developed a database of 86 continuous indicators using open regional databases (table S1.1 available online at stacks.iop.org/ERL/17/045019/mmedia). Indicators were compiled for all the munipalities in Andalusia (Spain) (n = 778 municipalities to date 2016), an ecologically and culturally diverse region with high availability of social and ecological data. We operationalized the reference list of variables and conceptual framework proposed by Pacheco-Romero et al (2020) (figure S1.1) to organize the database and facilitate the subsequent characterization of SES archetypes. Thus, our indicators represented 49 variables distributed into 11 dimensions across the three main SES components (i.e. social system, ecological system, and interactions) (figures 1 and S1.2). When needed, indicators were aggregated at the municipality level by calculating the spatial mean for continuous indicators. In the case of categorical indicators, these were transformed into continuous data by calculating the relative area share per municipality of specific classes of interest. Overall, to ensure comparability among municipalities, we calculated relative values (e.g. per unit area, per inhabitant, area share) if required.

Figure 1. Distribution of the 86 indicators used in the analysis into 11 dimensions across the three main SES components.
Download figure:
Standard image High-resolution image2.2. Identification of key indicators for SES mapping
We developed a methodological routine based on multivariate analysis to screen the initial database through the sequential elimination of the least relevant and highly correlated indicators (figure 2). First, we inspected Pearson's correlations to identify highly correlated indicators. Second, we developed a cluster analysis to group municipalities into SES archetypes. We applied a hierarchical cluster analysis (HCA) based on Ward's method, which minimizes the total variance within clusters (Ward 1963), and a less restrictive Manhattan distance to ensure convergence (Rocha et al 2020). To determine the optimum number of clusters, we tested different cut-off levels of the cluster dendrogram to obtain a comprehensible picture of the diversity of SESs based on our knowledge of the study area. This yielded a set of 15 SESs, which was kept constant throughout the analysis. Third, we assessed the relevance of the indicators for identifying such SESs by computing a random forest analysis (RF) (Breiman 2001). To define the classification equation that this analysis takes as input, we used as independent variables all indicators, and as dependent variable the SES cluster assigned to each municipality by the HCA (see equation in figure 2). From RF run, the mean decrease accuracy (MDA) index was calculated to assess each indicator's importance in SES identification. This index represents how the accuracy of the classification of municipalities into the SES clusters decreases if an indicator is eliminated. Thus, the higher the value of the index, the greater the importance of the indicator (Archer and Kimes 2008, Han et al 2016). We performed all the analysis in R (R Core Team 2018).
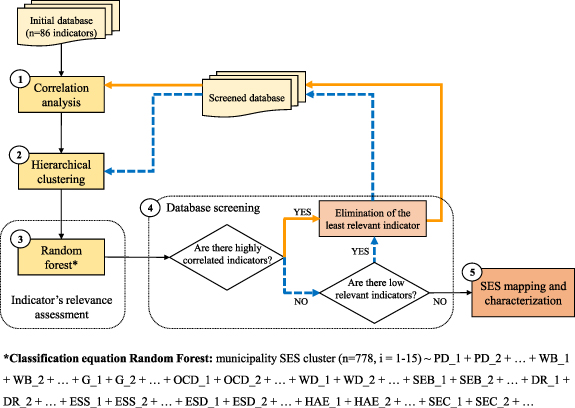
Figure 2. Multivariate analysis routine to identify the most relevant indicators for social-ecological system (SES) archetype mapping: (1) Pearson's correlations to identify highly correlated indicators; (2) cluster analysis to group municipalities into SES archetypes; (3) random forest (RF) analysis to assess indicator's relevance in SES identification; (4) sequential screening of the database by discarding the most correlated and least relevant indicators, one at each loop of the routine; (5) mapping and characterization of SESs from the final screened database. Solid orange and dashed blue arrows indicate the two alternative paths to develop the routine depending on whether correlated indicators do remain or not in the database, respectively. The classification equation used in RF is shown below the figure (see table S1.1 for acronisms meaning).
Download figure:
Standard image High-resolution imageFourth, we screened the database by discarding the most correlated and least relevant indicators, one at each loop of the routine. This means that after removing an indicator, the cluster analysis and the RF were re-run to obtain a new SES clustering and indicator's relevance for this new classification. We eliminated correlated indicators first (|r| > 0.7; Dormann et al 2013), discarding those that showed the lowest relevance in the RF (i.e. the lowest MDA index values) (orange path, figure 2). Once correlation was reduced in the database overall, we continued eliminating the least relevant indicators (dashed blue path, figure 2). For our case study, we considered as low relevant indicators those with a MDA index value below 20. Thus, we halted the screening process when no indicator showed a MDA below this threshold.
2.3. Mapping and characterization of SESs
Once the database was screened, we mapped the SES cluster memberships for all municipalities from the last hierarchical clustering (step four, figure 2). To characterize the identified SESs, we assessed the magnitude and direction of impact of each indicator for each cluster (cf Levers et al 2018). We first averaged indicator values across all municipalities in a specific cluster, and then calculated the deviation (in standard deviations) of the cluster mean to the overall mean of the entire study area (table S1.2). Thus, positive deviances refer to above average values, and negative deviances to below average values, regarding the overall mean for the study area. Based on the impact of indicators in each cluster, and our knowledge of the study area, we then described, labelled, and classified SESs according to their characteristics and spatial patterns.
2.4. Comparing empirical and expert knowledge on the relevance of variables to characterize and map SESs
Finally, we compared the empirical relevance of our indicators with existing empirical and expert knowledge on key variables for the study of SESs. For that, we focus on the 49 variables operationalized by the 86 indicators used in our analysis (table S1.1), and developed a matrix where variables were organized according to: (a) their use by preceding SES mapping studies (at local/regional scales or across scales); (b) their relevance according to expert knowledge; and (c) their relevance for our specific case-study (i.e. whether they were selected or not for SES mapping after the database screening –table S1.1). For point one, we based on a literature review on variables used in SES mapping studies (hereafter, empirical knowledge), and for point two, on a reference list of prioritized variables from a survey conducted to SES researchers (hereafter, expert knowledge), both developed in Pacheco-Romero et al (2020) (see table S1.3, and figure S1.2).
3. Results
3.1. Key indicators for SES mapping
From the initial list of 86 indicators, we identified 29 relevant and independent indicators for mapping the diversity of SES archetypes in Andalusia, representing 10 of the 11 operationalized dimensions of the SES (figure 3 and table S1.1). The ten most relevant indicators (figure 3) included characteristics of the ecological system (mean annual temperature, desertification rate, seasonal coefficient of variation of the enhanced vegetation index, mean annual precipitation, net solar radiation), and of the interaction component (natural surface area, landscape diversity, night sky quality, greenhouse gas emissions in urban waste treatment, cropland productivity). At the bottom of the ranking there were some indicators of the social system component (population density, population dispersion, population mean age, mean income and agricultural subsidies) and of the interaction component (livestock production, total greenhouse gas emissions, employments in agriculture, average farm area, CO2 emissions in goods transport). Overall, ecological system indicators were at the top of the ranking, while social system indicators were at the bottom. It is worth mentioning that all indicators from the ecosystem service demand dimension (interaction component) were discarded for being highly correlated to other indicators (e.g. cropland area) or for not being useful to discriminate among SESs (e.g. indicators describing water use and energy use variables). For a detailed view of the results of the database screening, see the groups of correlated indicators (figure S2.1), and the indicators eliminated throughout the screening process (table S1.1), both for being the least relevant indicators among the correlated ones, or the least relevant indicators from the database.
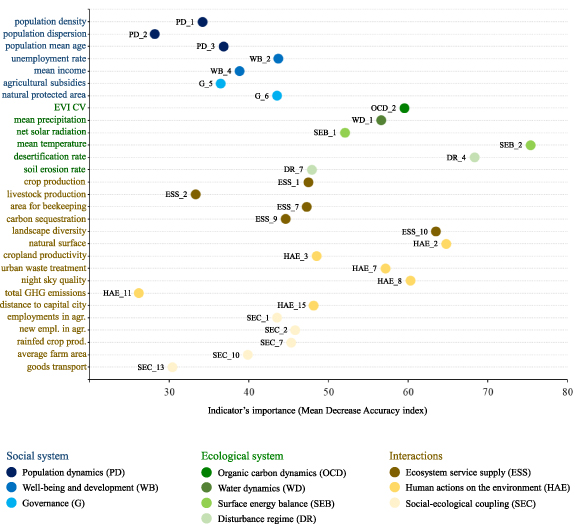
Figure 3. Importance of the 29 selected indicators for SES mapping from RF analysis. The higher the value of the mean decrease accuracy (MDA) index, the higher the importance of the indicator for the classification of municipalities into the SES clusters. The colour of the label for each indicator shows the SES component to which they belong (i.e. social system, ecological system, interactions), and the bubble colour refers to the dimension. The indicator ID is placed next to each bubble for ease of reference with the database table (table S1.1).
Download figure:
Standard image High-resolution image3.2. Map and characteristics of Andalusian SES archetypes
The 15 SES archetypes identified through the 29 key indicators generally represented compact territorial units (figures 4 and S2.2) which were classified in four main categories based on the dominant land cover and activities developed in the system. The 'natural systems' category (SES01–SES04) encompassed those SESs dominated by natural areas (>70%) distributed across some of the main mountain ranges of the region. These SESs hosted the largest proportion of natural protected area, and showed a high population mean age. The 'mosaic systems' category (SES05–SES07) represented mixed natural-agricultural landscapes with intermediate/below average crop production, a high rate of employments and new employments in agriculture, and high desertification rates (in eastern mosaics SES05 and SES06). Within the 'agricultural systems' category, we found SESs dominated by either livestock (SES08 and SES09) or cropping activities (SES10–SES14). Finally, the urban system (SES15) was the most densely populated, and showed the lowest population mean age and the highest mean income. For a more detailed description of each SES characteristics, please see tables S2.1 and S2.2.
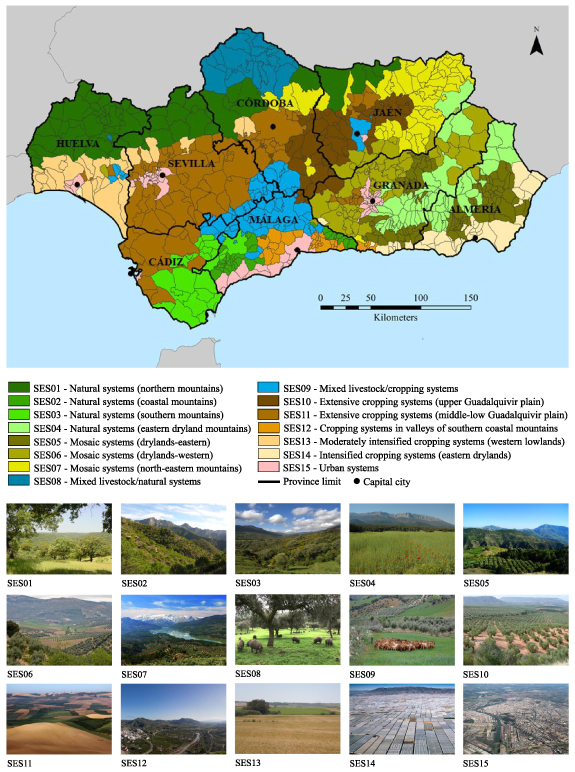
Figure 4. Map of SES archetypes of Andalusia (Spain), and snapshots of representative landscapes of each SES: SES01 - Sierra de Cardeña y Montoro Natural Park (Córdoba); SES02 - Sierras de Tejeda, Almijara y Alhama Natural Park (Málaga); SES03 - Los Alcornocales Natural Park (Cádiz); SES04 - Sierra María-Los Vélez Natural Park (Almería); SES05 - La Contraviesa (Granada); SES06 - Montes Occidentales (Granada); SES07 - Sierra de Segura (Jaén); SES08 - Valle de los Pedroches (Córdoba); SES09 - Montes de Málaga (Málaga); SES10 - Olive orchards in La Loma (Jaén); SES11 - Arable croplands in La Campiña de Sevilla (Sevilla); SES12 - Fruit crops in Valle del Guadalhorce (Málaga); SES13 - Arable croplands in La Campiña de Huelva (Huelva); SES14 - Greenhouses in Campo de Dalías (Almería); SES15 - Sevilla city (Sevilla). Please refer to tables S2.1 and S2.2 for a description of all SESs and their spatial coverage.
Download figure:
Standard image High-resolution image3.3. Comparison of empirical and expert knowledge on the relevance of variables to characterize and map SESs
We identified nine groups of variables reflecting a gradient of synergy-disagreement between empirical and expert knowledge on their relevance to characterize SESs (figure 5). Generally, variables in group C (32.7%) showed the most remarkable synergies, as they (a) have been widely operationalized across contexts and scales to map SESs (see table S1.3), (b) are considered relevant by expert knowledge (table S1.3), and (c) were mostly useful in our study area (highlighted with '*'). These variables represented aspects of the social system, the ecological system and the interactions between them. A similar agreement was found for variables within group B (16.3%), although they have been only used for SES mapping in local and regional contexts.

Figure 5. Comparison of empirical and expert knowledge on the relevance of variables to characterize and map SESs, based on: (1) the use of the variables in preceding SES mapping studies –at local/regional scales or across scales– (table S1.3); (2) their relevance according to expert knowledge (table S1.3); and (3) their relevance for our specific case-study (i.e. whether they were selected for SES mapping after the database screening –highlighted with '*'–, see table S1.1 and figure S1.2). The subgrouping of the variables within groups A, B and C reflect the different priority levels set by the expert assessment in Pacheco-Romero et al (2020), from highest (top) to lowest priority (bottom) (table S1.3 and figure S1.2). Letters S, E and I after variable names indicate 'social system', 'ecological system' and 'interactions', respectively. Note that this matrix includes the 49 variables operationalized by the 86 indicators used in our study (table S1.1).
Download figure:
Standard image High-resolution image
Across the remaining groups, the synergies between empirical and expert knowledge were less conclusive, with diverse configurations that encompassed: variables not prioritized according to expert knowledge but used in preceding SES mapping (groups E and F, 20.4%); priority variables but not used in SES mapping (group A, 8.2%); non-priority and non-used variables (group D, 14.3%); variables used in SES mapping but not assessed through expert knowledge (group H and I, 4.1%); and variables that were neither assessed by expert knowledge nor used in SES mapping (group G, 4.1%).
4. Discussion
This paper provides an illustrative data-driven approach to identify key indicators for SES mapping based on a methodological routine of multivariate statistical analysis. Applying this routine to an integrative database of 86 indicators, we identified 29 key indicators to map 15 SES archetypes in Andalusia (Spain). These SESs archetypes revealed patterns of social-ecological interactions and trade-offs potentially relevant to guide an integrated territorial management. Most of the key variables identified in our study area (highlighted with '*' in figure 5) were considered relevant by a previous expert assessment and used in preceding SES mapping studies. Overall, we provide new insights on the usefulness of variables to characterize SES that evidence the importance of integrating context-specific empirical assessments with general expert assessments to inform the identification of essential SES variables. More generally, our approach contributes to the growing field of archetype analysis in SES research.
4.1. Key indicators reveal patterns of human–nature interactions across SES archetypes
The identified key indicators allowed to organize the social-ecological complexity of the study area, reflecting a nested pattern of land sparing and land sharing strategies operating in the territory (Fischer et al 2008). Overall, the region was dominated by a land sparing pattern between agricultural and natural SESs. On the one hand, agricultural SESs (SES08–SES14), which occupied the most suitable topographical conditions, maximized the supply of provisioning ecosystem services (i.e. crops and livestock) at the expense of regulating ecosystem services (i.e. pollination and carbon sequestration). The dominance of these SESs evidenced the crucial role of agriculture in Andalusia for national and European food production (Malek and Verburg 2017, Ibarrola-Rivas et al 2020). On the other hand, natural SESs (SES01–SES04), mainly located in mountainous areas, showed a high supply of regulating ecosystem services at the expense of provisioning services. These SESs encompassed those areas less intensely transformed by human activity, which hosted the greatest rates of surface covered by natural or semi-natural ecosystems.
Below this general sparing pattern, agricultural and natural SESs represented in themselves distinct configurations of land sparing and land sharing strategies, respectively. For instance, within agricultural SESs (cropping systems), we found that the extent of the remaining natural surface was proportional to the level of intensification. Thus, the most intensified cropping systems of the region, located in eastern drylands (SES14), hosted the largest proportion of remaining natural surface of all cropping systems (c.a. 60%). Here, high-yield industrialized croplands targeted at maximum economic efficiency have been strongly segregated from natural habitats, which are protected from agricultural conversion (Piquer-Rodríguez et al 2012, Castro et al 2014, 2015). Achieving a sustainable intensification is one of the major challenges of these typical 'frontier landscapes' undergoing rapid land cover and use changes (Fischer et al 2008, Castro et al 2019, Martínez-Valderrama et al 2020b). Conversely, the least intensified cropping systems located along the Guadalquivir river valley (SES10 and SES11) hold the smallest proportion of natural surface of all SESs (c.a. 10%–12%, respectively). Here, management strategies should be targeted principally to protect the remaining patches of native vegetation, create connections among them, and increase landscape heterogeneity through agricultural diversification (Fischer et al 2008).
In contrast, natural SESs (SES01–SES04) hosted more wildlife-friendly practices, approaching a land sharing strategy. These SESs constitute cultural landscapes dominated by forests, shrublands and grasslands linked to traditional and extensive silvopastoral uses (e.g. wood harvesting for heating, cork harvesting, extensive livestock breeding, trashumance, hunting and fishing), local ecological knowledge, and high biodiversity rates (Oteros-Rozas et al 2013, Plieninger et al 2015, Malek and Verburg 2017, Hartel et al 2018). However, land use abandonment is often one of the main threats of these SESs, where biodiversity conservation and landscape heterogeneity depends on the maintenance of traditional agricultural activities (Halada et al 2011, Plieninger et al 2015).
Finally, mosaic systems (SES05–SES07) reflected intermediate characteristics between land sparing and land sharing strategies. These SESs showed a more balanced supply of provisioning and regulating services, evidencing a moderate human pressure. Overall, mosaic systems represent multifunctional cultural landscapes throughout the Mediterranean basin, which integrate high biodiversity and cultural heritage values, maintaining an important role for regional food production (Malek and Verburg 2017).
4.2. Integrating empirical and expert knowledge: insights towards essential SES variables
The assessment of the 49 variables operationalized by the 86 indicators used in our analysis (tables S1.1 and S1.3) yielded new insights on key variables for SESs characterization and mapping. First, the universality of the variables from group C (figure 5) to map SESs (e.g. Ellis and Ramankutty 2008, Václavík et al 2013, Martín-López et al 2017, Rocha et al 2020, Vallejos et al 2020), and the relevance reported by expert knowledge, could make them suitable to be considered as potential candidates to essential SES variables (Reyers et al 2017, Guerra et al 2019). In fact, these variables meet some criteria to be considered essential such as the representativeness for the system level, the adaptability to the context or data availability, and the feasibility to be derived and scaled to meet local, regional or global needs (Reyers et al 2017).
Second, the relevance of variables from group B for SES mapping seemed to be more dependent on the context or scale of analysis (e.g. Castellarini et al 2014, Hamann et al 2015, Queiroz et al 2015, Levers et al 2018), which can be also fundamental to represent the diversity and particularities of SESs for a specific region (Dressel et al 2018, Rocha et al 2020, Vallejos et al 2020). Indeed, one of the current challenges facing SES research is to identify which characteristics and patterns are more generalizable, and which are context-specific (Balvanera et al 2017, Magliocca et al 2018, Rocha et al 2019). Thus, lists of essential SES variables should integrate both universal (i.e. group C variables) and context-dependent attributes, organized in hierarchical structures (Ostrom 2009, Cox et al 2020). Such hierarchy might contribute to connect locally relevant indicators with globally essential variables (Guerra et al 2019), facilitating a more flexible use of the list (Ostrom 2009, McGinnis and Ostrom 2014, Frey 2017). In turn, it can improve our capacity to obtain more comparable results, produce generalized knowledge, and foster theory development on SESs (Magliocca et al 2018, Meyfroidt et al 2018, Vaz et al 2021).
Third, the lack of agreement between empirical and expert knowledge in the remaining groups of variables yielded more uncertain conclusions that evidenced the need of futher assessements. For instance, the high data availability could have promoted a wide use of the variable economic level (group F) through diverse indicators such as gross domestic product (Václavík et al 2013), household income (Hamann et al 2015), and income per capita (Martín-López et al 2017). However, its perception as non-priority might reflect the attempts from sustainability research to avoid assessing social well-being through economic indicators (Helne and Hirvilammi 2015, Costanza et al 2016, Fioramonti et al 2019). On the contraty, the lack of data availability could be limiting the use of suitable indicators to operationalize variables from group A in SESs mapping (Rocha et al 2020), which indeed were considered priority by expert knowledge. Our analysis also revealed variables that were crucial to map SESs in our study area, but that have not been assessed by experts, or used in previous SES mappings. For instance, desertification (group G) may not be appropriate in some environmental conditions but should be useful in other arid regions, if data were available (Martínez-Valderrama et al 2020a). Urban waste production (group H), although not previously assessed, was used for delineating local SESs in Andalusia (Martín-López et al 2017). Likewise, indicators related to biodiversity and habitat maintenance (group I) were widely used for SES mapping across scales, such as species richness (Václavík et al 2013, Hanspach et al 2016, Spake et al 2017), or distribution of ecoregions (Castellarini et al 2014, Levers et al 2018). Overall, these examples suggest that the systematic application of our data-driven approach could help to accumulate empirical knowledge on the most relevant variables across contexts and scales, and contribute to the current discussions for the development of reference lists of variables for SESs (e.g. Ostrom 2009, Frey 2017, Reyers et al 2017, Guerra et al 2019, Cox et al 2020, Pacheco-Romero et al 2020).
4.3. Advances in archetype analysis for SES research
Our approach contributes to the portfolio of methods used in archetype analysis (Sietz et al 2019) through a data-driven methodological routine to guide the selection of indicators for the spatial mapping of SESs. As a major strength, the routine incorporates a machine learning technique (i.e. RF analysis) that assists the researcher with the screening of a database where the importance of the indicators to map SESs is not known a priori, thereby reducing the level of subjectivity. Thus, the coupling of the hierarchical clustering (HC) and RF allows the researcher to know first, the SESs of a certain study area, and second, the importance of the indicators to discriminate among such SESs. These analyses (HC and RF) are not able to produce all this information on their own: HC reveals SES clusters but not the importance of the indicators to discriminating them; and RF analysis needs a dependent variable (i.e. SES clusters in our case) to determine the role of the independent variables (i.e. social and ecological indicators) in generating such classification.
Our study also contributes to enhance the treatment of causality in archetype analysis through more representative thick descriptions (i.e. quantitative insights and detailed narratives of recurrent features) and causal factor configurations (i.e. patterns of archetype determinants) (Sietz et al 2019) by deriving: (a) key indicators to explain the social-ecological differences across units of study (e.g. municipalities) (figure 3), and (b) the impact of indicators in characterizing each SES cluster (table S2.2). Such causal factor configuration could be used as the starting point to set hypothesis and further qualitative analysis to identify the causal mechanisms driving human-nature relations. Thus, our approach can provide useful insights for the identification of archetypes as 'building-blocks' (e.g. recurrent causal mechanisms), which would help to achieve a more in-depth assessment of causality across case-studies (Sietz et al 2019). Given that identifying archetypes as 'building-blocks' can be a time-consuming endeavor, specially when having a high number of case-studies (e.g. 778 municipalities in our region), a prior identification of archetypes as typologies of cases enables obtaining a reduced set of homogeneous clusters to explore more easily the recurrent causal mechanisms shaping human-nature relations.
Finally, in terms of the scope and limitations of our approach, it is worth noting that the methodological routine constitutes just an example of a combination of well-known techniques, thus other analyses are possible and should be further tested. In addition, the selection of the optimal threshold to halt the screening process (i.e. the value of the MDA index of RF analysis) could need to be adjusted based on the specific data used in the analysis. Regarding the applicability of the routine, it can be particularly useful in areas with high data availability, although the time inconsistency of the indicators may still challenge the representativeness of the results (e.g. Dittrich et al 2017, Martín-López et al 2017, Dressel et al 2018). Ideally, maps of SES archetypes should be based on the most recent data, and integrate average time series for those indicators with high temporal variability. However, given that data-availability varies across territories and variables can be operationalized through multiple indicators (whose relevance depend on the context and data quality), accumulating knowledge on the most relevant indicators to map and characterize SESs throughout regions is fundamental to improve their long-term monitoring.
5. Conclusions
This study provides a repeatable data-driven methodological routine to assist the selection of the most relevant indicators to map the diversity of SES archetypes in a region. The application of this routine to a wide database of potentially relevant indicators for Andalusia (Spain) showed substantial differences in their usefulness for discriminating among SESs. Specifically, this method can foster the potential of SES mapping to contribute to place-based social-ecological research aims, by developing: (a) more comparable SES mappings based on a more objective selection of the key indicators leading SES distribution, (b) more effective operationalizations of SES frameworks and reference lists of variables, and (c) generalizable empirical knowledge on the most relevant variables to characterize SESs across contexts and scales that guides the identification of essential variables for SESs. Our results evidence the importance of combining insights from expert and empirical assessments in the identification of essential variables, as well as one of the potential challenges in the development of reference lists of variables for SESs: the integration of both universally and context-specific relevant variables. More generally, this study contributes to a better understanding of causal factor configurations in SES archetype analysis from a top-down perspective (i.e. as typologies of cases), which may facilitate the development of more in-depth assessments of the archetypical causal mechanisms (i.e. bottom-up, as 'building blocks') determining the diversity of social-ecological interactions across landscapes.
Acknowledgments
We thank R Romero-Calcerrada and J M Requena-Mullor for helpful discussions, and three anonymous reviewers for their constructive suggestions to improve this paper. We also thank the Spanish Ministry of Economy and Business (Project CGL2014-61610-EXP) for the financial support, as well as the Spanish Ministry of Education for the FPU Predoctoral Fellowship of MPR (FPU14/06782) and MTTG (16/02214). MPR gratefully acknowledges funding from Universidad de Almería for a research stay at the Laboratory of Regional Analysis and Remote Sensing (LART) of University of Buenos Aires to develop this study. This research was done within the LTSER Platforms of the Arid Iberian South East—Spain (LTER_EU_ES_027) and Sierra Nevada/Granada (ES- SNE)—Spain (LTER_EU_ES_010), and contributes to the Global Land Programme.
Data availability statement
The data that support the findings of this study are available upon reasonable request from the authors.