

Abstract
Climate change is expected to exacerbate the urban heat island (UHI) effect in cities worldwide, increasing the risk of heat-related morbidity and mortality. Solar reflective 'cool pavement' is one of several mitigation strategies that may counteract the negative effects of the UHI effect. An increase in pavement albedo results in less heat absorption, which results in reduced surface temperatures (Tsurface). Near surface air temperatures (Tair) could also be reduced if cool pavements are deployed at sufficiently large spatial scales, though this has never been confirmed by field measurements. This field study is the first to conduct controlled measurements of the impacts of neighborhood-scale cool pavement installations. We measured the impacts of cool pavement on albedo, Tsurface, and Tair. In addition, pavement albedo was monitored after installation to assess its degradation over time. The field site (∼0.64 km2) was located in Covina, California; ∼30 km east of Downtown Los Angeles. We found that an average pavement albedo increase of 0.18 (from 0.08 to 0.26) corresponded to maximum neighborhood averaged Tsurface and Tair reductions of 5 °C and 0.2 °C, respectively. Maximum Tsurface reductions were observed in the afternoon, while minimum reductions of 0.9 °C were observed in the morning. Tair reductions were detected at 12:00 local standard time (LST), and from 20:00 LST to 22:59 LST, suggesting that cool pavement decreases Tair during the daytime as well as in the evening. An average albedo reduction of 30% corresponded to a ∼1 °C reduction in the Tsurface cooling efficacy. Although we present here the first measured Tair reductions due to cool pavement, we emphasize that the tradeoffs between Tair reductions and reflected shortwave radiation increases are still unclear and warrant further investigation in order to holistically assess the efficacy of cool pavements, especially with regards to pedestrian thermal comfort.
1. Introduction
The urban heat island (UHI) generally refers to urban areas that are warmer than surrounding rural areas [1, 2]. Howard [3] described this phenomenon more than 200 years ago in The Climate of London, and the UHI has been subsequently confirmed by many studies [2, 4–6]. The UHI is primarily caused by (a) urban materials that absorb and retain heat, (b) urban geometries that trap radiation in the urban canopy, (c) anthropogenic waste heat, and (d) the replacement of natural vegetation with impervious surfaces [1–3]. Previous studies have discussed the impacts of the UHI on increased energy demand [7–10], increased risk of critical infrastructure failure [11], deterioration of air quality [12], and increased risk of heat-related illness and mortality [13, 14]. In the United States, extreme heat is the leading weather-related cause of mortality [15]. Compounded with the rise of global temperatures and elevated risks of extreme heat due to climate change, along with an increasing global urban population [16], the negative consequences of the UHI are expected to get worse, barring rapid and effective mitigation efforts [17–20].
With most American cities warming at twice the rate of globally averaged warming between 1961 and 2010 [21], a host of heat mitigation strategies have been proposed in the last few decades to counteract the UHI [17, 20, 22–34]. Most strategies involve the modification of urban land cover and/or land use. The main strategies that have been discussed in recent literature include solar reflective cool surfaces, urban greening, 'green' vegetative roofs and walls, and non-vegetative shading structures [20, 32, 33, 35–37]. All of these strategies alter the surface energy balance with the goal of reducing the heat that is trapped in the urban environment.
The use of solar-reflective cool surfaces has garnered attention in the past few decades as a relatively straightforward mitigation strategy. In short, by increasing the albedo (i.e. solar reflectivity) of urban surfaces, an increased fraction of incident solar radiation at the surface is reflected back to space. The reduction in absorbed sunlight leads to lower surface temperatures (Tsurface), which results in lower sensible heat and longwave radiation fluxes from the cool surfaces. Given a sufficiently large spatial extent of these cool surfaces, the reduction in Tsurface should also translate to reductions in near-surface air temperatures (Tair) [22, 23, 28–34].
The impacts of cool pavements have not been studied as extensively as the impacts of cool roofs, which have been investigated by numerous studies at different spatial scales [25, 35, 38–45]. These studies have led to real-world implementation of policy including cool roofs in major cities in the United States [46]. Some cities are likewise pushing to implement similar policies for cool pavements [47], but the potential impacts of cool pavements are not well understood.
Most of the cool pavement impact studies to date are based on numerical modeling, using either mesoscale climate models [24, 31, 35] or micrometeorological computational fluid dynamics models [23, 32, 33, 48–60]. A number of studies have studied the thermal performance of cool pavement segments in laboratory or controlled field measurement settings, but these studies did not investigate the direct impacts on the urban environment [61–67]. One modeling study [68] used an indoor-outdoor coupled building energy model to study the effects of cool pavements on building energy use. Regarding observational studies, another study [69] used field measurements of cool pavement test sections to quantify potential energy savings for artificial lighting. Only a single study [22] estimated the impacts of neighborhood-scale cool pavements using real-world field measurements.
Although cool pavements are undoubtedly effective at reducing Tsurface, it is uncertain how they impact Tair and human thermal comfort. Even the seemingly basic question concerning the efficacy of cool pavements in reducing Tair remains unsettled, with previous estimates of Tair reductions ranging from anywhere between 0.1 °C to >2 °C. Another complication with cool pavements is that they are applied at ground level, which means that reflected shortwave radiation from cool pavements interact with surrounding surfaces, including buildings and pedestrians. This complication leads to a tradeoff between the benefits of lower Tair and the penalties of increased reflected shortwave radiation at ground level. These penalties have been noted by a number of previous papers but remain uncertain and highly dependent on environmental context [22, 32, 70]. Furthermore, cool pavement albedo may decrease rapidly due to vehicular traffic and natural weathering. The rate of cool pavement albedo degradation in the real world and its effect on mitigation performance has not been comprehensively reported in previous studies.
In this study, we report on field measurements of the largest known residential deployment of cool pavements in California. The field site was located in the Los Angeles (LA) area, and measurements were made during the summer of 2019. These measurements were used to determine the neighborhood-scale impacts of cool pavements under real-world conditions. In particular, the following results are presented in this paper: (a) the spatial and temporal variability of pavement albedo, (b) the impact of cool pavement on Tsurface, and (c) the impact of cool pavement on Tair. A brief caveat on the implication of our results on thermal comfort, as well as suggestions for future research, are also included in the discussion.
2. Methods
2.1. Site details
Between 7 October 2019 and 15 November 2019 ∼59 020 m2 of cool pavements were deployed in a residential neighborhood in Covina, California, which is located ∼30 km east of downtown LA (see figure 1). The installation area is shown in figure 1 and is hereafter referred to as the 'impact area.' The impact area measures approximately 0.8 km × 0.8 km and is centered at approximately (34.096, −117.921). Full details regarding the installation schedule can be found in figure 2, since measurements were taken before, during, and after all installations were completed. Directly west of the impact area is the 'control area,' which is comparable in size to the impact area, has similar land cover features, and did not have cool pavement installations. (see figure 1). Measurements in an adjacent and upwind control area were necessary in order to properly control for factors other than the cool pavement installation that may affect the temperature comparisons. Wind data from the nearest Automated Surface Observing Systems weather station confirm that the control area was upwind of the impact area (see figure S5 available online at stacks.iop.org/ERL/17/044027/mmedia).

Figure 1. Map of the measurement site in Covina, CA. The impact area (with cool pavements) is shown in blue, while the control area (without cool pavements) is shown in red. The inset map in the upper-left corner shows the Covina site with respect to downtown LA and the greater LA metropolitan area. Map data ©2020 Google.
Download figure:
Standard image High-resolution image
Figure 2. Map of cool pavement installation by product. Modified figure based on original map supplied by LA County Department of Public Works. Below the map is a table that describes the corresponding installation schedule. The red dashed box on the map shows the portion of Queenside Dr that was installed after the first phase of installation. Reproduced with permission from Los Angeles Department of Public Works (2019).
Download figure:
Standard image High-resolution imageThis pilot installation was coordinated and supervised by the LA County Department of Public Works (LADPW) in order to test the real-world performance and impacts of cool pavement. The companies that produced each cool pavement product were responsible for the installation of the cool pavement. The site was chosen by LADPW primarily for logistical reasons, because the area was under their jurisdiction; but the site also exhibits other ideal traits. For example, the site is located in the eastern side of LA County, which generally has higher temperatures relative to downtown LA. The average maximum summer temperature between 1981 and 2010 at the closest long-term weather station to the site (Pomona Fairplex station) was 31.3 °C, which is 3.6 °C higher than the same metric for downtown LA (www.ncdc.noaa.gov/cdo-web/datatools/normals, last access 3 February 2022). Furthermore, the site is located in census tract 4057.01, which has a tree canopy cover of only ∼3.3% (www.cal-heat.org, last access 3 February 2022). These local characteristics make this site a good candidate for this pilot study.
2.2. Measurement details
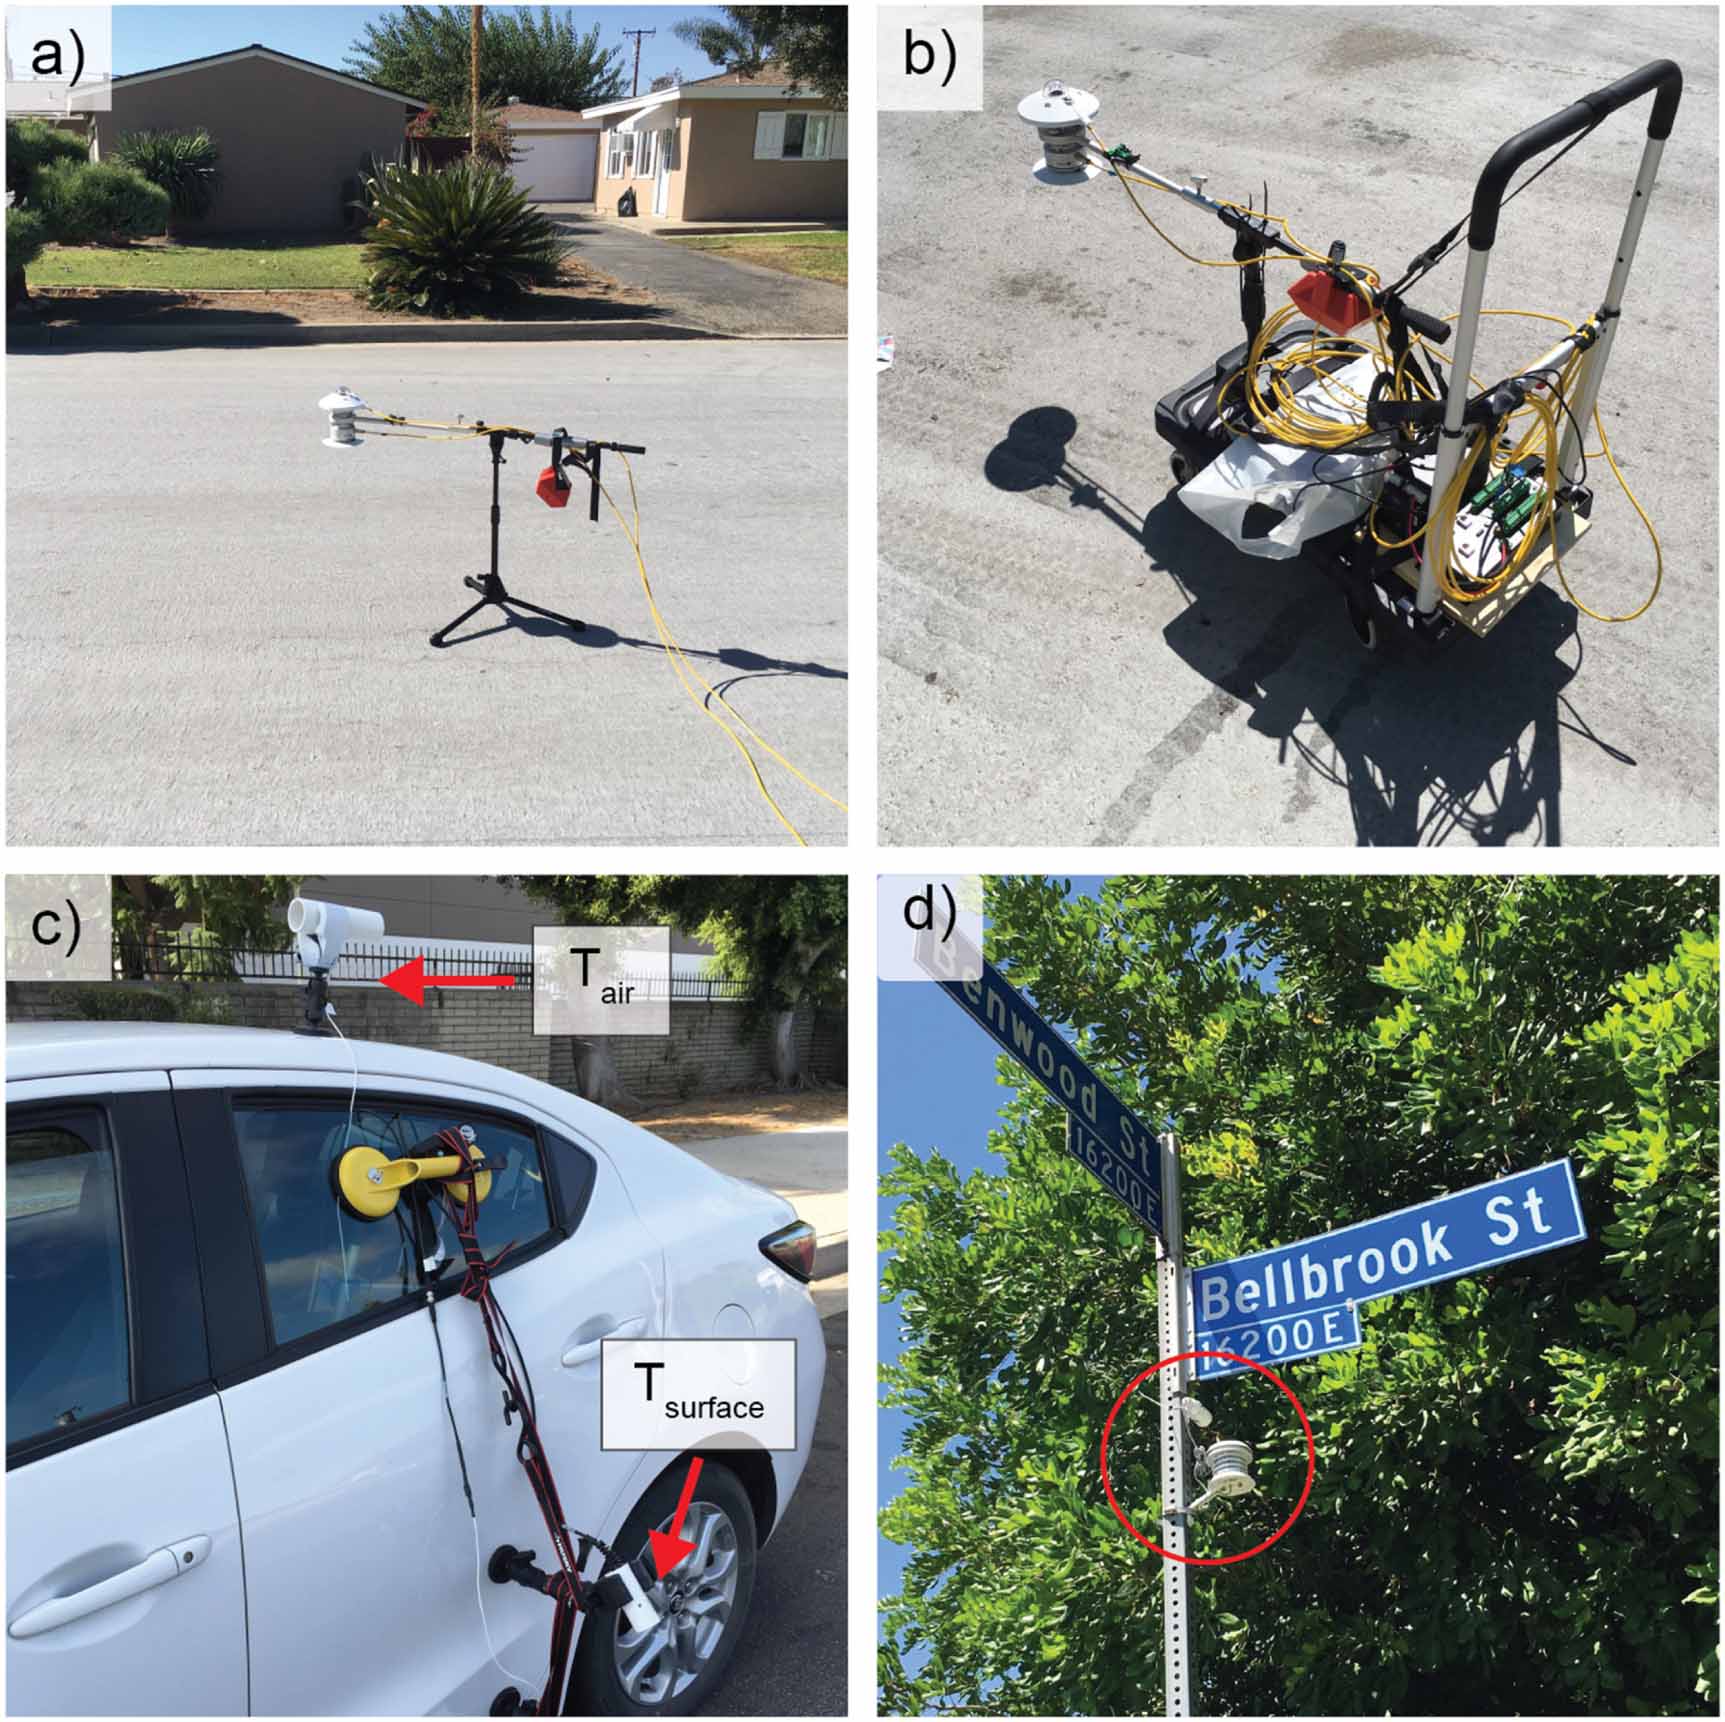
Albedo, Tsurface, and Tair were measured at varying sampling frequencies, time intervals, and spatial coverage. Pavement albedo was measured using two Kipp & Zonen SMP6 Smart Pyranometers. Stationary measurements of albedo were taken at seven distinct locations, both before and after installation (see figure S1). These locations were chosen to represent variability due to the different cool pavement products and road wear from traffic. Albedo spot measurements were sampled at 1 Hz and average albedo was computed using 1 min means. Mobile albedo measurements were also taken at 1 Hz and the data were paired with GPS measurements. For stationary albedo, the height of the bottom pyranometer dome was positioned at ∼50 cm above the ground, according to ASTM E1918-21 [71]. For mobile albedo, the height was positioned at ∼60 cm due to the cart configuration, however diagnostic testing was conducted prior to the campaign to ensure that the minor deviation from ASTM E1918-21 would not significantly impact the albedo measurements (see supplement for details).
Mobile transect measurements of 1.6 m Tair and Tsurface were taken at a sampling rate of 1 Hz with an Apogee ST-110 thermistor and Apogee SI-111SS infrared radiometer, respectively. The thermistor was shielded with a white PVC pipe segment (3.81 cm nominal diameter, 15 cm length) in order to minimize the effects of incident and reflected radiation. These instruments were mounted on a car and measurements were taken first in the impact area and then the control area for each unique transect (see figure 3). For each day of measurements, transects were performed every three hours at the top of the hour, with the first transect starting at 09:00 local standard time (LST) and the last transect starting at 21:00 LST. Transect measurements were taken on three days pre-installation, and three days post-installation.

Figure 3. Photos of instrumentation set-up. Panel (a) shows the set-up for stationary albedo measurements. Panel (b) shows the set-up for mobile albedo measurements. Panel (c) shows the set-up for mobile transect measurements of 1.6 m air temperature and surface temperature. Panel (d) shows the set-up for stationary 3 m air temperature. The sensor is highlighted in the red circle.
Download figure:
Standard image High-resolution imageStationary Tair was continuously sampled every five minutes, between 27 August 2019 and 6 November 2019 at four locations in the impact area and five locations in the control area (see figure S2). HOBO U23-004 External Temperature Data Loggers were used with HOBO RS3-B solar radiation shields for stationary Tair. These sensors were placed ∼3 m above ground level on street sign poles (see figure 3). They were installed at 3 m height in order to minimize risks of vandalism or theft. Note that only data from non-daylight hours were used for the stationary Tair analysis due to an increase in reflected shortwave radiation at the surface potentially causing a confounding warming signal.
All GPS measurements were taken with an iPhone 6s at a frequency of 1 Hz, using an application called GPS Tracker. Representative photos of the various instrumentation set-ups are shown in figure 3.
2.3. Quantifying the impact of cool pavement on temperatures: difference-in-difference (DID) method
In order to quantify the impact of cool pavements on Tsurface and Tair, we used a technique called the DID method. The DID method originates in econometrics but has since been used in many quantitative fields [72–82]. In short, the DID method calculates the direct impact of a treatment/event on some variable by using measurements of the variable of interest in both a control group and an impact group, both before and after the event of interest. This results in four distinct subsets of measurements: (a) pre-event impact, (b) pre-event control, (c), post-event impact, and (d) post-event control. These measurements allow us to calculate how the difference between the impact and the control changes over time. The post-event versus pre-event difference in the impact versus control difference (i.e. the DID) can then be attributed as the direct impact of the event on the variable of interest. A simplified illustration of the DID method is shown in figure 4. Further details regarding the DID method can be found in the supplement.

Figure 4. Illustration of the difference-in-difference (DID) method. Δpost is the post-event difference between the impact and control measurements (e.g. impact–control). Δpre is the pre-event difference between the impact and control measurements. The DID is defined as the difference between Δpost and Δpre. This DID value is therefore the attributable impact of the event on the variable of interest, Y. 'Dummy' values are shown in the figure as a simple illustration. In this example, the event reduced Y by 1 unit (i.e. DID = −1).
Download figure:
Standard image High-resolution image3. Results and discussion
3.1. Albedo
Based on mobile albedo measurements taken on 17–18 September 2019, the mean (± standard deviation) pre-installation pavement albedo of the impact area was 0.08 ± 0.02 (see figure 5). Seven stationary measurement locations (S1 through S7) were distributed throughout the impact area. As shown in figure 5, the albedo at the seven locations ranged from 0.22 to 0.38 on 21 October 2019 five days after cool pavement installation. This corresponds to an albedo increase of 175% to 363% relative to the original asphalt pavement. Subsequently, we observed a decline in albedo at all locations, S1 through S7. On 18 November 2019 the stationary albedo measurements ranged from 0.20 to 0.29. The albedo degradation from the first set of post-installation measurements (21 October 2019) to the third set (18 November 2019) ranged from 8% to 30%. A heavy rain event occurred on 20 November 2019 and the albedo increased at all stationary measurement locations. Albedo measurements on 22 November 2019 two days after the rain event, ranged from 0.23 to 0.31. The albedo increases due to the rainstorm ranged from 7% to 17%, corresponding to an absolute albedo increase of 0.02–0.04. This rain event shows that natural precipitation can wash away dust from deposition and dirt from tire wear to a limited but noticeable extent.

Figure 5. Stationary albedo measurements made at seven distinct locations (S1–S7) throughout the impact area. The markers represent discrete measurements. The markers and lines are color-coded by the different cool pavement products that were installed in the impact area. Pre-installation albedo represents the mean albedo of the pavement in the impact area before installation and it is represented here by the dashed black line. The pre-installation albedo is based on mobile albedo measurements taken on 17–18 September 2019. A heavy rain event occurred on 20 November 2019 with a recorded 24 h precipitation of 8.9 mm (NCEI 2021).
Download figure:
Standard image High-resolution imageAlbedo measurements were also taken ∼10 months following the first phase of cool pavement installation (figure 5). Albedo at all spot measurement locations decreased markedly, with values ranging from 0.16 to 0.24. Pavement albedo degradation over the ten month timeframe ranged from 12% to 49%. Spot measurement results are summarized in table 1. Of note, we observed a wide variability in albedo degradation, which we attribute to the performance variability between different cool pavement products and the spatially heterogenous traffic road wear.
Table 1. Albedo spot measurement details and results.
| Location | Product number | Located near intersection, corner, or cul-de-sac? | Percent change (%) between mean pre-installation albedo (0.08) and initial albedo (21 October 2019) | Percent change (%) between 21 October 2019 and 18 November 2019 (∼1 month) | Percent change (%) between 21 October 2019 and 18 August 2020 (∼10 months) | Percent change (%) between mean pre-installation albedo (0.08) and 10 month albedo (18 August 2020) |
|---|---|---|---|---|---|---|
| S1 | 1 | No | +213 | −8 | −12 | +175 |
| S2 | 1 | No | +200 | −8 | −13 | +163 |
| S3 | 3 | No | +363 | −22 | −49 | +138 |
| S4 | 2 | Yes | +313 | −30 | −33 | +175 |
| S5 | 2 | Yes | +263 | −14 | −17 | +200 |
| S6 | 1 | No | +225 | −15 | −15 | +175 |
| S7 | 1 | Yes | +175 | −9 | −27 | +100 |
a Note: Product 2 was reapplied in February 2020 (i.e. four months after initial application) due to issues with skid resistance (see figure 2). Therefore, these values are not necessarily directly comparable to areas that were aged for ∼10 months continuously without reapplication (i.e. albedo degradation for Product 2 at ten months is likely underestimated slightly). Nevertheless, these values are presented to show the range of albedo values at different locations throughout the impact area.
The spatial heterogeneity of albedo can be further observed in figure 6. Panels (a)–(c) show pavement albedo approximately one week, one month, and one year after installation. One week after installation, we already observed substantial spatial variability in albedo, which was mainly driven by different initial albedos of the products. The southern half of the impact area was coated with product 3, while the northern half was coated with products 1 and 2. The corresponding albedo is generally higher in the northern area relative to the southern area. This spatial pattern is consistent with the stationary albedo measurements (see figure 5).

Figure 6. Panels (a)–(c) show a 'heat-map' of albedo ∼1 week, ∼1 month, and ∼1 year after cool pavement installation, respectively. Panels (d)–(f) show satellite imagery of representative areas of cool pavement with marked albedo decrease (highlighting with red circles) in the impact area. Map data ©2020 Google. © OpenStreetMap contributors.
Download figure:
Standard image High-resolution imageAn additional source of spatial variation was caused by different patterns of tire wear. Corners, intersection, cul-de-sacs, and bends were more likely to exhibit greater tire wear. This effect was observed in the mobile albedo measurements (see figures 6(a)–(c)), and from visual inspection of satellite imagery (see figures 6(d)–(f)). Over the timespan of a year, the average albedo of the three cool pavement products decreased from 0.26 to 0.18. This corresponds to a spatially averaged albedo degradation of 30% over the year.
While others have measured the effects of aging on cool pavement albedo in either laboratory settings or small-scale field measurements [83–85], we present here the most extensive results to date from long-term albedo monitoring of neighborhood-scale cool pavements subjected to both vehicular traffic and natural weathering. A study by Lontorfos et al [86] reported a one-year albedo reduction from 0.26 to 0.15 for a 4600 m2 cool pavement installation on a single street in Athens, Greece. This is consistent with the range of albedo degradation we observed in this study. One important distinction between Lontorfos et al [86] and our study is that they reported a majority of the albedo degradation occurring within a month of installation, while we continued to observe albedo degradation following the month timeframe (see figure 5). This implies that cool pavement albedo degradation is not universally consistent and can be dependent on the context of the physical environment and the cool pavement product.
Akbari and Matthews [30] reported that aged asphalt pavements have albedos that range from ∼0.10 to 0.18. In our study, the mean cool pavement albedo decreased to 0.18 within one year. This implies that aged cool pavements subjected to real-world exposure may have albedo values similar to that of aged asphalt pavement. However, it is interesting to note that the rates of albedo change for traditional asphalt and cool pavements may not be equal is magnitude. For example, the control area in our study was freshly paved with traditional black asphalt shortly before the campaign, and we observed that albedo stayed consistent at ∼0.05 over the duration of a whole year. This implies that traditional asphalt pavement may take much longer to reach a steady-state increased albedo than it does for cool pavement to reach a steady-state decreased albedo. An oft-repeated concern with cool pavements is that vehicular traffic could result in rapid decline in its heat mitigation efficacy. This study highlights the critical need to plan for albedo degradation if cool pavements are deployed in the real world, either through improved maintenance, higher performance materials, and/or regular reapplication.
3.2. Surface temperature
Pavement Tsurface was measured as part of the mobile transects described in section 2.2. Approximately one week after installation, we observed lower Tsurface throughout the day in the impact area relative to the control area, with mean Tsurface reaching up to 40.0 °C and 44.9 °C in the impact and control areas, respectively (see figure S6). Figure 7 shows a matrix of barplots, where each barplot presents the DID at different hours throughout the day. These DID values were calculated using the mobile Tsurface measurements from a pair of measurement days. For example, the barplot in the top-left corner shows Tsurface DID values calculated using measurements from 23 September 2019 and 05 October 2019. In figure 7, the values shown in the red rectangle refer to the impact of cool pavement installation on Tsurface. Our measurements show that Tsurface reductions due to cool pavement installation follow a consistent diurnal cycle, with a peak reduction of 5 °C observed at 15:00 LST. The smallest reduction of 0.9 °C was observed at 09:00 LST.

Figure 7. Matrix of barplots showing the surface temperature DID for unique pairs of dates. The columns identify the first date used in the DID calculation and the rows identify the second date. The barplots outlined in red show the DID values that represent the impact of cool pavement installations on surface temperature. The barplots outlined in blue highlight the null DID impacts that occur when the DID calculations were made with two pre-installation dates or two post-installation dates. A negative DID value indicates a surface temperature reduction. The error bars represent the 95% confidence intervals for the mean.
Download figure:
Standard image High-resolution imageThe barplots outside of the red outline in figure 7 show the DID values calculated for either pairs of pre-installation dates or pairs of post-installation dates. The pre-installation and post-installation DID values in the blue boxes in figure 7 are nearly all centered about zero, with the 95% confidence intervals implying a null effect. The null results for pre-installation and post-installation date pairs confirm that the DID method is correctly controlling for external variabilities and can robustly quantify the effect of cool pavement installation.
In the two post-installation pair DID plots in the last row of figure 7, the slightly positive DID values (with the exception of 09:00 LST) imply that there was a 'treatment' that occurred between 25 October 2019 and 14 August 2020 that increased the Tsurface of the cool pavement. The treatment in this context was the degradation of the cool pavement albedo. In other words, the albedo degradation within a ten month time period reduced the ability of the cool pavement to reduce Tsurface by ∼1 °C during the day.
Overall, an average pavement albedo increase of 0.18 led to a maximum Tsurface reduction of 5 °C. This corresponds to a Tsurface reduction rate of 2.7 °C per 0.1 increase in pavement albedo. These Tsurface reductions are consistent with the range of what previous studies have reported. Most recently, Middel et al [22] reported that cool pavements were up to 6 °C cooler than asphalt pavements. Furthermore, we found that an albedo degradation of 0.08 after approximately one year of real-world exposure reduced the cooling efficacy for Tsurface by ∼1 °C. By linear extrapolation, we estimate that an albedo degradation of 0.1 will lower the cooling efficacy for Tsurface by ∼1.25 °C.
3.3. Air temperature
As described in section 2.2, we measured both stationary and mobile Tair. Figure 8 shows a scatterplot of Δpost versus Δpre using data from the stationary Tair measurements, where Δ signifies the difference in Tair between the impact area and the control area, and 'post' or 'pre' signifies whether the measurements were taken post-installation or pre-installation, respectively. Note, the post period for air temperature measurements described here refers to the period between the completion of the first installation phase and the start of the second installation phase. This means that the impact on air temperature described here is attributable to the cool pavements installed in the first phase (see figure 2). Our measurements indicate that cool pavements induced a 3 m Tair reduction between 19:00 and 23:59 LST, though only reductions for the hours of 20:00, 21:00, and 22:00 were statistically distinguishable from zero at a 95% confidence level. A maximum evening 3 m Tair reduction of 0.19 °C occurred at 21:00 LST.

Figure 8. A scatter plot for hourly mean Δpost versus Δpre, where Δ is the difference between 3 m air temperature in the impact area versus control area (i.e. impact minus control). 'Post' or 'pre' in the subscript signifies whether the measurements were made post-installation or pre-installation, respectively. The values inside each circle represents the hour of day and the error bars represent the 95% confidence interval for the mean. Values above the 1:1 line imply a warming effect due to cool pavement, while values below imply a cooling effect. The air temperature DID can be calculated as (Δpost−Δpre). Only non-daylight hours were included in this analysis (see section 2.2). The first non-daylight hour was 18:00 LST. Data from hours 00:00 LST to 06:00 LST showed a null effect (i.e. neither warming nor cooling effect) and are thus not included in the figure.
Download figure:
Standard image High-resolution image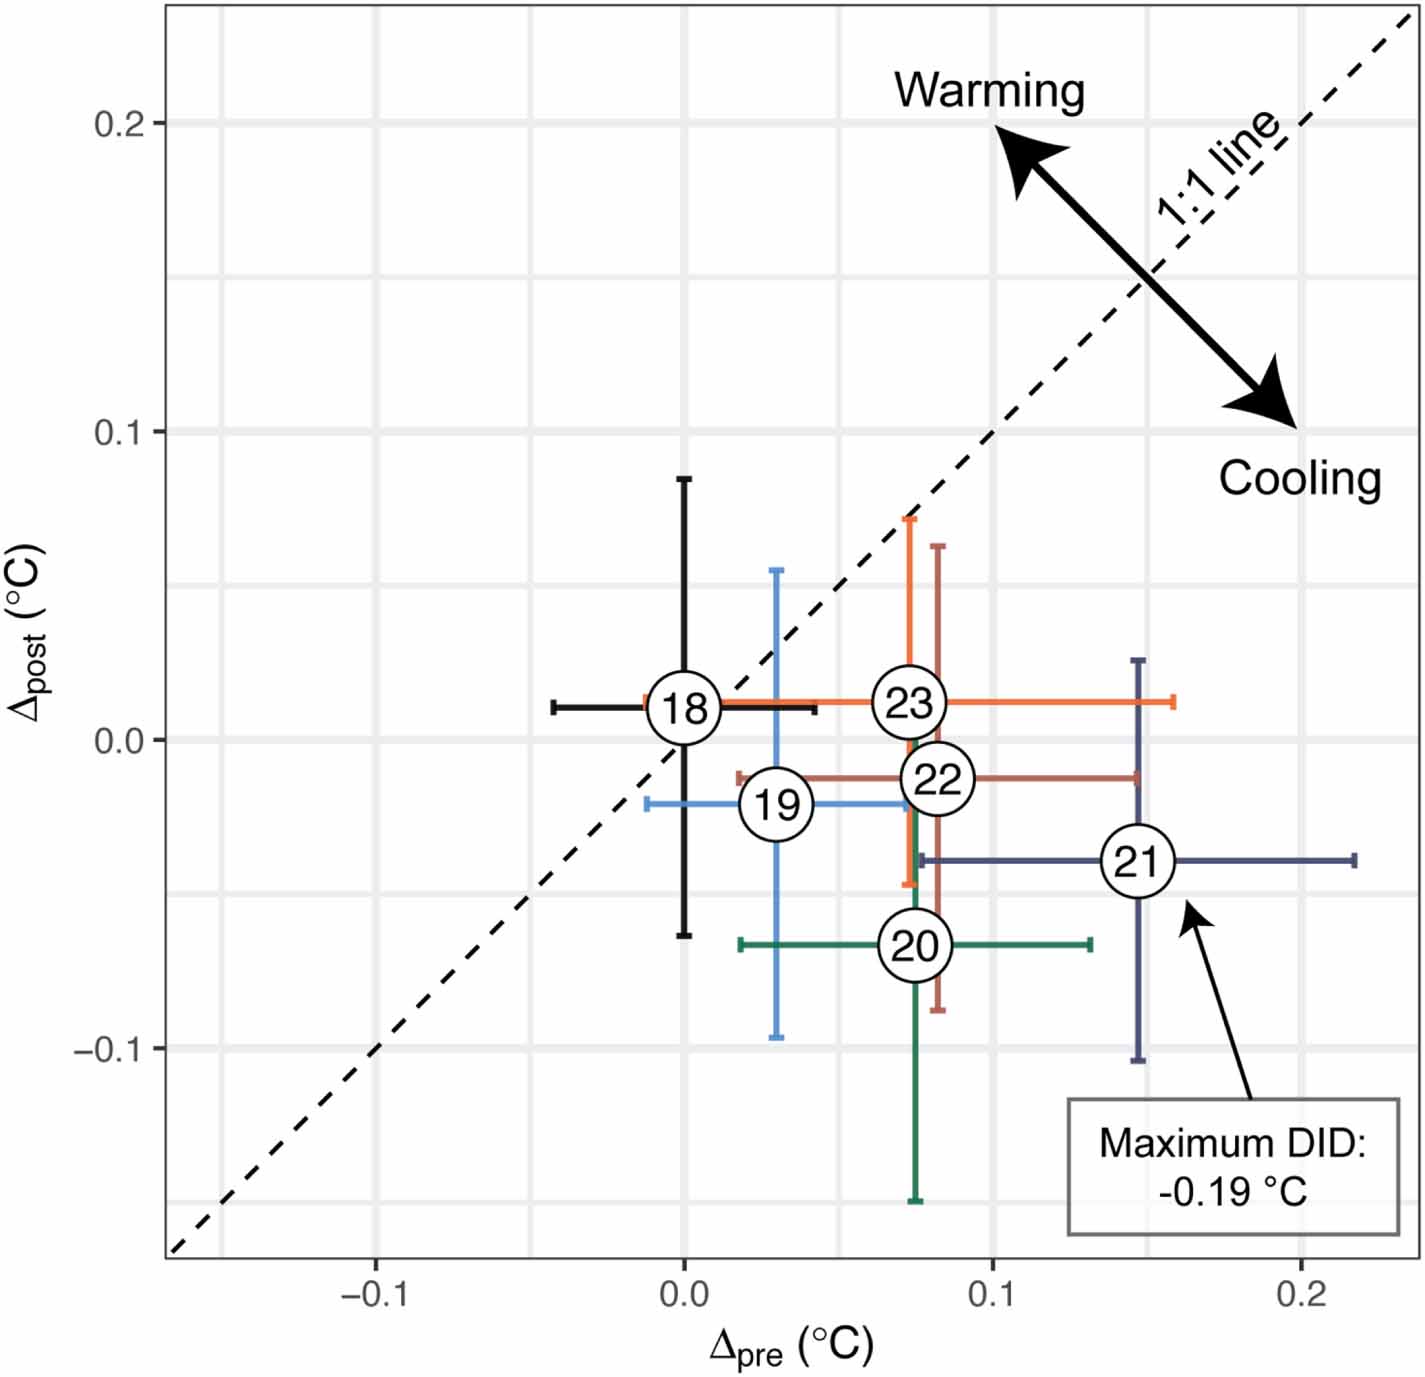
From our mobile transect measurements, we found that cool pavements reduced 1.6 m Tair by a mean ± 95% confidence interval of 0.20 ± 0.06 °C at 12:00 LST. A statistically distinguishable DID signal was only obtainable for 12:00 LST due to high micrometeorological variability and the small Tair reduction signal expected from the scale of the cool pavement installation in this study. Note that the absence of statistically significant results for other hours of the day does not preclude cool pavements from having caused changes in 1.6 m Tair at those other hours. For these null hours, the noise due to micrometeorological variability within the timeframe of the mobile transect made it difficult to distinguish the magnitude of the Tair signal. Further details regarding these complications and the statistical procedures can be found in the supplement.
Our stationary and mobile Tair measurements imply that cool pavements can reduce near-surface Tair during the daytime, as well as during the evening. We were unable to identify a definitive diurnal pattern of near-surface Tair reduction. However, we can conclude that the neighborhood-scale cool pavement installation investigated here can reduce near-surface Tair by 0.20 °C around noon, and at least 0.19 °C in the late evening, within the context of the local meteorology and land surface features specific to our field site.
This is the first study to report statistically significant Tair reductions caused by cool pavement installations, using a controlled experimental technique to account for confounding variables. Middel et al [22] reported maximum Tair reductions of ∼0.4 °C–0.5 °C, but pre-installation measurements were not taken as part of that study, which means that confounding variables could not be fully accounted for. We find that our results are consistent (i.e. on the same order of magnitude) with past modeling studies. Taleghani et al [33] used CFD modeling to investigate impacts of cool pavements at neighborhood scale and found that increasing pavement albedo by 0.3 could lead to a neighborhood-averaged reduction in Tair of ∼0.26 °C. Taha [31, 87] used mesoscale modeling to estimate Tair reductions of approximately 0.25 °C–0.5 °C in LA for moderate (0.15) to high (0.25) increases in pavement albedo for a city-scale installation. Mohegh et al [24] also used mesoscale modeling to investigate cool pavement impacts and found that increasing pavement albedo by 0.4 in California cities could reduce Tair by ∼0.18 °C–0.86 °C. Millstein and Levinson [88] used an idealized heat transfer model of air flowing over a 200 m hot plate and estimated a ∼0.15 °C reduction in 1.5 m Tair when albedo was increased by 0.3. This is similar to the maximum reduction of ∼0.20 °C we observed, considering that the maximum east-west street length in our impact area was ∼650 m. Table 2 places our results in the context of these studies by summarizing the abovementioned Tair reductions per 0.1 increase in pavement albedo. Although our results may be specific to neighborhood characteristics and local meteorology of our field site, this study can serve as an important point of reference for hot and dry regions like LA.
Table 2. Comparison of reported Tair reductions per 0.1 increase in albedo from previous modeling studies.
| Study | Spatial scale | Tair reduction per 0.1 increase in albedo (°C) | Tair height (m) |
|---|---|---|---|
| This study | Neighborhood-scale | 0.11, 0.10 | 1.6, 3 |
| Taleghani et al [33] | Neighborhood-scale | 0.09 | 1.5 |
| Taha [31, 87] | City-scale | 0.17–0.2 | 2 |
| Mohegh et al [24] | City-scale | 0.05–0.22 | 2 |
| Millstein and Levinson, [88] | Hypothetical hotplate (∼200 m) | 0.05 | 2 |
a 0.10 corresponds to a 3 m height (stationary) while 0.11 corresponds to a 1.6 m height (mobile). Note that in this study, stationary measurements were taken at a 3 m height, while previous modeling studies typically present 1.5 or 2 m air temperature. It is possible that reductions at 1.5 or 2 m would be greater than observed 3 m reductions. Comparisons between studies must be taken with precaution since air temperature within the canopy boundary layer can be sensitive to small changes in height. This table is only intended to give a broad overview of comparative values rather than a strict comparison.
3.4. Implications on pedestrian thermal comfort
Although we do not report pedestrian thermal comfort measurements here in this study, we find it important to discuss the implications of cool pavements on thermal comfort. The cool pavement penalty of increased upwelling shortwave radiation has been noted in previous studies [22, 32, 70, 89, 90], yet the nuances of cool pavement tradeoffs are often overlooked by the public, potentially leading to the misconception that cool pavements can serve as a 'policy panacea' for urban heat mitigation [22]. Here we briefly review the main tradeoffs related to cool pavements' impact on thermal comfort in the context of our results.
The main concern with cool pavements is that the increased reflection of shortwave radiation at the ground level can decrease pedestrian thermal comfort significantly during daylight hours. Most notably, Middel et al [22] reported that cool pavements increased the shortwave radiation load for pedestrians standing directly over the pavement by up to 168 W m−2. This corresponded to an observed mean radiant temperature (TMRT) increase of 4 °C.
Although this observed increase in daytime TMRT is certainly a cause for concern, we suggest that an increased radiant load directly over the pavement does not fully account for the complexities that impact outdoor thermal comfort. Controlling for variability of biometeorological factors, such as evaporative cooling rates, effects of clothing, and metabolic rates; there are only two ways that cool pavements can directly impact thermal comfort: (a) radiative heat transfer, or (b) convective heat transfer. For radiative heat transfer, cool pavements will increase shortwave radiative load on nearby pedestrians, but longwave radiative loads will be decreased due to lower pavement Tsurface. For convective heat transfer, cool pavements can lower near-surface Tair, which would tend to make the pedestrian more comfortable in hot weather, all else being equal.
Based on previous measurements [91, 92], the radiative heat transfer coefficient (hr) and the convective heat transfer coefficients (hc) for the human body are approximately the same magnitude at low wind speeds (<1 m s−1). This implies that an increase in radiative heat transfer due to a unit increase in TMRT is similar in magnitude to an increase in convective heat transfer due to a unit increase in Tair. As a hypothetical example, if TMRT increased by 4 °C (as observed by Middel et al [22] directly over cool pavement), but Tair was also reduced by 4 °C, the thermal comfort change should be negligible under low wind speeds.
The influence of wind speed further complicates the radiation-convection tradeoff. For illustration, the average wind speed at 12:00 LST recorded at LA International Airport during the summer is ∼3 m s−1 [93]. According to de Dear et al [92], hc/hr is ∼4 when the wind speed is 3 m s−1. In this case, if TMRT increased by 4 °C, a simultaneous reduction in Tair of ∼1 °C would compensate for the increased radiative load. The reduction in Tair of 0.20 °C at 12:00 LST observed in our study is not sufficiently large to compensate for a TMRT increase of 4 °C. However, this balance would change if Tair reductions exceed 1 °C. Based on a number of modeling studies [24, 32, 54], it is generally expected that larger spatial extents of cool pavement deployment would lead to larger reductions in Tair. While Tair reductions are expected to be strongly dependent on the spatial extent, the radiant load effect from increased shortwave radiation is not.
There is also considerable uncertainty regarding the effect of reflected shortwave radiation on pedestrians on the sidewalks, where most foot traffic is expected. It is well-known that the albedo of concrete sidewalks is already higher than that of asphalt pavement, with concrete albedo values generally exceeding 0.2 [30, 61, 94, 95]. Furthermore, the geometry and composition of the 'buffer zones' between sidewalks and roads vary considerably. Some sidewalks may have no buffer, while others may have vegetation distancing the sidewalks substantially from the road, or even parked vehicles or shrubs that block reflected shortwave radiation from the pavement. Although it is clear that the daytime radiative load would increase substantially for a pedestrian standing directly over the cool pavement, it is less clear how thermal comfort would be impacted for pedestrians on sidewalks. Middel et al [22] reported TMRT on sidewalks versus on cool pavement, and also reported an additional 20–30 W m−2 of reflected shortwave radiation on the sidewalks during the early evening. However, it is still uncertain how cool pavements impact thermal comfort for pedestrians on sidewalks in a range of real-world configurations.
Lastly, the potential tradeoffs between nighttime decreases in Tair and daytime increases in TMRT need to be critically examined. There is growing evidence that nighttime temperatures are increasing faster than daytime temperatures, and there is increasing concern about resulting public health impacts [96–99]. Although cool pavements may decrease nighttime temperatures, it remains uncertain whether the potential benefits of nighttime temperature reductions outweigh the consequences of potentially decreasing daytime outdoor thermal comfort.
We suggest that the various tradeoffs (i.e. benefits and penalties) of cool pavements with respect to thermal comfort need to be quantified more explicitly in future research. A large portion of the uncertainty can be attributed to the wide variety of hyper-local features (e.g. sidewalk buffer characteristics, meteorology, vegetation) and the general lack of controlled real-world field measurements. This study confirms that cool pavement can generally reduce Tair, but it remains an open question whether cool pavements can play a viable role in increasing net human health and wellbeing, and just as importantly, in what context.
4. Conclusion
This study reports on field measurements of the largest real-world installation of cool pavements to date in California. Measurements were used to investigate the direct impacts of cool pavement installation on Tsurface and Tair. Albedo was also monitored to evaluate changes over the time span of a year.
The mean pavement albedo of the impact site increased significantly after installation of cool pavement, from 0.08 to 0.26. This initial increase in albedo caused average Tsurface reductions ranging from 0.9 to 5 °C, with maximum reductions observed at 15:00 LST. Mobile measurements showed that cool pavements reduced 1.6 m Tair by 0.20 °C at 12:00 LST. Stationary measurements showed that cool pavement installation induced a reduction in 3 m Tair between 19:00 and 23:59 LST, though only reductions for the hours of 20:00, 21:00, and 22:00 were statistically distinguishable from zero at a 95% confidence level. A maximum evening 3 m Tair reduction of 0.19 °C occurred at 21:00 LST. Our measurements suggest that neighborhood-scale cool pavement installations can lead to a statistically significant reduction in Tair, both during daytime and in the evening.
After a year of real-world exposure, cool pavement albedo decreased to 0.18, which corresponded to a degradation of 30%. We found that albedo degradation was dependent on the type of cool pavement product used, as well as tire wear, which led to more rapid degradation at curved road sections, cul-de-sacs, and intersections. Albedo degradation was also found to have a significant effect on Tsurface. An albedo degradation of 0.08 after approximately one year of real-world weathering corresponded to a lower cooling efficacy for Tsurface by ∼1 °C.
Future research should aim to reduce uncertainties associated with the impact of cool pavements on pedestrian thermal comfort. Reducing such uncertainties will help policy makers and urban planners make decisions about when and where to install cool pavements based on a nuanced understanding of their benefits and penalties.
Acknowledgments
This research has been funded by the National Science Foundation under CAREER Grant CBET-1752522. The authors would like to thank Christopher Sheppard, Clarence Su, Van Truong, Yonah Halpern, and the LADPW in general for coordinating the cool pavement pilot installation and for their technical and administrative support throughout this study.
Data availability statement
The data collected from field measurements during this study can be accessed using the following DOI links:
- 'Mobile Transects Data', 10.7910/DVN/VDKR2P [100]
- 'Mobile Albedo Data', 10.7910/DVN/PMCBK4 [101]
- 'All Albedo Data (including stationary)', 10.7910/DVN/O0SNGG [102]
- 'Stationary Air Temperature Data', 10.7910/DVN/54RL5K [103]
Processed data used to create the figures, or code used to process the raw data may be available upon reasonable request to the corresponding author.
The data that support the findings of this study are openly available at the following URL/DOI: https://dataverse.harvard.edu/dataverse/covina_cool_pavement.