

Abstract
Urban heat islands (UHIs) are a widely studied phenomenon, while research on urban-rural differences in humidity, the so called urban dry or moisture islands (UDIs, UMIs), is less common and a large-scale quantification of the seasonal and diurnal patterns of the UDI is still lacking. However, quantification of the UDI/UMI effect is essential to understand the impacts of humidity on outdoor thermal comfort, building energy consumption, and urban ecology in cities worldwide. Here, we use a set of globally distributed air temperature and humidity measurements (1089 stations) to quantify diurnal and seasonal patterns of UHI and UDI resulting from rapid urbanization over many regions of the world. The terms 'absolute UDI' and 'relative UDI' are defined, which quantify urban–rural differences in actual and relative humidity metrics, respectively.
Results show that absolute UDI is largest during daytime with the peak humidity decrease in urban areas occurring during late afternoon hours. In contrast, relative UDI is largest during night and the peak urban relative humidity (RH) decrease and vapor pressure deficit (VPD) increase occurs in the late evening hours with values of around −10% to −11% for RH and 2.9–3.6 hPa for VPD between 20–00 local time during summer. Relative and absolute UDIs are largest during the warm season, except for daytime RH UDI, which does not show any seasonal pattern. In agreement with literature, canopy air UHI is shown to be a nighttime phenomenon, which is larger during summer than winter. Relative UDI is predominantly caused by changes in actual humidity during day and UHI during nighttime.
Export citation and abstract BibTeX RIS

Original content from this work may be used under the terms of the Creative Commons Attribution 4.0 license. Any further distribution of this work must maintain attribution to the author(s) and the title of the work, journal citation and DOI.
1. Introduction
Cities are growing in size and 60% of the world's population is projected to live in urban areas by 2030 (United Nations 2018). At the same time, cities have been found to exhibit distinct climate features with alterations of temperature and humidity causing urban heat or cool islands (UHIs or UCIs) and urban dry or moisture islands (UDIs or UMIs) (Zhao et al 2014, Lokoshchenko 2017, Luo and Lau 2019, Manoli et al 2019, Li et al 2020, Du et al 2022).
These changes in local climate caused by urbanization can potentially impact human well-being and health (Wang and Gong 2010, Mora et al 2017, Tuholske et al 2021), as changes in temperature and humidity both affect human outdoor thermal comfort (OTC). For example, rural irrigation has been shown to increase moist heat stress extremes in India (Mishra et al 2020), while a decrease in humidity in Beijing could partially offset the anticipated increase in heat stress caused by higher temperatures (Wang and Gong 2010). Changes in humidity also affect plant stomatal response and evapotranspiration, which could impact urban ecology (Chen et al 2011, Novick et al 2016, Gillner et al 2017). Furthermore, temperature and humidity influence the energy consumption for building cooling and heating (Santamouris 2014, Fonseca and Schlueter 2020, Maia-Silva et al 2020). For example, Fonseca and Schlueter (2020) predict an increase in energy usage for building cooling in hot and humid cities due to higher needs for dehumidification, which indicates not just the role of temperature but also humidity differences on the energy consumption of cities (Maia-Silva et al 2020).
While there is a wealth of literature focusing on UHI (e.g. Oke et al 2017, Venter et al 2021), especially from the surface temperature perspective (Peng et al 2011, Zhou et al 2013, Li et al 2016, Wang et al 2016, Ward et al 2016, Manoli et al 2019, 2020, Paschalis et al 2021), studies analyzing humidity changes in cities are scarce. Available studies on urban humidity focus on single cities (e.g. Hage 1975, Ackerman 1987, Fortuniak et al 2006, Cuadrat et al 2015, Lokoshchenko 2017, Yang et al 2017, Wang et al 2021) or specific urbanized regions (Hao et al 2018, Luo and Lau 2019). A comprehensive analysis of the causes for the formation of UDIs and UMIs, as well as their diurnal and seasonal patterns globally is still lacking.
Studies also vary in the analyzed and reported humidity metrics, which further limits the potential for comparison and leads to large differences in the reported urban humidity effects. For example, several studies report lower humidity in cities and hence, a UDI (e.g. Tapper 1990, Moriwaki et al 2013, Cuadrat et al 2015, Yang et al 2017, Hao et al 2018, Luo and Lau 2019), while other authors report a higher air moisture in cities and argue for the presence of a UMI (e.g. Ackerman 1987, Tapper 1990, Lee 1991, Wang et al 2021). These contrasts could be caused by urban specific differences, anthropogenic water sources (e.g. Huang et al 2021), absent or delayed dewfall due to higher temperatures and different surface materials (e.g. Kuttler et al 2007), or regional moisture transport (e.g. Du et al 2022). However, they are likely also due to differences in the analyzed humidity metrics and their variability on seasonal and diurnal timescales.
Humidity in the air can be assessed with metrics specifying the actual water content in the air, such as absolute water vapor density (g m3), specific humidity (q, g kg−1), and vapor pressure (e, hPa), or with metrics specifying the relative humidity level in the air in relation to its saturation point at a given temperature (e.g. saturated vapor pressure, esat), such as relative humidity (RH ≈ 100 × e/esat, %) or vapor pressure deficit (VPD = esat − e, hPa) (e.g. Shuttleworth 2012). Values of relative humidity metrics (RH, VPD) can change due to a difference in temperature alone without any change in the amount of water vapor in the air. For example as warmer air can hold more moisture, esat and consequently VPD increase (e.g. Shuttleworth 2012). On the other hand, higher air temperatures (Tair) can also lead to an increase in actual humidity (i.e. q and e) if there are no limitations to the moisture supply and its transport from the land surface to the air or through advection from adjacent regions (e.g. Du et al 2022). However, during urban development, vegetated and pervious areas are often converted to impervious surfaces, which can strongly limit water supply from the land to the atmosphere due to suppression of evapotranspiration. Therefore, changes in humidity in cities, observed as UDI or UMI, can be caused by a change in Tair and/or a change in the actual humidity. This has already been shown in some studies attributing the observed UDI or UMI to changes in Tair (e.g. Lokoshchenko 2017) or evapotranspiration (e.g. Hao et al 2018). However, a general analysis of the relative contribution of changes in temperature (i.e. UHI) and moisture content to the formation of UDI and UMI throughout the diurnal and seasonal cycles is still lacking. A clearer distinction between UDI and UMI based on actual or relative humidity metrics is needed to synthesize and generalize urbanization effects on atmospheric humidity.
Availability of measurements with high spatial coverage across a city and its surroundings (e.g. Warren et al 2016), which is commonly used to quantify UHI, is scarce and limits large-scale studies of near ground (often referred to as canopy) UHI and UDI across different cities and climates. To overcome this limitation, recent studies have employed crowd-sourced meteorological measurements to quantify the UHI effect across multiple cities (Venter et al 2021), but such attempts are still rare. Here, we take an alternative approach, proposing a space for time substitution, and leverage the fact that many regions of the world experienced urbanization in the last few decades, likely increasing their UHI and UDI. Hence, we correlate urbanization rate with trends in Tair and humidity (q, e, RH, VPD) using a large number (1089) of globally distributed meteorological stations (Smith et al 2011, Dunn et al 2012, 2016, Dunn 2019), out of which 590 experience urbanization in their surroundings larger than 1% per decade. The proposed methodology also separates UHI and UDI from climate change effects. We quantify the seasonal and diurnal patterns of UHI, and 'relative' and 'absolute' UDI to distinguish between humidity differences in cities quantified by actual and relative humidity metrics. We further partition and attribute relative UDI magnitudes, measured in VPD, to changes in temperature and actual moisture distinguishing seasons and hours of the day.
Specifically, we answer the following research questions: What is the typical average diurnal and seasonal pattern of UDIs at the global scale and are there differences for relative and absolute UDI? To what extent is relative UDI caused by changes in temperature and to what extent by changes in actual moisture in the air? We finally discuss the potential impacts of urban humidity changes on OTC, building energy usage, and urban ecology.
2. Methods
2.1. Meteorological observation data of humidity and air temperature
This study uses sub-daily meteorological observations of air and dew point temperature (Tair, Tdew) from HadISD version 3.1.1.2020f (Smith et al 2011, Dunn et al 2012, 2016, Dunn 2019). The HadISD data set is a subset of the Integrated Surface Database of the National Oceanic and Atmospheric Administration's (NOAA) National Climatic Data Center (Smith et al 2011, Moustakis et al 2020, 2021) and is synthesized by the Met Office Hadley Centre through the application of additional data quality processes and criteria on data availability. Relative humidity (RH), specific humidity (q), vapor pressure (e), and vapor pressure deficit (VPD) are calculated as a function of Tair and Tdew (SI table 1 available online at stacks.iop.org/ERL/17/054044/mmedia).
The raw data set contains 8258 stations with at least partial data coverage during the analyzed time period of 1 January 1990 to 31 December 2018 (29 years). The raw meteorological time series of the HadISD data set are not formally homogenized. However, a homogeneity assessment, including the time and magnitude of break points for affected stations, is available and provided by Dunn et al (2014). The final set of stations used in this study is selected based on low inhomogeneity magnitudes of breakpoints as well as continuous data availability to compute the diurnal and seasonal cycles. The station selection criteria and data processing are outlined in detail in the supplementary information together with a methodological workflow figure (SI section 1, SI figure 1). The final data set comprises a total of 1089 stations with most of the stations located in the northern mid-latitudes (figure 1). For the further analysis, average diurnal cycles of Tair and humidity variables (q, e, RH, VPD) are calculated for each month in each year for each station. In the following, we will refer to this as YMH_Si data average (SI figure 1).
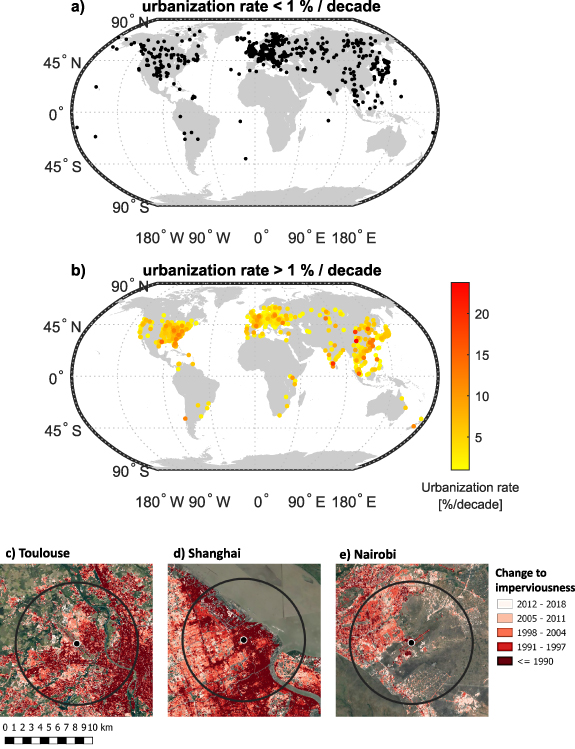
Figure 1. Location of meteorological stations: (a) stations with less than 1% increase in artificial impervious landcover per decade and (b) urbanizing locations with more than 1% increase in artificial impervious landcover per decade within a radius of 7 km. (c)–(e) Impervious land cover change over time within a radius of 7 km (black circle) from meteorological stations (black point) in the urban area of Toulouse in France, Shanghai in China, and Nairobi in Kenya as examples of the extracted impervious landcover change.
Download figure:
Standard image High-resolution image2.2. Background climate data from the ERA 5 reanalysis product
Urbanization and climatic trends have co-occurred in the last decades, and both are not evenly distributed over the globe. The correlation of urbanization rate with change in temperature and humidity as done in our study (see section 2.4) could lead to a result, which is not caused by the process of urbanization itself but purely by an artifact of certain climatic trends occurring (or not) in regions experiencing urbanization. Therefore, we use the ERA5 reanalysis product (Hersbach et al 2020), which was bias corrected and aggregated to 0.5° resolution by Cucchi et al (2020) to check for such a co-linearity between trends in background climate and urbanization rate. The land surface scheme used to develop the ERA5 product does not currently include urbanization effects (Balsamo et al 2009, Hogan et al 2017, Bassett et al 2021, Venter et al 2021) and it has been successfully used in previous studies to represent the rural baseline climate (e.g. Bassett et al 2021, Venter et al 2021). The hourly ERA5 data was aggregated identically to the YMH_Si data averages, which includes the calculation of the average diurnal cycle of the meteorological variables for each station for each month in each year.
2.3. Impervious area and urbanization rate
We extract the percentage of artificial impervious area within a buffer radius of 7 km from each selected meteorological station from an annual data set of global artificial impervious areas (GAIAs) at 30 m resolution (Gong et al 2020, downloaded from http://data.ess.tsinghua.edu.cn, 22 March 2021). The GAIA data set is based on 30 m resolution Landsat images and spans the years 1985–2018. The early years of the data set contain larger uncertainties due to limited data availability (Gong et al 2020). Hence, only the years 1990–2018 (29 years) are used in this study. To determine the appropriate size of the extraction radius, the urbanization rate Δimp around each meteorological station was first calculated with different buffer radii ranging from 1 to 30 km and their correlation with the trends in air temperature and humidity was analyzed for day and nighttime separately during the summer months (June, July, August). The correlation coefficients tend to stabilize between an extraction radius of 6–9 km (SI figure 2) and any of these radii are an acceptable choice for this study. A radius of 7 km was finally chosen for the impervious landcover extraction, which also corresponds to the value used by Luo and Lau (2019). Note that the results presented here were also derived with other extraction radii to confirm that the diurnal and seasonal patterns shown in this study are independent of the exact extraction radius for radii ranging from 2 to 9 km. The magnitude of the calculated UHI and UDI is, however, dependent on the chosen extraction radius as urbanization rates Δimp tend to decrease with increasing analyzed area and thus radius (SI figure 3). Diurnal and seasonal patterns of UHI and UDI calculated for a 4 km and 9 km buffer radius are shown in the supplementary information for comparison (SI figures 4–7). The urbanization rate Δimp (fraction/decade) is calculated as the linear trend of impervious landcover within the chosen buffer radius from each station over the 29 analyzed years (1990–2018) (Luo and Lau 2019). The majority of the urbanizing stations show a fairly linear urbanization trend (SI figure 8). Of the 1089 stations, 590 experience an artificial impervious land conversion rate larger than 1% per decade within the 7 km buffer radius while 499 experience no or negligible urbanization. Spatial distribution of non-urbanizing and urbanizing stations, including their urbanization rates, is shown in figure 1. Note, that some stations with a small urbanization rate can still be surrounded by urban areas, which developed before 1990. However, there is only a small number of stations for which this is the case. There are seven stations with an artificial impervious land cover of more than 10% in 1990 and an urbanization rate of less than 1% per decade.
2.4. UDI and UHI calculation
UDI and UHI are traditionally calculated as the difference of humidity and temperature measured within an urban area and at a rural reference station (Oke et al 2017) and measurements need to be obtained simultaneously in multiple locations within and around a city. However, such simultaneous meteorological measurements within cities and their rural surroundings are limited to a few sites with dense meteorological networks or dedicated measurement campaigns but are lacking at the global scale. In this study, we take an alternative approach to overcome this limitation by focusing on temporal differences in landcover as proposed by Luo and Lau (2019). During the process of urbanization, natural landcover is replaced by urban infrastructure leading to the development of UDI and UHI over time. Meteorological measurements at fixed locations experiencing urbanization in their surroundings are likely measuring trends in temperature and humidity, which differ from trends at rural and non-urbanizing stations nearby and are associated with this landcover change. Following this reasoning, we correlate trends in humidity and temperature measured at the 1089 HadISD stations with their urbanization rates (Δimp) over the analyzed 29 year time period to obtain magnitudes of UDI and UHI (figure 2). Trends in humidity (ΔRH, ΔVPD, Δe, Δq) and air temperature (ΔTair) are calculated for each station, urbanizing and non-urbanizing, as the linear trend over the 29 year time period (1990–2018). Climatic trends derived for rural HadISD stations are likely associated to climate change, while climatic trends in urbanizing areas include both climate change as well as urbanization effects in the HadISD data set. Monthly ERA5 trends for each station are subtracted from the monthly HadISD trends. By means of this correction, we remove any climate change signal and any trends resulting from a co-linearity between background climate trends and urbanization rate, and we focus only on urbanization effects as further explained in the supplementary information (SI section 2, SI figures 1, 9–13).

Figure 2. Changes in mean annual air temperature (ΔTair) and humidity metrics (Δq, ΔRH, ΔVPD) with increase in artificial impervious land cover (Δimp) within a 7 km radius from each station. The slope of the fitted linear regression (red dotted line and displayed equation) quantifies the change in Tair, q, RH, and VPD associated with an artificial impervious land cover increase from 0% to 100%. We refer to this as the UHI and UDI magnitude in the following. p indicates the p-value of the correlation and is used to assess the statistical significance.
Download figure:
Standard image High-resolution imageMagnitudes of UDI and UHI and climate change effects can be derived from the slope and intercept parameters of the linear regression between urbanization rate (Δimp) and climate trends (ΔRH, ΔVPD, Δe, Δq, ΔTair) as shown here for the example of Tair: ΔTair = Surb × Δimp + CC. The slope Surb is the UHI magnitude, which is expected to develop if a location experiences complete urbanization starting from rural conditions (i.e. an increase from 0% to 100% of artificial impervious areas within a radius of 7 km from the station). The linear regression in figure 2 shows an intercept (CC) close to 0 as the average climate change effects are removed with the ERA5 correction. Statistical significance of UDI and UHI magnitudes are determined by means of a two-sided t-test at the 5% significance level (i.e. p < 0.05 indicating a slope Surb different than zero).
UDI and UHI magnitudes shown in figures 3–5 correspond to the slope of the linear regression for each season and hour of the day. Winter comprises the months December to February (June to August), spring the months March to May (September to November), summer the months June to August (December to February), and autumn the months September to November (March to May) for the northern (southern) hemisphere. Daytime includes the hours from 7 to 18 local time (LT) and nighttime the hours 19–6 LT. As most of the stations are located in the northern hemisphere, figures 3–5 display the northern hemisphere months of the seasonal UDI and UHI effects. However, the southern hemisphere stations are also included in the displayed results in figures 3–5 with the appropriate correction (i.e. the southern hemisphere month January is included in the results for the northern hemisphere month July and so forth).

Figure 3. Average diurnal patterns of UHI and UDI computed with all stations: (a) Tair, (b) q, (c) RH, and (d) VPD for summer and winter months. UHI and UDI magnitudes are the expected change in air temperature and humidity variables with a full landcover conversion from natural to 100% artificial impervious surfaces within a radius of 7 km of the meteorological stations. The points indicate statistically significant UHI and UDI magnitudes with a p-value smaller than 0.05. Positive UHIT air denotes higher air temperature in cities compared with their rural surroundings. Negative UDIq , negative UDIRH, and positive UDIVPD denote lower humidity in cities compared with their rural surroundings.
Download figure:
Standard image High-resolution imageTo analyze differences in UDI according to the aridity level of the background climate, we split the dataset into stations with wetness index WI < 1 and WI > 1, corresponding to climates, in which evapotranspiration is water or energy limited, respectively. The WI is calculated as the ratio between mean annual precipitation and mean annual potential evapotranspiration (WI = P/PET) and the corresponding data is extracted from the Climatic Research Unit gridded Time Series (CRUTS4.05) data set (Harris et al 2020).
Note that positive UHI values denote higher Tair in urban areas compared to natural land surfaces. Less humidity in cities is shown by negative UDIq , negative UDIe , negative UDIRH, and positive UDIVPD. For the following discussion, we introduce the terms 'absolute UDI' and 'relative UDI'. Absolute UDI includes UDIq and UDIe , which specify the change in actual water content in the air. Relative UDI comprises UDIRH and UDIVPD.
2.5. Attribution of UDI effects to changes in temperature and changes in vapor supply
Observed changes in humidity in cities can be attributed to changes in Tair caused by UHI and changes in humidity supply because of the increase in artificial impervious area, leading to reduced water availability for evapotranspiration. To separate these two causes, we partition the measured UDIVPD (δVPD/δimp) into changes associated to an increase in esat caused by the UHI (desat/dTair × δTair/δimp) and to a change in e (δe/δimp):

where d and δ denote path-independent (exact) and path-dependent (inexact) differential operators. esat is calculated as a function of Tair according to SI table 1.
3. Results
3.1. Annual average UDI and UHI
We find a statistically significant UDI at the annual scale for both absolute and relative humidity measures. Annual average RH decreases by 4.8%, VPD increases by 1.22 hPa, e decreases by 0.78 hPa, and q decreases by 0.5 g kg−1 at a full replacement of natural landcover by artificial impervious areas within a radius of 7 km from the meteorological stations (figure 2, SI figure 14). The changes in annual average Tair due to the increase in impervious area from 0% to 100% is +0.23 °C and not statistically significant with a p-value of 0.094 (t-test for zero slope, figure 2), indicating that the UHI effect is not apparent on the annual average based on the current data set and methodology. Note, that while a UHI magnitude of +0.23 °C at a full replacement of natural landcover seems small, this number represents the annual average UHI, including all weather conditions, hours of the day and seasons. At the diurnal and seasonal scale, larger UHI intensities are found (see section 3.2) with magnitudes similar to the ones reported by other large scale studies (e.g. Venter et al 2021).
3.2. Diurnal and seasonal patterns of UDI and UHI
While there is no statistically significant UHI detected at the annual scale at a significance level of 0.05 (section 3.1), we recover the typical diurnal pattern of UHI, with higher Tair at night and negligible UHI during daytime (Oke et al 2017, Venter et al 2021). The nighttime UHI is largest during the warm period of the year with a magnitude of 0.5 °C to 1.4 °C from April to September (October to March) in the northern (southern) hemisphere and negligible during winter. The same seasonal pattern is also observed in large scale studies quantifying surface UHI throughout the year (Zhou et al 2013, Manoli et al 2020, Paschalis et al 2021). The UHI effect is not detected during daytime throughout the year (figures 3 and 4).
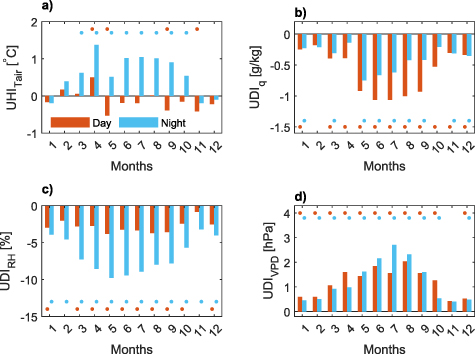
Figure 4. Average seasonal patterns of UHI and UDI computed with all stations: (a) Tair, (b) q, (c) RH, and (d) VPD for day- and nighttime. UHI and UDI magnitudes are the expected change in air temperature and humidity variables with a full landcover conversion from natural to 100% artificial impervious surfaces within a radius of 7 km of the meteorological stations. The points indicate statistically significant UHI and UDI magnitudes with a p-value smaller than 0.05. Positive UHIT air denotes higher air temperature in cities compared with their rural surroundings. Negative UDIq , negative UDIRH, and positive UDIVPD denote lower humidity in cities compared with their rural surroundings.
Download figure:
Standard image High-resolution imageThe absolute UDI is largest during the warm period (from May to September and November to March in the northern and southern hemisphere, respectively) ranging from −0.9 to −1.1 g kg−1 and −1.4 to −1.7 hPa during day and −0.4 to −0.75 g kg−1 and −0.6 to −1.2 hPa during nighttime for UDIq and UDIe, respectively. Statistically significant UDIq and UDIe are also detected during some winter months but with a smaller magnitude (figures 3 and 4). Absolute UDI is largest during the daytime and in the early evening hours reaching a peak of −1.4 g kg−1 and −2.1 to −2.2 hPa from 17 to 19 h LT in summer for UDIq and UDIe , respectively. Absolute UDI is minimal from midnight to the early morning hours or even noon, depending on the season (figures 3 and 4, SI figure 15).
In contrast, relative UDI magnitudes are larger during night compared to daytime. Peak values range from −10% to −11% and 2.9 to 3.6 hPa between 20–00 LT during summer for UDIRH and UDIVPD, respectively. Diurnal differences of relative UDI magnitudes are larger for UDIRH than for UDIVPD. UDIVPD is largest during the warm season ranging from 1.4 to 2 hPa and 1.6 to 2.7 hPa during May to September for day and nighttime, respectively. Similarly, nighttime UDIRH shows a distinct seasonal cycle with larger nighttime UDIRH values during the warm period (−8% to −10% from May to September). Daytime UDIRH is smaller and does not show a distinct seasonal pattern.
In summary, absolute UDI is largest during the warm season and daytime with a peak in the late afternoon and early evening hours. Relative UDI is largest during the warm season and at nighttime with a peak in the late evening hours. Diurnal differences are more distinct for UDIRH than for UDIVPD and daytime UDIRH does not show a strong seasonal dependence.
The separation of stations using WI < 1 and WI > 1 showed a larger absolute and relative UDI for wet climates during summer and daytime (SI figure 16). However, the results are dependent on the selected WI cut-off point (section 2.4). Hence, the here reported differences of UDI with WI are deemed not robust and require larger datasets to be fully analyzed.
3.3. Attribution of UDIVPD effects to changes in Tair and changes in e
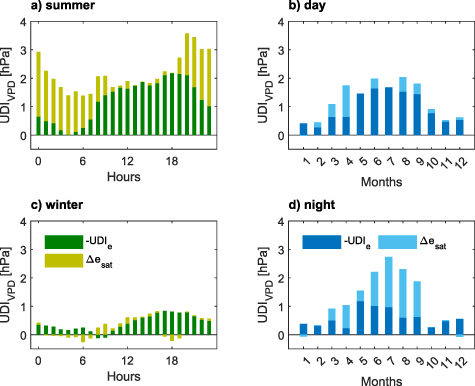
Relative UDI, here shown using UDIVPD, are partly caused by UDIe and UHI, which leads to an increase in esat. Partitioning of UDIVPD shows that both, UHI and UDIe , have a substantial contribution to the overall UDIVPD during the warm season. Following the diurnal patterns of UHI and UDIe , UDIVPD is largely caused by UDIe during daytime and by UHI from midnight to the early morning hours during summer (figure 5(a)). During the late evening hours in summer, UDIVPD is caused by both UHI and UDIe in roughly equal magnitude leading to peak values of UDIVPD during this time. Due to the absence of a significant UHI, wintertime UDIVPD is almost only caused by UDIe and is much smaller in magnitude (figure 5(c)).
Figure 5. Partitioning of diurnal and seasonal patterns of UDIVPD into changes associated to an increase in esat caused by UHI (Δesat is calculated as a function of ΔTair) and to a change in e (UDIe ) for (a) summer, (b) daytime, (c) winter, and (d) nighttime. Positive UDIVPD denotes lower humidity in cities compared to their rural surroundings. Note, that −UDIe is displayed in this graph instead of UDIe as negative values of UDIe denote lower humidity in cities compared with their rural surroundings.
Download figure:
Standard image High-resolution image
4. Discussion
4.1. Reconciliation of UDI differences in literature through the separation of absolute and relative UDI
Current UDI literature, based on the analysis of single cities (e.g. Cuadrat et al 2015, Lokoshchenko 2017, Yang et al 2017) or urbanized regions (e.g. Hao et al 2018, Luo and Lau 2019), reported diverging findings, ranging from a drier urban environment, i.e. UDI (e.g. Moriwaki et al 2013, Luo and Lau 2019), to air with higher moisture content in cities and thus a UMI (e.g. Lee 1991, Wang et al 2021). While parts of these differences are likely caused by site specific environmental conditions, such as anthropogenic water sources (e.g. Huang et al 2021, Wang et al 2021) or regional moisture transport (e.g. Du et al 2022), the distinction between relative and absolute UDI, which are assessed by relative humidity metrics (RH, VPD) and by metrics specifying the absolute water content in the air (e, q, absolute humidity), respectively, plays an important role in the reported differences. Furthermore, UDIs show a distinct seasonal and diurnal cycle (figures 3 and 4), which can also lead to the presence or absence of UDI, depending on the period of investigation. Our large-scale study, quantifying the diurnal and seasonal patterns of relative and absolute UDI, can generalize the UDI behavior for the first time at the global scale.
When analyzing urban–rural differences in relative humidity measures, such as RH and VPD, results agree amongst different studies. Relative UDI has been reported in cities around the globe with various background climates such as Beijing (Yang et al 2017) and the urban agglomeration of the Yangtze River Delta in China (Hao et al 2018, Luo and Lau 2019), Zaragoza in Spain (Cuadrat et al 2015), Moscow in Russia (Lokoshchenko 2017), Berlin in Germany (Langendijk et al 2019), Lodz in Poland (Fortuniak et al 2006), Chicago in the USA (Ackerman 1987), and Edmonton in Canada (Hage 1975). The results of our large-scale analysis confirm and generalize these results by showing higher relative UDI during night compared to daytime (e.g. Yang et al 2017) and during the warm compared to the cold season (e.g. Langendijk et al 2019, Luo and Lau 2019).
However, literature results start to diverge when assessing absolute UDI, with studies showing both the presence of UDI (e.g. Moriwaki et al 2013, Luo and Lau 2019) and UMI (e.g. Lee 1991, Wang et al 2021). The occurrence of either UDI or UMI is dependent on time of the day and season. Absolute UDI was found mostly during daytime and summer (Hage 1975, Tapper 1990, Lee 1991, Moriwaki et al 2013), while UMI is mostly reported at night and during winter (Hage 1975, Tapper 1990, Lee 1991) except for a study focusing on Hong Kong (Wang et al 2021), which has a strong UMI likely caused by substantial anthropogenic moisture sources in the city (Huang et al 2021) and regional moisture transport (Du et al 2022). While our large-scale analysis does not find a significant UMI, the same distinct diurnal pattern is shown with the largest absolute UDI during daytime and a small to non-existent absolute UDI at night. At the seasonal time-scale, our results also generalize previous results showing higher values of UDI during the warm season compared to winter (e.g. Moriwaki et al 2013, Luo and Lau 2019).
Warmer air, such as caused by the UHI, increases esat and can cause relative UDI with a minimal change in absolute moisture in the air as shown for nighttime conditions. However, warmer air is also capable to hold more moisture in the absence of water supply limitations (e.g. Shuttleworth 2012). Hence, UHI might cause absolute UMI as reported in some studies (Hage 1975, Tapper 1990, Lee 1991) if ample moisture is available due to local moisture sources and evapotranspiration (Huang et al 2021), or lateral advection of moisture (Du et al 2022). Higher temperatures in cities and different surface properties can also lead to the absence or a delayed dewfall causing an absolute UMI (Kuttler et al 2007). Hence, due to the higher water holding capacity of warmer air, a small absolute UDI in correspondence with considerable UHI does not necessarily indicate that impervious land cover does not influence local atmospheric moisture, but simply that UHI partially offsets absolute UDI. This is shown by the presence of a high relative UDI as seen in this study at night and also often reported in literature (e.g. Cuadrat et al 2015, Yang et al 2017, Hao et al 2018, Luo and Lau 2019) even in the absence/presence of absolute UDI/UMI. However, the influence of limited evapotranspiration on humidity in cities, caused by impervious landcover, is best shown during daytime due to the absence of UHI and higher evapotranspiration rates. Daytime absolute UDI as well as higher absolute UDI in summer than winter suggest that evapotranspiration differences between urban and rural areas are very likely causing such an absolute UDI (see also Hao et al 2018).
4.2. UDI and outlook on potential impacts on human health, energy usage and urban ecology
In contrast to UHIs (e.g. Manoli et al 2019, Venter et al 2021), large scale studies quantifying diurnal and seasonal patterns of UDI and UMI magnitudes have been absent even though altered humidity in cities can similarly impact human health, building energy consumption, and urban ecology.
Heat stress is influenced by both temperature and humidity (Mora et al 2017, Coffel et al 2018) and especially, in hot and humid regions, an increase in humidity can decrease human outdoor thermal comfort (OTC) (Chow et al 2016, Meili et al 2021a). While urbanization increases UHI (Huang et al 2019), the concurrent intensification of the UDI was found to offset some of the anticipated increase in hot and humid heat stress in summer in Beijing (Wang and Gong 2010). On the other hand, a large-scale increase in irrigation, albeit not in cities, has been shown to enhance moist heat stress extremes in India due to the increase in humidity (Mishra et al 2020). Studies like these show that not just high temperatures and UHI but also humidity and UDI can impact OTC, heat stress, and consequently human health. Hence, further studies are required to systematically quantify the effects of the observed magnitude of UDI reported here on heat stress, which could be especially relevant as UDI are largest during the warm season and daytime (figures 3 and 4), when heat mitigation is mostly needed.
Heat mitigation strategies, such as urban greenery, influence both UHI and UDI. Increasing humidity due to plant evapotranspiration could limit the improvement in OTC associated with urban vegetation (Hass et al 2016, Meili et al 2021a). At the same time, high VPD, likely exacerbated by UDI in cities, can impact plant stomatal response (Chen et al 2011, Novick et al 2016, Gillner et al 2017, Winbourne et al 2020) potentially limiting the evpotranspirative cooling potential of urban vegetation during periods of intense heat (Meili et al 2021b). These counteracting processes of reduced evapotranspiration due to stomatal closure at times of high VPD and the general increase in humidity by evapotranspiration in cities during normal VPD conditions are often neglected in studies predicting vegetation effects on urban climate. Only few urban microclimate models include detailed vegetation formulations (e.g. Nice et al 2018, Meili et al 2020) and further measurements and modelling studies are needed to understand the complex interaction between urban humidity, plant transpiration, and vegetation benefits during heatwaves.
Higher temperatures in cities can also lead to an increase in building energy demand for cooling (Santamouris 2014). Recent studies have shown that making predictions based on air temperature alone without the consideration of humidity can lead to an underprediction of up to 10%–15% of present and future building cooling demand (Maia-Silva et al 2020). In hot and humid regions, Fonseca and Schlueter (2020) found that the increase in energy usage for building cooling is largely driven by higher needs for dehumidification rather than cooling itself. This is of special importance as tropical and sub-tropical cities have a large potential for an increase in energy usage for cooling in the future (Waite et al 2017). Due to the impact of humidity on the quantification of building energy cooling demand, UDI and UMI magnitudes thus require careful evaluation, and their impacts need to be considered in future studies.
4.3. Limits of interpretation
The UDI and UHI magnitudes calculated in this study are averages over many cities and hence, depend on the ensemble of stations used. As most of the rural and urban meteorological stations are located in the northern mid-latitudes, the trends observed here are representing predominantly UDI and UHI magnitudes of mid-latitude cities in North America, Europe, and Asia. As discussed, humidity can have a large impact on moist heat stress and on energy usage for dehumidification in hot and humid regions, which suggests studies characterizing the urban humidity environment and UDI in tropical cities are urgently needed. To analyze possible differences in UDI due to background aridity, we analyzed trends for stations with WI < 1 (water limited) and WI > 1 (energy limited), separately. However, the results (SI figure 16) are highly dependent on the chosen WI cut-off point and hence are deemed not very robust. Furthermore, urbanization is approximated in this study by the increase in artificial impervious areas without consideration of city structure and urban fabric, number of inhabitants or other site-specific characteristics, which could affect the magnitude of UHI and UDI. However, due to the very large number of stations used, our approach is expected to average out many of these city-level differences and provide an 'average' estimate of UDI magnitude and patterns.
While the land surface scheme used in the construction of the ERA5 reanalysis product does currently not simulate urban areas (Balsamo et al 2009, Hogan et al 2017, Bassett et al 2021, Venter et al 2021), the ERA5 product could still include implicitly urbanization due to air temperature assimilation from weather stations. However, such effects have been found to be negligible in a study quantifying UHI trends in London with the use of ERA5 (Bassett et al 2021).
As the increase in artificial impervious area is quantified within a radius of 7 km around each meteorological station, the reported results are representative of the large-scale urbanization effect on the atmospheric conditions and thus of mesoscale UDI and UHI changes. This means that the results do not represent the effects of small scale-land cover change (e.g. a local parking lot, increase in building heights, construction of a pond) on local microclimate, which might exist in some of the analyzed stations. We further would like to highlight, that while the diurnal and seasonal patterns presented in this study do not change with changing buffer radius in the range of 2–9 km, the absolute magnitude of UHI and UDI is dependent on the selected buffer radius as urbanization rates tend to decrease at higher buffer radii (SI figure 3). Magnitudes of diurnal and seasonal patterns of UHI and UDI calculated for a 4 km and a 9 km buffer radius are shown in the supplementary information (SI figures 4–7). Further note that the horizontal extent of urban temperature effects can extend beyond the city boundary (Fan et al 2017) and hence, some stations could also be influenced by adjacent regions with large land conversion rates. Last, in our analysis, a fully urbanized area not undergoing any landcover change during the study period has an urbanization rate of zero equal to a natural area not undergoing urbanization. We also assume that the relationship between urbanization and the formation of UHI and UDI is linear and that there is no interaction between the absolute fraction of impervious urban land cover and the climate change signal. However, rural and urban stations could respond differently to an overall changing climate as Li and Bou-Zeid (2013) have shown that there could be a synergistic interaction between UHI and heat waves increasing temperatures in cities beyond the simple sum of the UHI and the heat wave signal. While we expect some of these limitations to affect the magnitude of the computed UHI and UDI, the seasonal and diurnal patterns are much more robust as shown by the sensitivity analysis to the buffer radius.
5. Conclusions
In contrast to UHI, investigations of UDI are scarce and confined to case-studies of single cities or urbanizing regions. However, UDI could potentially affect thermal comfort and human well-being, building energy consumption, and urban ecology. Large scale global analyses of UHI and UDI are often limited by meteorological data availability as concurrent measurements within cities and their surrounding rural areas are unavailable at the global scale. To overcome this limitation, we leverage the fact that many regions experienced rapid urbanization in the last few decades, which led to the development and intensification of UHI and UDI effects.
Our global scale analysis shows that absolute UDI is largest during daytime with a peak in the late afternoon and early evening hours. In contrast, relative UDI is largest during nighttime peaking in the late evening hours in summer. Generally, absolute and relative UDI are largest during the warm season and much smaller during winter, with the exception of daytime UDIRH, which does not show a distinct seasonal pattern. UDIRH exhibits a stronger diurnal pattern than UDIVPD. Our analysis recovers typically observed diurnal UHI patterns showing higher temperatures during nighttime and the absence of UHI during day. UHI is larger during the warm season and negligible during winter, a pattern also found in large scale studies on surface UHI (Zhou et al 2013, Manoli et al 2020, Paschalis et al 2021). We further show that the distinction between relative and absolute UDI and their diurnal and seasonal patterns is fundamental to reconcile differences in the UDI literature. In summary, urbanization induced humidity changes might be as relevant as temperature changes and are statistically much more evident. The global magnitude and patterns of absolute and relative UDI reported in this study represent a starting point for quantification of humidity effects on OTC, building energy consumption, and urban ecology.
Acknowledgments
N M and S F acknowledge the support of the National University of Singapore through the project 'Bridging scales from below: The role of heterogeneities in the global water and carbon budgets', Award No. 22-3637-A0001. A P acknowledges funding from NERC (NE/S003495/1). G M acknowledges support by 'The Branco Weiss Fellowship—Society in Science' administered by ETH Zurich.
Data availability statement
The data that support the findings of this study are openly available.
Global artificial impervious areas (GAIAs) at 30 m resolution (Gong et al 2020) were downloaded from http://data.ess.tsinghua.edu.cn, 22 March 2021.
HadISD version 3.1.1.2020f data were obtained from www.metoffice.gov.uk/hadobs/hadisd on 1.6.2021 and are British Crown Copyright, Met Office, provided under an Open Government License, www.nationalarchives.gov.uk/doc/non-commercial-government-licence/non-commercial-government-licence.htm.
The bias corrected ERA5 reanalys product (Cuchi et al 2020) was downloaded from the Copernicus Climate Change Service (C3S) Climate Data Store (2020).
Conflict of interest
The authors declare that they have no known competing financial interests or personal relationships that could have appeared to influence the work reported in this paper.