

Abstract
Emissions scenarios used by the Intergovernmental Panel on Climate Change (IPCC) are central to climate change research and policy. Here, we identify subsets of scenarios of the IPCC's 5th (AR5) and forthcoming 6th (AR6) Assessment Reports, including the Shared Socioeconomic Pathway scenarios, that project 2005–2050 fossil-fuel-and-industry (FFI) CO2 emissions growth rates most consistent with observations from 2005 to 2020 and International Energy Agency (IEA) projections to 2050. These scenarios project between 2 °C and 3 °C of warming by 2100, with a median of 2.2 °C. The subset of plausible IPCC scenarios does not represent all possible trajectories of future emissions and warming. Collectively, they project continued mitigation progress and suggest the world is presently on a lower emissions trajectory than is often assumed. However, these scenarios also indicate that the world is still off track from limiting 21st-century warming to 1.5 °C or below 2 °C.
Export citation and abstract BibTeX RIS

Original content from this work may be used under the terms of the Creative Commons Attribution 4.0 license. Any further distribution of this work must maintain attribution to the author(s) and the title of the work, journal citation and DOI.
1. Introduction
The Intergovernmental Panel on Climate Change (IPCC) uses carbon dioxide (CO2) emissions scenarios to imagine and evaluate 'a range of plausible futures, because human development is determined by a myriad of factors including human decision making' (IPCC WGIII 2014a, p 48). Scenarios used in the IPCC 5th Assessment Reports (AR5) (IPCC 2014) and 6th Assessment Reports (AR6; IPCC 2021) include the 'Representative Concentration Pathways' (RCPs) and the 'Shared Socioeconomic Pathways' (SSPs) (Moss et al 2010, Riahi et al 2017). The high-emissions end of the RCP/SSP range is consistent with 8.5 W m−2 radiative forcing and 4 °C–5 °C of warming relative to pre-industrial levels by 2100 (e.g. SSP5-8.5, RCP8.5) (Hausfather and Peters 2020a). At the low end, scenarios project emissions consistent with 1.9 W m−2 radiative forcing and 1.5 °C of warming or slightly less by 2100 (e.g. SSP1-1.9) (Hausfather and Peters 2020a).
The report of Working Group 1 of the IPCC AR6 (IPCC 2021) observes that 'No likelihood is attached to the scenarios assessed in this Report' (p 1–102). Yet, at the same time the IPCC AR6 recognizes that 'the likelihood of high emissions scenarios such as RCP8.5 or SSP5-8.5 is considered low' (IPCC 2021, p 1–110) and recent 'stated policy' scenarios of groups such as the International Energy Agency (IEA) are 'approximately in line with the medium RCP4.5, RCP6.0 and SSP2-4.5 scenarios' (IPCC 2021, p 1–110). The IPCC's recent recognition of scenario likelihood is part of a broader and fast-moving discussion of scenario plausibility and implications for research and policy (e.g. Ritchie and Dowlatabadi 2017, Pielke 2018, O'Neill et al 2020, Schwalm et al 2020, Hausfather and Peters 2020a, 2020b, Burgess et al 2021, Sognnaes et al 2021, Stammer et al 2021, Pielke and Ritchie 2021a, 2021b).
Scenario 'plausibility' has been discussed for many years, but the IPCC has not evaluated the plausibility of scenarios central to much of climate research and assessment (see, Höök 2011, Wiek et al 2013, Walton et al 2019, Pielke and Ritchie 2021a, 2021b). Plausibility, as defined by Wiek et al (2013) refers to 'a variety of future states that are considered "occurrable" (could happen)' (p 137). This general definition may be operationalized in different, legitimate ways. Our analysis defines a 'plausible' scenario as one in which future fossil-fuel-and-industry (FFI) CO2 emission growth rates of the scenario show a consistency with observations and IEA Stated Policies Scenario (STEPS) near-term projections. A scenario that has already diverged from reality is, by definition, not 'occurrable.' It is theoretically possible for a scenario that has already diverged significantly from observations to later return to the same projected future emissions level, though for this to occur would imply opposite divergences in the future, which would require a major departure from the trajectory of the original scenario, thus making that scenario implausible, even if it were to arrive at the same final level of emissions (see Burgess et al 2021).
Here, we further this discussion by identifying those scenarios of the AR5 and AR6 which are most in line with recent observations and near-term projections of FFI carbon dioxide emissions. The IPCC has not conducted or assessed evaluations of scenario plausibility, and until very recently little attention has been paid to IPCC scenario plausibility in the literature (Pielke and Ritchie 2021a). Thus, our paper addresses an important gap in climate research with broad implications for research and policy.
Studies exploring future climate impacts typically are based on a small number of scenarios as baselines to compare with scenarios of more or less stringent 21st-century mitigation efforts (Pielke and Ritchie 2021a). However, several recent studies have challenged whether commonly-used high-emission scenarios (e.g. SSP5-8.5) are plausible baselines, due to their assumptions of rapid 21st-century coal expansion (Ritchie and Dowlatabadi 2017, Hausfather and Peters 2020a, Burgess et al 2021, Pielke and Ritchie 2021a, 2021b; see also Schwalm et al 2020, Hausfather and Peters 2020b). Other studies have cast doubt on the feasibility of rapid accelerations in decarbonization, sufficient scaling of carbon-removal technologies, or both, necessary to limit forcing to 1.9 W m−2 (Anderson and Peters 2016, Rogelj et al 2016, Pielke 2018, Liu and Raftery 2021). To ensure the rigor of climate research designed to project plausible futures, it is thus important to continuously evaluate scenarios for plausibility.
Burgess et al (2021) compared fundamental assumptions of IPCC and SSP baseline scenarios (specifically: fossil-fuel CO2 emissions, population, GDP per capita, energy intensity and carbon intensity) to data from 2005 to 2020 and to the most recent projections of the IEA to 2040 (IEA 2020). That analysis identified a set of scenarios classified as implausible because they were out of step with recent history and near-term IEA projections. Here, we build upon and update that analysis by comparing growth rates in fossil fuel and industry (FFI) CO2 emissions of IPCC and SSP baseline and policy scenarios to identify scenarios that project growth rates in FFI CO2 emissions consistent with recent history (Global Carbon Project 2021, Ritchie and Roser 2021) and near-term IEA projections to 2050 (IEA 2021). We characterize such scenarios as plausible. Our analysis does not associate individual scenarios with likelihoods or probabilities. After identifying a subset of plausible scenarios from the larger set of available scenarios, we then assess what this subset of plausible scenarios projects to 2100 for future FFI CO2 emissions and associated global average temperature change.
2. Methods
We evaluate the 1184 AR5 scenarios (IPCC 2014, IPCC WGIII 2014b) and 127 SSP scenarios (Riahi et al 2017) with respect to projected FFI CO2 emissions growth rates, compared to observations (Global Carbon Project 2021, Ritchie and Roser 2021) over 2005–2020, and compared to 2021–2050 projections from the IEA's 2021 World Energy Outlook (WEO) (IEA 2021). We focus on the AR5 and SSP databases, as these are central to the most recent IPCC assessment reports (IPCC 2014, 2021), and they cover the full range of emissions pathways widely used in climate research. We do not include the scenario database of the IPCC Special Report on Global Warming of 1.5 °C (IPCC 2018) in this analysis because it was designed based on a set of exploratory scenarios constrained to achieve the 1.5 °C policy target, and thus not equivalent in purpose or scope to the baseline and policy scenarios of the AR5 and SSP databases.
IEA STEPS projects that pledged climate and energy policies are enacted in varying degrees but includes no new policies, akin to conventional 'business as usual' (BAU) baselines. Previous IEA WEOs (e.g. IEA 2019) also included a second, slightly more pessimistic, BAU-like Current Policies Scenario (CPS)—assuming no further policies would be implemented beyond those already enacted. Both CPS and STEPS CO2 emissions have been successively revised down in recent years, for reasons including faster-than-projected renewable energy deployment growth, slower coal growth, and slower economic growth (Frankel 2011, de Resende 2014, Ritchie and Dowlatabadi 2017, IEA 2019, 2020, 2021, Burgess et al 2020, 2021). The IEA discontinued using CPS in 2020 due to the implausibility of a future with no new climate policies (IEA 2020). IEA STEPS is commonly used as a current benchmark reference case projection for plausible near-term emissions (e.g. Hausfather 2021) and we follow this convention in this analysis as well.
We use IEA projections to 2050 as representing current consensus expectations among energy experts for the near-term future. It is of course possible that IEA projections will turn out to be inaccurate. We use IEA projections as benchmark projections—consistently with previous studies (Hausfather and Peters 2020a, Burgess et al 2021)—as the IEA's projections are updated annually. If IEA's projections of near-term emissions continue to be revised down—as they have in recent years (IEA 2019, 2020, 2021)—then our present analysis would be biased towards including 'plausible' scenarios with higher emissions and warming than was justified—meaning that scenarios currently judged as plausible may in the future be judged implausible. Indeed, as the future unfolds, we should fully expect that the subset of available scenarios judged to be plausible shrinks in number over time as reality constrains possibilities as the future becomes the present.
We consider both baseline (i.e. reference or no policy) and policy scenarios of the AR5 and SSP databases (IPCC WGIII 2014b, Riahi et al 2017), and ask: Which scenarios have fossil-fuel CO2 emissions growth rate errors and divergences of less than 0.1%/y or 0.3%/y (where 'y' denotes year) over (a) 2005–2020 (errors, compared to observations) and (b) 2005–2050 (divergences, compared to observations and IEA 2021 STEPS) periods? We could not assess divergences for 114 AR5 scenarios and 22 SSP scenarios lacking 2005 numbers, and 11 AR5 scenarios lacking 2050 numbers, leaving a total of 1059 AR5 scenarios and 105 SSP scenarios in our main analysis. These growth rate errors and divergences result in different levels of projected accuracy over time: a ±0.1% (±0.3%) annual growth rate error compounded over 100 years results in ∼±10% (∼±35%) overall projection error in annual FFI CO2 emissions. As we show in supplementary materials (SM) figure S1 (available online at stacks.iop.org/ERL/17/024027/mmedia), the ranges of 2100 warming found in plausible scenarios are qualitatively insensitive to changes in the specific values chosen for these growth rate error and divergence thresholds.
As a robustness check regarding the COVID-19 recession and temporary drop in CO2 emissions in 2020 (Le Quéré et al 2020), in the SM we compare 2005–2020 growth rates from AR5 and SSP scenarios to 2005–2019 average growth rates. In the SM, as a further robustness check, we also compare the AR5 and SSP scenarios to the IEA (2021) new 'Announced Pledges Scenario' (APS), which evaluates announced ambitions and targets, even when they have not been anchored in specific policies. Lastly, we compare errors and divergences of AR5 and SSP scenarios from observations, IEA STEPS, and IEA APS in each of the Kaya Identity (Kaya and Yokoburi 1997) factors: population, GDP per capita, energy intensity (primary energy/GDP) and carbon intensity (CO2 emissions/primary energy), to explore the drivers of the FFI CO2 emission divergences (see SM).
3. Results
For the period 2005–2020, 64 AR5 (6%) and 7 SSP (6.6%) scenarios meet the ±0.1%/y error threshold, and 243 AR5 (22.9%) and 23 SSP (21.9%) scenarios meet the ±0.3%/y threshold. For the period 2005–2050, compared to the STEPS scenario, 26 AR5 (2.4%) and 9 SSP (8.6%) scenarios meet the ±0.1%/y divergence threshold, and 85 AR5 (8%) and 19 SSP (18.1%) scenarios meet the ±0.3%/y threshold. We characterize these scenarios as 'plausible' because their emissions trajectories are consistent with the recent past and current reference projections of the energy system's expected evolution over the next three decades.
These plausible scenarios project a range of futures to 2100, but as a group they are largely consistent with continued decarbonization. Figure 1 shows the FFI emissions in scenarios meeting the ±0.1%/y and ±0.3%/y divergence thresholds for 2005–2050. The SM contains corresponding figures, showing: fossil-fuel emissions only (figure S2); and FFI emissions of scenarios selected with: 2005–2020 error filters (figure S3), 2005–2019 error filters (i.e. not including the pandemic effects; figure S4), and 2005–2050 divergences from 2005–2050 observations and IEA (2021) APS projections (figure S5). Of note, for emissions in 2050 the median trajectory of the subset of plausible scenarios (figure 1) is essentially identical to the independent projection of the IEA WEO (2021).
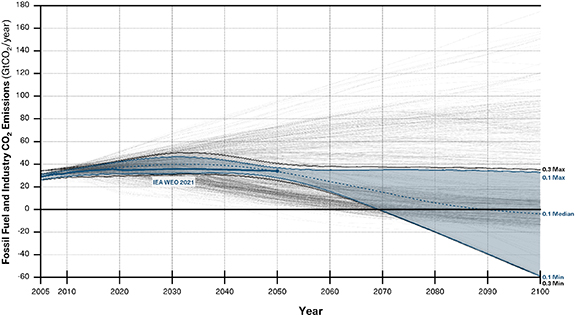
Figure 1. The trajectories of all fossil-fuel-and-industry (FFI) CO2 emissions to 2100 among 1184 AR5 and 127 SSP scenarios (IPCC WGIII 2014b, Riahi et al 2017), along with the IEA STEPS to 2050 (IEA 2021). Shaded regions indicate envelopes of scenarios meeting ±0.1%/y (blue) and ±0.3%/y (gray) divergence tolerances in FFI CO2 emissions (relative to observations and IEA projections). See also figure S1.
Download figure:
Standard image High-resolution imageThe upper limit of plausible scenario ranges with both IEA (2021) STEPS filters is similar, at slightly less than 40 gigatons (Gt) CO2 per year by 2100, and FFI CO2 emissions peaking before mid-century (figure 1). Both ±0.1%/y and ±0.3%/y divergence subsets also include scenarios with net negative emissions (i.e. the removal of carbon dioxide from the atmosphere) in the latter half of the 21st century. Scenarios selected with the 2005–2019 and 2005–2020 error filters have higher upper limits: ∼60–80 Gt CO2/y by 2100 with the 2005–2020 filters (figure S3), and ∼70–100 Gt CO2/y by 2100 with the 2005–2019 filters (figure S4). Scenarios selected with the 2005–2050 APS filter have lower upper limits: ∼20 Gt CO2/y by 2100 (figure S5).
Figure 2 plots the plausible scenarios (using the 2005–2050 STEPS filters) in terms of 2000–2100 cumulative CO2 emissions and associated end-of-century global mean temperature increase (relative to the pre-industrial baseline). Temperature increases are only available for 524 of the AR5 scenarios (but all of the SSPs). Figure 2 also shows the SSP marker scenarios and scenario ranges associated with different levels of radiative forcing in 2100 (1.9, 2.6, 3.4, 4.5, 6.0, 7.0, and 8.5 W m−2).

Figure 2. AR5 (IPCC WGIII 2014b) and SSP scenarios (Riahi et al 2017, IIASA 2018) plotted in terms of cumulative FFI CO2 emissions in the 21st century, and warming by 2100, relative to the pre-Industrial baseline. Major SSP scenario ranges (dashed boxes) and marker scenarios are highlighted. Blue circles and light-blue triangles represent scenarios meeting the ±0.1%/y and ±0.3%/y divergence tolerances, respectively, in FFI CO2 emissions (relative to observations and IEA STEPS projections from 2005 to 2050). Figure S6 zooms in on the plausible scenarios.
Download figure:
Standard image High-resolution imageMost of the plausible scenarios (62% with the 0.1%/y filter; 56.3% with the 0.3%/y filter) project emissions trajectories to 2100 that are consistent with SSP 3.4 (3.4 W m−2, 2.0 °C–2.4 °C of warming). All of the plausible scenarios fall between 2 °C and 3 °C by 2100 (figures 2 and 3). High-emission baseline scenarios of the SSPs—SSP3-7.0 (7.0 W m−2, ∼4 °C of warming) and SSP5-8.5 (8.5 W m−2, ∼5 °C of warming)—lie far outside the envelope of plausible scenarios (figure 2). None of the plausible scenarios fall within the range of SSP 6.0 scenarios (figure 2; see also figure S6).
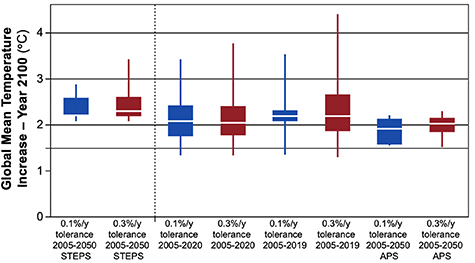
Figure 3. Projected temperature increases (2100, compared to the pre-Industrial baseline) in sets of AR5 (IPCC WGIII 2014b) and SSP scenarios (Riahi et al 2017, IIASA 2018) selected by the various filters used in our analysis, in terms of divergences in FFI CO2 emission growth rates observed and projected by IEA (2021) STEPS or APS scenarios. Boxes denote the 25th to 75th percentile ranges; white line denotes the medians; and whiskers denote the minima and maxima.
Download figure:
Standard image High-resolution image
In contrast, the 2005–2019 and 2005–2020 filters admit a small number of scenarios with greater than 3 °C of warming, and the 2005–2050 APS filter admits scenarios between 1.5 °C and 2 °C of warming (figure 3). Thus, the implausibility of >3 °C warming scenarios depends on the accuracy of IEA (2021) STEPS projections, and specifically its projection that global FFI carbon dioxide emissions will at most plateau over the coming decades (figure 1). Similarly, further progress in decarbonization beyond what IEA (2021) STEPS scenario envisions could make sub-2-degree targets feasible.
These results are qualitatively insensitive to our choice of divergence threshold, as most scenarios having 2100 warming outside the 2 °C–3 °C range have 2005–2050 divergences greater than 0.5%/y (figure S1). The effect of the COVID-19 pandemic for projections of near-term emissions trajectories is evident in the difference in warming ranges given by the 2005–2019 and 2005–2020 filters (figures 3, S3 and S4).
Warming projections associated with emissions scenarios are also uncertain due to various climate factors. To illustrate this, figure S7 shows ranges of temperature (Tebaldi et al 2021) and cumulative emissions (Liddicoat et al 2021) consistent with SSP marker scenarios, based on the Coupled Model Intercomparison Project (CMIP6). At the high end, these ranges allow for warming of >3 °C by 2100 even if emissions stay within ranges of the plausible scenarios. At the low end, plausible scenarios could allow warming lower than 2 °C by 2100.
To assess drivers of divergences between AR5 and SSP scenarios and observations and IEA (2021) scenarios, we assess growth rate divergences across the Kaya Identity (Kaya and Yokoburi 1997) factors (see SM): population, GDP per capita, energy intensity (primary energy/GDP), and carbon intensity (CO2 emissions/primary energy). The AR5 and SSP scenarios our analysis identifies as plausible are more consistent with observations and IEA (2021) STEPS projections than other scenarios in carbon intensity (figure S8). Divergences in population and GDP per capita were similar across scenarios satisfying and not satisfying the filters, and plausible scenarios often had negative energy intensity divergences compensating for the positive divergences in GDP per capita growth that exist across most scenarios (figure S8) (see Burgess et al 2021). Similar patterns exist in Kaya comparisons using other filters (2005–2019, 2005–2020, 2005–2050 APS; figures S9–S11).
4. Discussion
The subset of IPCC scenarios we identify as 'plausible'—most consistent with observations to 2020 and IEA (2021) projections to 2050 (figure 1)—are also consistent with a world currently well-positioned for future climate policy success via continued implementation of policies that move the world closer to achieving or nearly achieving a 2 °C target by 2100 (figure 2; see also figures S1 and S6). This finding is cautiously encouraging, but it is also limited to the scope of previously published scenarios, which will not capture full uncertainty about future CO2 emissions or climate response. At the same time our results are consistent with projections of the implications of current policies for future emissions and global temperature changes projected by the Climate Action Tracker (2021) and the United Nations Environment Programme's (UNEP) (2021) Emissions Gap analyses. Our finding that the plausible scenarios fall within the 2 °C–3 °C warming range is also consistent with a recent analysis by Sognnaes et al (2021) that explores scenario uncertainties beyond the scenarios in the AR5 and SSP databases.
It is clear from this analysis that from the perspective of the scenarios of the IPCC, the world is not presently far off-track from a trajectory of FFI emissions envisioned in IPCC scenarios to be consistent with achieving 2 °C policy goals. This conclusion is also consistent with the IPCC AR6 (2021) recently identifying high-emission scenarios (e.g. SSP5-8.5) to be low likelihood and mid-range scenarios (e.g. SSP2-4.5) as more likely. If scenario developers of several decades ago were to have known actual emissions trajectories to 2020 and projected in 2021 for 2050, they likely would have been encouraged by the path the world was on, as compared to the full set of possibilities that they had then envisioned across the full set of scenarios.
Importantly, in the scenarios our analysis identifies as plausible, future decarbonization rates accelerate relative to the present, and many include substantial deployment of carbon removal technologies in the latter half of the century, the feasibility of which our analysis does not assess. Comparing figures 1 and S2, we see that carbon removal has little effect on the high end of the range of emissions in scenarios we identify as plausible, but—unsurprisingly—reduces the lower range of the scenario envelope. In 2100, the median carbon emissions created from fossil-fuel combustion (i.e. which does not account for carbon capture or removal) of the plausible scenarios are ∼10 GtCO2/y (figure S2), compared to zero when the effects of carbon removal technologies are applied (figure 1). A median of ∼10 GtCO2/y from fossil combustion by 2100 would reflect greater than two-thirds reduction from today's levels. Thus, in the scenarios our analysis identifies as most consistent with global energy system developments toward mid-century, large-scale carbon removal is necessary for achieving net-zero emissions this century as fossil technologies are projected to continue to play such a substantial role in the energy system.
Carbon removal technologies presently do not exist at scale (IEA 2020), and their future technical and political plausibility has been questioned (e.g. Anderson and Peters 2016). Liu and Raftery (2021) show that countries must increase their decarbonization rates by 80% relative to Paris commitments to limit warming to 2 °C by 2100. Similarly, if the pace of global decarbonization fails to keep up with IEA (2021) STEPS projections, scenarios having greater than 3 °C warming by 2100 would again become plausible (figure 3). However, observed decarbonization has exceeded IEA projections in recent years; see IEA (2019, 2020, 2021). Thus, our findings underscore the urgency of continued efforts to accelerate decarbonization of the global economy if the trajectory of currently plausible scenarios is to be achieved or exceeded in the future.
It is notable that all of the baseline scenarios (often used as 'business as usual' or 'reference' scenarios in climate research; Pielke and Ritchie 2021a) over-projected 2005–2050 emissions growth, relative to observations and IEA (2021) STEPS, by more than 0.1%/y (all but one, AIM/CGE's SSP1 baseline, over-projected by 0.3%/y or more) (figure S1) (see also Burgess et al 2021). This suggests that climate research and policy are currently overly focused on implausibly pessimistic scenarios of the future (Hausfather and Peters 2020a, Pielke and Ritchie 2021a, 2021b). Relying on implausible scenarios can mislead policy analyses. For instance, using baseline scenarios that over-estimate near-term emissions requires assuming a need for unnecessary amounts of late-21st century deployment of carbon removal technologies in policy scenarios.
It is also notable that the vast majority of scenarios that project futures to 2100 failed our simple criteria of plausibility by 2020, even though they were developed in recent years and decades. This raises questions about the appropriate use of long-term scenarios as projections of plausible futures, rather than as exploratory tools (Bankes 1993), and suggests a need for policy-relevant scenarios that are updated much more regularly with new observational information, similarly to the IEA's near-term scenarios (Burgess et al 2021, O'Neill et al 2020, Pielke and Ritchie 2021a).
5. Conclusion
The IEA (2021) STEPS near-term projections of CO2 emissions support expectations for the next several decades of a long-plateau in CO2 emissions and projections of less than 3 °C of warming by 2100 (see, Hausfather and Peters 2020a). Such expectations are independently supported by the envelope of scenarios identified as plausible in our analysis (figures 1–3). Of course, the future is uncertain, contingent on policy choices and expectations that will evolve as we move into that future.
Deep decarbonization remains an enormous challenge, and net-zero CO2 emissions by 2050—a common policy goal—remains outside the envelope of even the plausible scenario trajectories (figure 1). Of course, decision makers around the world could choose to intentionally grow CO2 emissions, but that currently seems highly unlikely based on analyses such as the UNEP (2021) Emission Gap report. Our analysis suggests that the world thus sits in an enviable position to take on the challenge of deep decarbonization, at least as compared to where IPCC baseline scenarios and some of the public discourse projected the world to be in 2021 (Pielke and Ritchie 2021a). To support continued efforts to achieve deep decarbonization, climate research and policy depend on the development and regular update of plausible scenarios.
Acknowledgments
We thank Zeke Hausfather, Oliver Geden, Glen Peters, Ken Caldeira, Richard Betts, Chris Green and Ken Rice for comments on an earlier version of the manuscript. We acknowledge funding from the University of Colorado Boulder (start-up grant to M G B) and The University of British Columbia and the Canada Research Chairs Program (J R).
Data availability statement
Data and code used in our analysis are available from https://github.com/mattgburgess/climatekaya. All other data needed to evaluate the conclusions in the paper are present in the paper or the supplementary materials.
The data that support the findings of this study are openly available at the following URL/DOI: https://github.com/mattgburgess/climatekaya.