

Abstract
Assessing the risk of yield loss in African drought-affected regions is key to identify feasible solutions for stable crop production. Recent studies have demonstrated that Copula-based probabilistic methods are well suited for such assessment owing to reasonably inferring important properties in terms of exceedance probability and joint dependence of different characterization. However, insufficient attention has been given to quantifying the probability of yield loss and determining the contribution of climatic factors. This study applies the Copula theory to describe the dependence between drought and crop yield anomalies for rainfed maize, millet, and sorghum crops in sub-Saharan Africa (SSA). The environmental policy integrated climate model, calibrated with Food and Agriculture Organization country-level yield data, was used to simulate yields across SSA (1980–2012). The results showed that the severity of yield loss due to drought had a higher magnitude than the severity of drought itself. Sensitivity analysis to identify factors contributing to drought and high-temperature stresses for all crops showed that the amount of precipitation during vegetation and grain filling was the main driver of crop yield loss, and the effect of temperature was stronger for sorghum than for maize and millet. The results demonstrate the added value of probabilistic methods for drought-impact assessment. For future studies, we recommend looking into factors influencing drought and high-temperature stresses as individual/concurrent climatic extremes.

Original content from this work may be used under the terms of the Creative Commons Attribution 4.0 license. Any further distribution of this work must maintain attribution to the author(s) and the title of the work, journal citation and DOI.
1. Introduction
Sub-Saharan Africa (SSA) has the highest number of food-insecure people (about one out of five) in the world [1]. Around 239 million people in this region suffer from undernourishment [2]. The continent is far from food self-sufficiency, especially regarding cereal production. The cereal demand in SSA will further increase, with threefold population growth predicted by 2050 [3]. Drought, a climate-related shock that results in significant damage to agriculture, is among the major causes of food insecurity in SSA. Crop production in SSA is vulnerable to drought [4, 5] due to the limited coping mechanisms and inadequate contingency planning for drought mitigation [6]. Between 2003 and 2013, SSA alone accounted for more than three-quarters of all drought-induced crop and livestock production losses worldwide [7]. The situation will worsen in the future, as studies forecast increases in the frequency and severity of droughts [8–10], highlighting South Africa and the Horn of Africa among global drought hotspots. Other studies in western and central Africa show that temperature increase is expected for these regions [11, 12]. For this reason, in-depth understanding of crop response to drought and high-temperature stresses as two important climatic extremes and the fine-scale mapping of risk of potential crop yield losses are essential for supporting decisions about closing the existing yield gap and ensuring sustainable crop production in a changing climate.
Assessing crop response to climatic extremes such as drought requires detailed information on the biophysical processes governing cropping systems [13]. In recent decades, process-based crop models have been the primary tools for understanding the complex dynamics of agricultural systems by representing the mechanisms that control plant growth and describing the roles of various drivers on biomass growth and crop yield formation [14, 15]. These models have been employed to assess large-scale climate change impacts on crop production [16–19]; explore the spatiotemporal variability of agricultural drought risks [14, 20]; and model the impact of adaptation strategies designed to increase agricultural productivity [21–23]. One of the remaining gaps in current studies on the large-scale application of crop models is that in most cases, crop models have not been sufficiently calibrated against long-term historic yields (or other state variables) mainly due to a lack of continuous observations. This problem is more pronounced in regions such as SSA that feature poor data availability and quality [24]. A lack of high-quality data creates major uncertainty regarding the simulated outputs of impact assessment studies, highlighting the importance of using uncertainty-based calibration methods [20].
Different methods have been used to assess the impact of climatic extremes on crop dry grain yield (hereafter yield) in SSA [25–28]; to identify the drivers of yield variability [13, 29, 30]; and to measure drought-driven risks [4, 5, 31]. For instance, Hoffman et al [29] revealed that improved agricultural technology played an important role in explaining changes in crop yields. Kamali et al [4] showed that societal factors can induce a greater degree of vulnerability than physical factors can, particularly in western African countries. Despite the literature's valuable insights into drought impacts on crop yield [32–35], most studies are based on deterministic methods in which the output is determined by a single model with a single set of parameter values and initial conditions. Deterministic methods are not able to inform about the uncertainty of the prediction, resulting from uncertainties of processes, model parameters and input data [36]. To date, few studies have been conducted to evaluate the risk of yield loss under drought in a probabilistic manner [37–39], which provides information on the probability of an event with certain magnitude occurring in a certain region. A recent approach by Leng and Hall [40] dealt with the probabilistic estimation of yield changes under a specific severity of drought across global agricultural regions. However, the study was conducted at a country level, and lacked the insight that fine, intra-national spatial resolution would provide. In another study, Madadgar et al [41] developed a multivariate probabilistic model to estimate precipitation and soil moisture deficit impacts on rainfed-crop yields in Australia. Kamali et al [20] quantified the physical vulnerability of crops to drought using probabilistic approaches in SSA, by aggregating drought exposure and crop loss indices (as the two components of drought vulnerability) into a single vulnerability index. Although the study used a probabilistic approach to define drivers of drought vulnerability, it did not provide information on the temporal dynamic of the aggregated vulnerability index. In another study, Zhang et al [42] assessed the relationship between different drought indices and crop yield in India. Implementing probabilistic methods that take into account the temporal dynamic of crop drought risk in SSA have received little attention in the literature.
Apart from the important role of the probabilistic methods and their application in the context of crop modeling for fine-scale crop-drought risk assessment, understanding the relative contributions of the climatic (different meteorological elements, particularly during different growth stages of a given crop) and soil property factors to yield drought risk is also important. A better understanding of these relationships between drought risk and influencing factors will greatly aid in developing strategies to reduce that risk.
This study attempts to address the afore-mentioned gaps. We developed and implemented an uncertainty-based calibrated crop model to simulate maize (Zea mays L), sorghum (Sorghum bicolor L Moench), and millet (Pennisetum glaucum L R Br) yields at 0.5° spatial resolution in SSA. These crops represent 70% of the total cereal production in SSA (53% of the total cereal production in Africa), covering 78% of the total cereal harvested area in SSA (66% of the cereal harvested area in Africa) [43]. The simulated yields at grid level were used to probabilistically map yield-loss risk due to drought using the Copula theory. More specifically, we answered four key research questions: (a) how much overall uncertainty is associated with different yield simulations?; (b) How large is the possible risk of cereal-crop yield loss in response to different severities of drought?; (c) Which crop appears to be at greatest risk of drought, and how does this risk vary spatially?; (d) Which biophysical factors contribute the most to increasing the risk of yield loss due to drought?
2. Methods
2.1. Model simulation and calibration
We investigated three staple crops (i.e. maize, millet, and sorghum), widely grown and adapted to the environmental conditions of SSA, for their specific response to drought events. The crop yields were simulated throughout SSA during 1980–2012 period, at 0.5° spatial resolution using the environmental policy integrated climate (EPIC) model version extended with a calibration module i.e. EPIC+ [44]. EPIC simulates crop growth processes in daily time steps using weather, soil, land use, and crop management parameters [45]. EPIC+ develops a spatially explicit version of original EPIC in a Python framework. This allows the extension of the EPIC application to larger scales by dividing the region of study into grids based on a specified resolution (here 0.5°) and executing EPIC on each grid cell.
Additionally, EPIC+ uses the sequential uncertainty fitting (SUFI-2) algorithm [46] for automatic calibration and uncertainty assessment of the model. According to SUFI-2 algorithm, uncertainty is quantified as the 95% prediction uncertainty (95PPU), calculated at the 2.5% and 97.5% levels of the variable's cumulative distribution using Latin hypercube sampling in the parameters' space. We used two statistics—the p-factor and the r-factor—to quantify the goodness of model calibration and the uncertainty level [47]. The p-factor, the fraction of the observed data bracketed by the 95PPU band, varies from 0 to 1, where 1 indicates 100% bracketing of the observed data within the model PPU. Values around 0.5 are often considered acceptable for crop simulations [48]. In contrast, the r-factor is the ratio of the average width of the 95PPU band to the standard deviation of the measured variable. The ideal value for the r-factor is 0, with an acceptable practical value of around 2 for crop yields [4]. The SUFI-2 algorithm endeavors to achieve a high p-factor while keeping the r-factor as small as possible [48].
The simulated maize yields are obtained from a study conducted by Kamali et al [20] in which the resulted gridded yields were aggregated to country level for model calibration. Here, we implemented the same procedure for simulation runs and model calibration for the case of sorghum and millet crops across SSA. The site-specific input data included longitude, latitude, slope, elevation (DEM), climate, soil, crop calendar, fertilizer, and soil, which were harmonized at the same resolution (see table S1 available online at stacks.iop.org/ERL/17/024028/mmedia). The grid level simulated yields were aggregated to country level and compared with country level observed yields (text S1). The standardized root mean square error (RSR) criterion proposed by Singh et al [49] was used as the objective function to evaluate the model performance when comparing country-level simulated yield with country-level yield from the Food and Agriculture Organization (FAO) [50] over a 33 years period (1980–2012). Further information on EPIC crop-related processes is available in Williams et al [45]; the procedure for calibration of EPIC+ is found in supplementary text S1 and in Kamali et al [20].
2.2. Probabilistic modeling of drought-related risk of crop yield loss
Different drought indices offer different information about a given drought phenomenon. A meteorological drought resulting from a precipitation deficit may develop rapidly, while a deficit in soil moisture as a measure of agricultural drought may occur with a time lag. Recently, Rigden et al [51] found that root-zone soil moisture is a better proxy than using standard approaches based on temperature or precipitation for agricultural purposes and yield prediction. In this study, we used and compared two standardized indices—the standardized precipitation index ((SPI) [52]) and the standardized soil moisture index (SSI [53, 54])—to justify the suitability of soil moisture for our analysis in the study area and also to quantify both variants and describe their severity.
The indices can be calculated at different time scales. As also suggested by Kamali et al [20], the 3 and 6 months time scale were identified to be most suitable for SSA. We here also selected these two time scales depending on the highest correlation with crop yield. Table 1 shows the six levels of drought severity grouped according to the World Meteorological Organization standards [55] used for characterizing SPI and SSI.
Table 1. Six categories of the SPI, the SSI, the CSI (crop sensitivity index) and YRisk (risk of yield loss under drought).
| Ranges | SPI, SSI | CSI | YRisk |
|---|---|---|---|
| 1.5–3.0 | Extremely wet | Very high yield | Very low |
| 1.00–1.49 | Very wet | High yield | Low |
| 0–0.99 | Moderately wet | Moderately high yield | Moderately low |
| 0.99–0 | Moderate drought | Moderately low yield | Moderately high |
| 1.49 to 1.00 | Severe drought | Severely low yield | High |
| 3.0 to 1.5 | Extreme drought | Extremely low yield | Very high |


The CSI for each year t was calculated using the yield values () simulated in each grid cell (i) for each crop as:

where indicate the mean and the standard deviation of the yield values, respectively over 33 years (1980–2012) for each crop and each grid point, the time series has a mean of 0 and a standard deviation of 1. Generally, EPIC estimates different stress factors caused by water, nutrients, temperature, aeration, and radiation [45]. These stress factors vary between 0 and 1 (with 1 indicating no stress and 0 the highest stress). The potential biomass and yield will be constrained by using the lowest factor among the stresses. The impacts of nitrogen stress were of course considered during model calibration. In order to explore the impact of drought on crop yield (crop drought risk analysis), we deployed the calibrated crop model, and simulated three crops across grids in SSA under a condition in which the model's response to nitrogen stress was turned off. Simulating yields under no nitrogen stress provided the possibility to directly assess the impact of drought and high-temperature stresses in different regions. The simulated yields affected by water stress only were then used for the probabilistic modeling of crop drought risk. Similar to SPI and SSI, six categories of yield levels were defined to characterize and classify CSI (table 1).


We modeled the risk of yield loss under drought (YRisk) probabilistically using Copula functions. Copula functions are multivariate cumulative distribution functions used to describe the dependence between random variables. The aim of this step is to estimate the responses of crop yields to different droughts of various severity levels. The main advantage of Copula-based methods is that they enable researchers to model the dependence structure between variables with different, including non-normal, marginal distributions [56]. We therefore described the relationship between a drought index (here, the SPI or the SSI) and the CSI using a Copula function [56] (figure 1). Assuming that X is the random variable of drought derived from soil moisture deficit or precipitation deficit, and Y is the random variable of crop yield levels, the joint probability distribution between the two (X and Y) can be expressed as:


Figure 1. A conceptual image of the joint distribution of (a) the SPI and the SSI, and (b) the crop yield sensitivity index (CSI). Black lines present the Copula isolines and the map stratifies the severity levels of (c) YRisk (risk of yield loss under drought) based on the classification defined in table 1.
Download figure:
Standard image High-resolution imagewhere denotes the joint probability distribution of the soil moisture (or precipitation) level and the crop yield level, we used a nonparametric joint distribution concept to construct the joint probability distribution. In doing so, the empirical joint probability in the bivariate case using the Gringorten plotting position formula [57] emerged as:

where n is the number of observations (here, 33 years) and is the number of occurrences of the pair for and [58]. Generally, variables such as temperatures, precipitation, and soil moisture can be non-stationary especially under a changing climate [57]. This makes it difficult to interpret fitted extreme value of distribution functions using parametric methods. Therefore, the application of nonparametric methods is appropriate [54]. The main advantage of the nonparametric methods is that they do not require making presumptions about the distribution of the variables. Besides, they alleviate the computational burdens in fitting the parametric distribution. Having determined the joint distribution, the risk of crop yield loss given a drought event (YRisk) is defined as [54]:


where is the standard normal distribution function. Almost all values of vary between −3 and 3 where −3 indicates the highest risk and 3 indicates the lowest risk. YRisk was then grouped into six categories of severity showing the risk level of crop loss under a drought event (table 1).


2.3. Contribution of drought-related factors to the risk of crop yield loss
We quantified how much each of the various drivers (climatic conditions and soil types) contributed to the risk of crop-yield loss (YRisk) by computing variance-based sensitivity indices [14, 59]. We used variance-based methods in which the variance of output (here YRisk) is decomposed into fractions and are attributed to inputs or sets of inputs (to different factors). This allows us to compare the levels of influencing factors on each crop. The variance based method can deal with nonlinear responses, and they can measure the effect of interactions in non-additive system. The decomposition analysis is conducted considering soil type, precipitation amount, and temperature during the main development stages of the crops. Accordingly, the contributing factors included: (a) the soil type; (b) precipitation from sowing to emergence (PCPSE); (c) precipitation from emergence to flowering (PCPEF); (d) precipitation from flowering to grain filling (PCPFG); (e) the average temperature from sowing to emergence (TMPSE); (f) the average temperature from emergence to flowering (TMPEF); and (g) the average temperature from flowering to grain filling (TMPFG). Specifically, two sensitivity indices,—the first-order or main effect (Ei ) and the total effect (TEi )—were applied to estimate the variance caused by one factor from the variance caused by the interaction of the rest of the factors:
and,
where is the variance and denotes the expected value of YRisk across factor , while is the expected value of YRisk across all factors except . The main effect Ei measures the effect of varying factor alone. On the other hand, not only does the TEi include the variance of an input, it also accounts for the variance created by interaction with other parameters. The total effect index is a summary sensitivity measure inclusive of interactions effect of any order [60].

![$E[{\text{YRisk}}|{V_i}]$](https://content.cld.iop.org/journals/1748-9326/17/2/024028/revision2/erlac4ec1ieqn17.gif)

![$E[{\text{YRisk}}|{V_{i - 1}}]$](https://content.cld.iop.org/journals/1748-9326/17/2/024028/revision2/erlac4ec1ieqn19.gif)

3. Results
3.1. Model accuracy
The yields of maize, millet, and sorghum were simulated by EPIC+ at grid level. The simulated yields were then aggregated at the country scale and compared with the country-level yields reported by the FAO [50] over the 1980–2012 period. The goodness of fit (R2) values of 0.94, 0.90, and 0.96 for maize, sorghum, and millet, respectively with their corresponding p-value close to 0.0 for all crops show the level of agreement between the country-level simulations and observations (figures 2(a)–(c)). However, aggregated results can mask the regional uncertainties of the model simulations as well as their temporal trends. We then analyzed the temporal dynamics of simulated yields during 1980–2012 and their uncertainty using the SUFI-2 algorithm at the country level, relative to observations. For some regions (South Africa, Kenya, Benin, and Chad) as shown in figure S1, the RSR values are smaller than 2, indicating acceptable yield simulations. The p-factors with values around 0.5 or more in all countries indicate that over 50% of the data is bracketed within the 95PPU band, which is acceptable given the complex nature of the problem (table 2). Furthermore, the r-factor values, representing the width of the 95PPU band, are smaller than 2.5 (table 2), indicating reasonable levels of uncertainty for crop simulations [20].
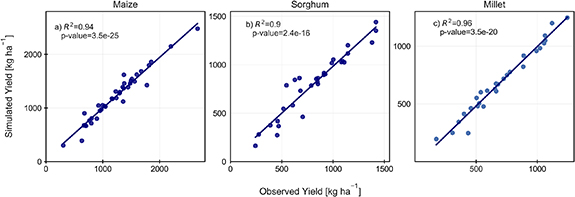
Figure 2. Comparison of the long-term average yields reported by the FAO and simulated yields across SSA countries for (a) maize (in 40 countries), (b) sorghum (in 31 countries), and (c) millet (in 33 countries). Each point represents a country in SSA (i.e. country-level historical and simulated average yields). The observed yields from FAO were de-trended (see text S1 for details).
Download figure:
Standard image High-resolution imageTable 2. Country-level results of the EPIC calibration with the SUFI-2 algorithm based on the RSR, the p-factor, and the r-factor for maize, millet, and sorghum. The results for maize were obtained from Kamali et al [20]. The regional grouping of countries follows FAO's classification.
| Country | Maize | Millet | Sorghum | |||||||
|---|---|---|---|---|---|---|---|---|---|---|
| RSR | p-factor | r-factor | RSR | p-factor | r-factor | RSR | p-factor | r-factor | ||
| Eastern Africa | Burundi | 1.38 | 0.52 | 1.80 | 1.06 | 0.64 | 2.58 | 1.13 | 0.52 | 2.31 |
| Comoros | 1.13 | 0.42 | 1.95 | — | — | — | — | — | — | |
| Eritrea | 1.45 | 0.58 | 1.98 | 1.03 | 0.61 | 1.68 | 1.04 | 0.58 | 1.62 | |
| Ethiopia | 0.91 | 0.52 | 1.81 | 1.18 | 2.34 | 0.54 | 1.20 | 0.52 | 0.83 | |
| Kenya | 0.86 | 0.61 | 1.74 | 1.00 | 0.61 | 1.85 | 1.00 | 0.55 | 1.53 | |
| Madagascar | 1.42 | 0.79 | 2.54 | — | — | — | 1.85 | 0.53 | 1.85 | |
| Malawi | 0.94 | 0.45 | 2.25 | 1.01 | 0.49 | 2.33 | 1.73 | 0.49 | 2.39 | |
| Mozambique | 1.12 | 0.61 | 1.56 | 1.06 | 0.52 | 1.80 | 1.91 | 0.51 | 2.71 | |
| Rwanda | 1.08 | 0.43 | 1.04 | 0.99 | 0.64 | 2.50 | 1.00 | 0.51 | 2.49 | |
| Sudan | 1.33 | 0.48 | 1.05 | 2.11 | 0.52 | 1.68 | — | — | — | |
| Somalia | 1.24 | 0.42 | 1.08 | — | — | — | 1.31 | 0.49 | 2.58 | |
| Tanzania | 1.20 | 0.58 | 0.94 | 1.01 | 0.61 | 1.69 | 1.00 | 0.56 | 1.43 | |
| Uganda | 0.85 | 0.58 | 2.48 | 1.06 | 0.78 | 2.27 | 1.23 | 0.52 | 1.88 | |
| Zambia | 0.89 | 0.45 | 1.31 | 0.96 | 0.51 | 1.98 | 1.62 | 0.54 | 1.99 | |
| Zimbabwe | 1.12 | 0.37 | 1.67 | 0.97 | 0.52 | 1.43 | 1.7 | 0.52 | 2.1 | |
| Central Africa | Angola | 0.99 | 0.88 | 2.38 | 1.13 | 0.54 | 1.59 | — | — | — |
| Cameroon | 1.00 | 0.48 | 1.38 | 1.07 | 0.58 | 2.01 | 1.24 | 0.71 | 2.13 | |
| Central African Republic | 1.16 | 0.49 | 0.74 | 1.08 | 0.80 | 2.53 | 1.07 | 0.45 | 2.48 | |
| Chad | 0.84 | 0.67 | 1.92 | 0.99 | 0.61 | 1.90 | 1.08 | 0.67 | 1.62 | |
| Democratic Republic Congo | 1.63 | 0.48 | 1.05 | 1.10 | 0.77 | 2.38 | 1.15 | 0.77 | 2.03 | |
| Gabon | 1.35 | 0.70 | 1.95 | — | — | — | — | — | — | |
| Republic of Congo | 2.16 | 0.88 | 2.39 | — | — | — | — | — | — | |
| Southern Africa | Botswana | 1.39 | 0.52 | 2.33 | — | — | — | 1.18 | 0.76 | 2.12 |
| Lesotho | 1.27 | 0.42 | 2.45 | — | — | — | — | — | — | |
| Namibia | 1.02 | 0.42 | 1.23 | 1.30 | 0.56 | 2.64 | 1.81 | 0.52 | 2.21 | |
| South Africa | 0.92 | 0.55 | 0.79 | 1.29 | 0.55 | 1.95 | 1.29 | 0.64 | 1.95 | |
| Swaziland | 1.06 | 0.42 | 1.49 | — | — | — | — | — | — | |
| Western Africa | Benin | 1.08 | 0.70 | 1.83 | 1.25 | 0.67 | 1.80 | 1.20 | 0.58 | 1.63 |
| Burkina Faso | 0.97 | 0.52 | 1.07 | 1.07 | 0.67 | 2.56 | 0.79 | 0.88 | 2.73 | |
| Gambia | 0.93 | 0.82 | 2.97 | 1.04 | 0.82 | 2.24 | 1.17 | 0.64 | 2.87 | |
| Ghana | 1.07 | 0.52 | 1.14 | 1.11 | 0.67 | 2.08 | 1.08 | 0.84 | 2.51 | |
| Guinea | 1.96 | 0.45 | 2.02 | 0.93 | 0.94 | 2.71 | — | — | — | |
| Cote d'Ivoire | 1.08 | 0.48 | 1.44 | 1.10 | 0.51 | 2.48 | — | — | — | |
| Mali | 0.98 | 0.55 | 1.55 | 1.04 | 0.80 | 2.30 | 0.98 | 0.76 | 2.00 | |
| Mauritania | 1.18 | 0.61 | 2.25 | 1.15 | 0.50 | 2.04 | 1.15 | 0.80 | 1.93 | |
| Niger | 0.85 | 0.70 | 1.88 | 0.95 | 0.67 | 1.78 | 1.31 | 0.80 | 2.37 | |
| Nigeria | 0.98 | 0.70 | 1.84 | 1.05 | 0.52 | 1.71 | 1.05 | 0.62 | 2.22 | |
| Sierra Leone | 1.09 | 0.53 | 2.07 | 1.48 | 0.74 | 1.86 | 0.99 | 0.49 | 2.10 | |
| Senegal | 0.92 | 0.86 | 2.44 | 1.58 | 0.49 | 1.66 | 1.10 | 0.74 | 1.74 | |
| Togo | 1.26 | 0.52 | 1.18 | 1.03 | 0.51 | 2.38 | — | — | — | |
*RSR: the standardized root mean square error; p-factor: the fraction of the observed data bracketed by the 95PPU band; r-factor: the ratio of the average width of the 95PPU band to the standard deviation of the measured variable.
3.2. Risk of crop yield loss under extreme drought events
Using the SPI and the SSI, we identified the drought events that affected most parts of SSA during 1980–2012. Both indices were consistent with each other, revealing 1983, 1984, 1987, 1992, and 1995 as the drought years. However, there is a slight discrepancy in terms of severity levels (supplementary figure S2). As shown in figure S2, the SSI showed with a higher severity than the SPI for all five drought events. The extreme drought event of 1983 affected all of SSA, but with less severity in eastern Africa. A year later (1984), eastern African countries experienced extreme drought, while the drought in western Africa was less severe than in 1983. The drought of 1987 influenced mostly southern and western Africa. The 1992 drought developed with higher severity in the SSI as compared with the SPI, affecting most regions of SSA particularly with extreme severity in the southern and eastern parts. Another drought event was identified in 1995, mostly affecting central SSA (figure S2).
Next, we looked at the relationship between the drought indices (SSI or SPI) and CSI at the country level for the five identified drought years (figures 3(Aa–o)) and five other randomly selected years of 1996, 1999, 2000, 2006, and 2012 (figures 3(Ba–o)). As shown in figures 3(Aa–o) for five drought years, the relationships between the SSI and the CSI indicate a consistent decrease in crop yields as a result of decreases in SSI values. Overall, the CSI variability could be explained by the SSI drought index to a large extent in all five selected drought years. However, depending on the crop and country, the CSI responded differently to various severities of the drought events. Generally, the correlation coefficient between two indices (r) exhibited higher values for maize and millet than for sorghum, for which the (r) values were lower than 0.5 in all five drought events. The high correlation means that a drought of a specific severity results in a corresponding yield loss of the same severity. However, lower r values indicate that yield losses may also be related to factors other than drought.

Figure 3. The sensitivity of different crops (top row, maize in 40 countries; middle row, millet in 33 countries; bottom row, sorghum in 31 countries) to (A) the five most extreme drought events of 1983, 1984, 1987, 1992, and 1995 and (B) in five randomly selected years (i.e. 1996, 1999, 2000, 2006, 2012) during study period. Each point denotes a country. The background colors represent the severity of YRisk obtained from joint probability densities. See figure 1 for more information. p and r show the p-value and correlation coefficient between SSI and CSI.
Download figure:
Standard image High-resolution imageIn 1983, for example, the correlation coefficient values were 0.71 for maize and 0.70 for millet, whereas it was only 0.41 for sorghum. Analyzing the relationship between the SSI and the CSI at the country level also indicated different responses from one region to the other. For instance, in 1984 eastern African countries exhibited higher CSI values under the influence of the SSI (figures 3(Ag) and (Ai)), meaning that the drought that year resulted in less yield reduction. A similar pattern emerged for the western African countries in the same year. This implies that the occurrence of a drought event of similar severity may not necessarily lead to the same magnitude of yield reduction. The relationship between the SPI and the CSI during these drought years shows comparable trends, but with different r values (supplementary figure S3). We further, investigated the feasibility of the proposed approach in five randomly selected years (i.e. 1996, 1999, 2000, 2006, and 2012) throughout the study period (figures 3(Ba–o) and supplementary figures S3(Ba–o)). Comparing drought years with non-drought years show that both SPI and SSI can clearly distinguish the events from each other. It is also the case for the regional drought events, for instance, in the year 2000 some eastern African countries were experiencing severe to extreme droughts with high to very high YRisk while other African countries were in a better condition in terms of SSI and SPI with low to very low YRisk level (figures 3 and S3 ((Bc), (Bh), (Bm))). However, under moderate drought to moderately wet conditions (SPI or SSI between −0.99 and 0.99), CSI varies in a wider range and the correlation coefficient (r) between drought indices and CSI are low, again implying the importance of other factors in the yield production during these conditions.
We then looked at YRisk (equation 4) at the grid cell level for the whole SSA. The results for the drought years (figure 4(A)) and randomly selected years (figure 4(B)) showed that YRisk varied substantially by location, crop, and year. For example, the drought of 1984 resulted in a high risk of sorghum loss in almost all western African countries, while the risk of maize yield loss was higher for the Sahel countries (of western Africa) than for the other western African countries. Similar differences among different crop drought risks were seen in 1983, where YRisk for millet was slightly lower. By visually comparing the spatial distribution of risk severity (figure 4(A)) with drought severity (figure S2), a strong correspondence between the occurrences of drought and yield reduction emerged. This is also found in the case of regional droughts, for instance in the year 2006, the western countries were experienced drought with high to very high YRisk (figures 3 and 4((Bd), (Bi), (Bn))). However, the levels of severity varied remarkably in both cases, confirming the appropriateness of applying spatially distributed and probabilistic approaches in analyzing the drought effects on crops.

Figure 4. Spatiotemporal patterns of risk of crop loss due to drought (YRisk) during (A) the selected extreme drought events (i.e. 1983, 1984, 1987, 1992, and 1995) and (B) in five randomly selected years (i.e. 1996, 1999, 2000, 2006, and 2012) for the three crops (top row, maize; middle row, millet; bottom row, sorghum). Countries and regions with 'no data/no related crop distribution' are left blank.
Download figure:
Standard image High-resolution imageThe shape of the kernel density functions was compared for the three crops (figure 5), exhibiting variable shapes depending on the crop and country. As shown in figure 5, for the sorghum crop there is a shift in the density function to the left side, revealing a higher risk of yield loss due to drought compared to other crops. The higher risk of drought for sorghum (compared to the other two crops) was more evident in countries like the Central African Republic (Central Africa), Gambia, Ghana, and Somalia than in the rest of SSA. In most countries, we also see elongated tails on the left side compared to the right side, which confirms the higher probability of YRisk with higher density.

Figure 5. Country-level normalized histograms (bars) and non-parametric kernel density plots (lines) of crop drought risk for maize, millet, and sorghum during 1980–2012. The black dashed vertical lines show the middle boundary between 'moderately low' and 'moderately high' severities of YRisk defined in table 1.
Download figure:
Standard image High-resolution image3.3. Understanding the drivers of crop drought risk
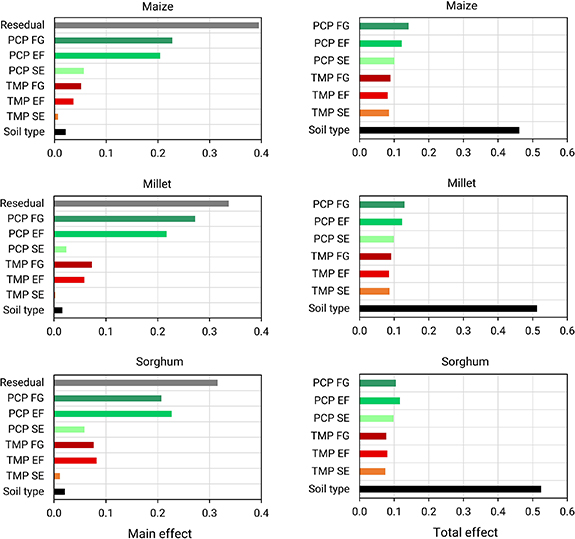
Next, we conducted a decomposition analysis based on the main and total effect indices for the three crops during drought years to understand which of the seven factors considered here contributed the most to the risk of yield loss under drought conditions. The results show that factors contributing to the level of risk were the same for all three crops, but their relative contributions varied slightly from one crop to another (figure 6). Generally, the amount of precipitation during vegetation and grain filling, i.e. PCPEF and PCPFG, contributed the most to YRisk. The relative contribution of temperature during vegetation and grain filling, i.e. TMPEF and TMPFG, were highest for sorghum, followed by millet and maize, respectively. The results for the total effect showed higher interactions of soil type with precipitation and temperature variables (figure 6).
Figure 6. Main effect (left column) and total effect (right column) of the seven factors (i.e. soil type, TMP SE: average temperature from sowing to emergence, TMP EF: average temperature from emergence to flowering, TMP FG: average temperature from flowering to grain filling, PCP SE: precipitation from sowing to emergence, PCP EF: precipitation from emergence to flowering, PCP FG: precipitation from flowering to grain filling) contributing to the risk of maize, millet, and sorghum yield loss under drought.
Download figure:
Standard image High-resolution image
4. Discussion and conclusions
This paper linked agro-ecosystem modeling with a Copula-based probabilistic framework to explore the spatiotemporal dynamics of crop loss risk under drought situations in SSA. We evaluated the performance of a crop model in replicating historic year-to-year maize, millet, and sorghum yields (1980–2012), simulating yield variability based on country-level yield data from the FAO. One new aspect of this study was the country-level adjustment of the model parametrization during calibration. Although the FAO's yield datasets are subject to some uncertainty, as some data values originated from data imputation or unofficial data sources [61], to the best of our knowledge, it is still the best source of accessible long-term data across SSA. However, due to this limitation, the model was not tested for external data. So, any interpretation of results for future prediction should consider this aspect. As a complementary step to model evaluation [62], we quantified the uncertainty associated with the modeling process (i.e. input data and model parameters) for each country and year by using the SUFI-2 procedure for calibration. This approach enabled us to understand which conditions (e.g. location, year) led to relatively small or larger uncertainty levels in crop yield predictions [63] or estimated crop loss risk in follow-up analysis.
All this notwithstanding, some crop modeling studies have reported much better model performance by using harvested area data [64]. Such crop-specific data, however, were only available for specific areas and over short periods. Besides, as reported by previous studies [65], unreliable information for operation parameters in developing countries is another source of discrepancies. Although a direct comparison with outcomes from different studies was difficult—mostly due to substantive differences in input datasets, the timespan considered, and the data used for evaluation—our results were consistent with previous modeling efforts in SSA. Sultan et al [61] reported good performance of the SARRA-H model in simulating sorghum and millet yield anomalies in West Africa compared with FAO data; however, they reported relative changes in yield rather than absolute values because of overestimations in crop-yield values. Folberth et al [66] used a combination of FAO and harvested area data in the evaluation of EPIC model performance and obtained a coefficient of determination (R2) of 0.25 across all SSA countries, but achieved a much higher value of R2 (∼0.5) by excluding countries with reported yield from the FAO. Overall, in this study, the model reasonably reproduced annual yield variability for the three crops under consideration. However, there were discrepancies between simulated and reported yields due to a wide range of reasons, including assumptions, model simplifications, the quality of the reported yield data, and uncertainty in input datasets (such as soil and land use). This indicates that the probability based risk analysis in this paper is tightly associated with the quantified uncertainty for the simulated yield data. Therefore, any interpretation from risk analysis should be accompanied by these data and take into account this aspect.
The identified droughts using SPI and SSI are consistent with literature. For example, the drought in 1992 is consistent with Chikoore [67] who used a precipitation-minus-evapotranspiration anomaly index and found that the 1992 drought was the most severe drought over southern Africa in that period. We also found the outperformance of soil moisture-based index over precipitation-based index in our analysis. This corroborate the results of Rigden et al [51] and Svoboda and Fuchs [68] in which the suitability of soil moisture for crop yield prediction are emphasized.
Based on the Copula-based analysis of crop yield loss due to drought, we found substantial differences among the yield responses of maize, millet, and sorghum to different levels of drought severity (figure 3(A)). Moreover, the spatial response of crop yield to the five drought events across SSA (figure 4(A)) demonstrated that a drought of a given severity may lead to a different level of yield loss risk for the same crop in other agro-ecological conditions, indicating the importance of a probability assessment. Beillouin et al [69] also reported that extremes in climate variables had varying impacts on yield production across different parts of Europe. This implies that the occurrence of a drought event may not necessarily lead to the same magnitude of yield reduction. We found that even under extreme drought conditions, there was often still a considerable amount of crop production, indicating that droughts rarely or never led to a complete yield loss. This suggests that other facets of agriculture, such farmers' management strategies and use of technology to improve soil moisture, may have improved crop resilience to drought.
The results revealed that in general there was a trend of high production (low risk of crop loss) as soil moisture increased (figure 3). However, a closer look at the findings revealed an inconsistent direction in some cases. The drought of 1995 in western African countries is an example of a very wet condition (with the SPI varying around 1.5) leading to a moderately low or severely low yield (with the CSI varying between −0.5 and −1.5) (figure S3(A)). This may partly be due to oxygen deprivation because of soil waterlogging [70] under excessive rainfall/flooding or direct impacts from storms, or flood inundation [71, 72].
Generally, sorghum copes better with drought than maize and millet [73]. Although the regional difference in the presented risk maps supporting this finding in many parts of SSA, some discrepancy especially at country level (figure 5) was discernable. One reason for such behaviors was related to processes representation in the EPIC crop model which is not detailed in terms of carving out difference among crop growths. Basically, EPIC simulates stage growth explicitly and does not distinguish different growth stages for different crops which might lead into various response of crop to specific drought and temperature at specific growth stage. A crop model comparison for future studies is recommended to address those aspects of uncertainty related to model structures and their embedded model processes. Another limiting factor is related to the coarse resolution data with huge uncertainty available for SSA. For country level calibration and analysis, we aggregated the results based on cultivated area in each grid for each crop. These values do not have sufficient accuracy and vary from one crop to the others. Over the past few decades, agricultural efforts in SSA mainly have been focused on increasing the production of few energy-rich cereal crops such as maize and wheat to improve food availability and access. This has resulted in some of the cereal crops being cultivated in less suitable areas [74]. In the case of sorghum, the short maturity period of some of its varieties—as early as 65–70 d after sowing—is another reason for extending its area in less suitable regions where length of rainy season limits crop production [75]. The early maturing varieties of sorghum not only characterized by yield penalty, but with considerable yield loss, up to 87% of grain yield, under drought stress [76, 77]. In addition, literature shows that sorghum show very different drought response to climatic patterns [78]. Therefore, future studies on comparison of different crops to drought should be based on regional datasets which provides information on different cultivars and also model improvement and considering dynamic physiological response of different cultivars to climate. Last but not least, the prolific (deep and dense) root system is one of the main features of sorghum which made it more drought tolerant than other cereals. However, in soils with high bulk density, root penetration might be restricted and consequently, water use might be negatively affected. Considering higher resolution of soil data for future studies can provide a deeper understanding on root response to soil water dynamics.
We performed crop simulations without adding irrigation, since considerable agricultural areas (e.g. 93% of all cropping systems and 97% of maize-cultivated areas) are rainfed in SSA [20, 61]. Here, we also removed the nutrient stress on simulated yields, primarily because of a lack of data, but also because the focus of this study was on water stress. However, future studies may benefit more from the interaction between water stress and nitrogen stress, especially in Sahel regions, where soils are nutrient-deficient due to overexploitation [79]. Under such stress conditions, the agricultural system is less responsive to changes in other variables, such as temperature and moisture [80, 81]. It can also be the case that the marginal benefits from low levels of water stress (due to increased rainfall) are offset by the increased nitrogen stress induced by leaching [16]. Our proposed approach, however, is transferable in this respect, and can be considered a framework to understand the effects of different stresses on crops.
One part of our study included a disentangling of the biophysical factors that contributed most to crop drought risk. The role of temperature was more apparent for sorghum than for maize and millet, which implies a need for future research on the impact of concurrent drought and high-temperature stress on crop failure. EPIC considers neither explicit crop phenology nor atmospheric heat stress, and therefore we could not specify critical temperature and canopy temperature [82] during crop growth stages in this study. One potential future direction would be to improve the crop model to overcome this limitation. Last but not least, one of the limitations of this study was a lack of detailed input data on vegetation development, such as leaf area index, during crop growing seasons at the regional scale. Future studies may benefit from linking ever-increasing satellite information with crop modeling using data assimilation techniques to reduce the level of uncertainty [83–85].
Data availability statements
All country-level yield data used in the current study for sub-Saharan Africa were extracted from FAOSTAT data. All input data for the EPIC model are described in detail in supplementary text S1 and table S1. The code and software used for the current study have been deposited in GitHub, https://github.com/kamaliba.
The data that support the findings of this study are openly available at the following URL/DOI: www.fao.org/faostat/en/#data/QCL.
Conflict of interest
The authors declare that there is no conflict of interest.