

Abstract
How maize yield response to precipitation varies across a large spatial scale is unclear compared with the well-understood temperature response, even though precipitation change is more erratic with greater spatial heterogeneity. This study provides a spatial-explicit quantification of maize yield response to precipitation in the contiguous United States and investigates how precipitation response is altered by natural and human factors using statistical and crop model data. We find the precipitation responses are highly heterogeneous with inverted-U (40.3%) being the leading response type, followed by unresponsive (30.39%), and linear increase (28.6%). The optimal precipitation threshold derived from inverted-U response exhibits considerable spatial variations, which is higher under wetter, hotter, and well-drainage conditions but lower under drier, cooler, and poor-drainage conditions. Irrigation alters precipitation response by making yield either unresponsive to precipitation or having lower optimal thresholds than rainfed conditions. We further find that the observed precipitation responses of maize yield are misrepresented in crop models, with a too high percentage of increase type (59.0% versus 29.6%) and an overestimation in optimal precipitation threshold by ∼90 mm. These two factors explain about 30% and 85% of the inter-model yield overestimation biases under extreme rainfall conditions. Our study highlights the large spatial heterogeneity and the key role of human management in the precipitation responses of maize yield, which need to be better characterized in crop modeling and food security assessment under climate change.
Export citation and abstract BibTeX RIS

Original content from this work may be used under the terms of the Creative Commons Attribution 4.0 license. Any further distribution of this work must maintain attribution to the author(s) and the title of the work, journal citation and DOI.
1. Introduction
Crop production is vulnerable to mean and extreme meteorological changes (Schlenker and Roberts 2009, Li et al 2019, Lesk et al 2020). It is reported that climate variability and extremes together accounted for nearly half of yield variability in North America and globally (Ray et al 2015, Zampieri et al 2017, Kukal and Irmak 2018, Vogel et al 2019). Climate-induced yield fluctuations in the United States (US), which share the largest global maize production (∼30%), would have significant implications for the global food market (Kukal and Irmak 2018, Tigchelaar et al 2018). Hence, a mechanistic understanding of how maize yield responds to ambient climate is instrumental for predicting yield changes, ensuring food security, and developing effective adaptation measures under climate change (Lobell et al 2013, 2014, Troy et al 2015, Zipper et al 2016, Li et al 2019, Lesk et al 2020).
Existing observational- and modeling- studies indicated a nonlinear yield response to temperature where yield declines when ambient temperature deviates from an optimal threshold for crop growth (Bassu et al 2014, Ray et al 2015, Lobell and Asseng 2017, Li et al 2019, Partridge et al 2019, Wang et al 2020). Such a nonlinear temperature response, inherited from plants' physiological processes, is critical for process-based crop models (Luo 2011). The improved characterization of it has been proven to be effective in reducing the error of crop yield simulation (Wang et al 2017b, 2020). In contrast to the well-established temperature response, which is considered to be the determining factor for future yield change (Lobell and Asseng 2017), crop yield response to precipitation (i.e. including precipitation variability and extreme events) is much more uncertain and yet received comparatively less attention (Rosenzweig et al 2002, Lobell and Asseng 2017, Li et al 2019). Mechanistically, precipitation response of crop yield is more complicated and heterogeneous as it reflects the integrated outcome of multiple plant physiological, biochemical, and soil hydrological processes (Li et al 2019). In fact, crop yield change induced by precipitation is of similar magnitude to that by temperature (Li et al 2019). However, the inadequate knowledge of precipitation response and its poor characterization impede the performance of crop models, leading to substantial yield overestimation under extreme rainfall conditions (Rosenzweig et al 2002, Li et al 2019). This hinders the credibility of crop yield forecasts, future projections, and the consequent decision-making of adaptation strategies, given that extreme climate events are expected to become more frequent, more intense, and longer-lasting (Meehl and Tebaldi 2004, Lesk et al 2020). Therefore, large-scale observational constraints would now be required to improve precipitation response characterization to reduce the uncertainty in process-based crop models.
The available observational evidence of maize yield response to precipitation mainly relies on field experiments at plot scale (Hardjoamidjojo et al 1982, Shaw and Meyer 2015) or statistical data over large regions as a whole (Agnolucci et al 2020), while paying less attention to spatial variations in yield response potentially caused by different climate conditions (Kukal and Irmak 2018), management practices (Kukal and Irmak 2020), and soil properties (Evans and Fausey 1999, Huang et al 2021) at fine-scales. A complete picture of how maize yield in the US responds to precipitation over a large spatial scale is lacking, and how it is altered by natural and human factors is unclear (Troy et al 2015, Li et al 2019). Here we hypothesize that the crop yield response to precipitation reflects the interactive effects of these factors. It is primarily determined by natural water availability constrained by climate conditions and mediated by irrigation, soil drainage, and other hydrological factors (Troy et al 2015, Li et al 2019). Moreover, how well current crop models represent precipitation response of crop yield is yet to be evaluated. As an extension to Li et al (2019), in this study, we provided a spatial-explicit quantification of maize yield response to precipitation in the contiguous US, focusing on response function and spatial variations to understand how precipitation response varies under different climatic and irrigation conditions. The observed precipitation response was then compared with crop models from Agricultural Model Intercomparison and Improvement Project (AgMIP) (Rosenzweig et al 2013a, Müller et al 2017) to evaluate models' performance and provide guidance for model improvement.
2. Data and methods
2.1. Data
2.1.1. Statistical maize yield data
The county-level maize yield and harvest area data from 1980 to 2018 across the continental United States were obtained from the National Agricultural Statistics Service (NASS) of the United States Department of Agriculture (USDA). We chose this period for our analysis to ensure a high yield and climate data quality and match the time range of AgMIP crop simulation data. The yield data by NASS are generated from area surveys conducted at randomly sampled fields from remotely sensed harvest regions and farmer surveys with phone, interview or mail etc using list and area-frame method (USDA 2014, 2016, NASS 1999). This dataset has been widely used in agriculture and climate-related research and is considered the most reliable statistical crop data in the US (Lu et al 2017). Irrigated and non-irrigated maize yields were reported separately in some states, for example, Montana, Wyoming, Colorado, New Mexico, Nebraska, North Dakota, South Dakota, Kansas, and Texas. For other states, we used an irrigation fraction threshold of 0.2 (calculated as the irrigated area divided by cropland area from agriculture census data of 2012) to separate irrigated (>0.2) and rainfed yields (<0.2) of each county. The threshold was determined empirically to minimize the irrigation effect while retaining enough rainfed samples. When comparing rainfed and irrigated yield responses from observation, we only used data from states with irrigated and non-irrigated yields reported separately to ensure the robustness of the results. Noting that irrigation here only indicates whether crops received irrigation or not, and it does not mean irrigated crops are free from water stress.
2.1.2. Parameter-elevation Relationships on Independent Slopes Model (PRISM) climate data
The climate data used to quantify the precipitation response of maize yield from observation were the monthly gridded PRISM at a spatial resolution of 4 km (Daly et al 2008). The gridded PRISM data were aggregated to county level using the 'mean' reducer of the 'reduceRegions' function on Google Earth Engine (GEE) to match the spatial scale of yield data. The growing season of maize was defined from May to August.
2.1.3. Maize yield simulation data from crop models of AgMIP
The simulated maize yields from 1980 to 2010 at 0.5° were from 12 models from the Global Gridded Crop Model Intercomparison (GGCMI) outputs in the AgMIP. The 12 models were CGMS-WOFOST, CLM-Crop, EPIC-BOKU, EPIC-IIASA, GEPIC, LPJ-GUESS, LPJmL, ORCHIDEE-crop, pAPSIM, pDSSAT, PEGASUS, and PEPIC. Different experiments were available for these models including purely rainfed (noirr), fully irrigated (firr), fertilizer inputs (fullharm), and unlimited nutrient supply (harmnon) (Müller et al 2017). Similar to the statistical irrigation yield data, the full irrigation experiment in the models does not necessarily imply the absence of water stress. All model simulations were driven by the AgMERRA forcing data (Müller et al 2017), and precipitation from AgMERRA was used to quantify the simulated yield response to precipitation.
2.1.4. Precipitation projection data from Coupled Model Intercomparison Project Phase 6 (CMIP6)
The precipitation simulation datasets at 0.5° were from a multi-model ensemble mean of 16 global climate models (table S1 (available online at stacks.iop.org/ERL/17/014016/mmedia)) in the CMIP6 archive. The 0.5° data were obtained by bi-linearly interpolating the raw outputs. The CMIP archive includes climate simulation data for the historical period (1901–2014) and future (2015–2099) under different scenarios (SSP1-2.6, SSP3-7.0, and SSP5-8.5) (Fan et al 2020). We chose SSP5-8.5 to represent a high-emission (or business-as-usual) scenario. To remove potential systematic bias in precipitation simulation, we calculated the multi-year mean precipitation difference between PRISM and CMIP6 for the baseline period (1980–2018) and added it to CMIP future projections to get the 'bias-corrected' future precipitation data. The bias-corrected data after mapping to county-scale were used to estimate the potential risk of exceeding optimal precipitation threshold in the future.
2.1.5. Soil drainage class data
The 800 m soil drainage data were developed by California Soil Resource Lab of UC Davis and were available at https://casoilresource.lawr.ucdavis.edu/soil-properties/download.php. The dataset provides seven drainage classes with a descending drainage ability order from '1-Excessively drained', '8-Well drained', '2-Moderately well drained', '4-Somewhat excessively drained', '5-Somewhat poorly drained', '3-Poorly drained', to '7-Very poorly drained'. The gridded drainage class was then aggregated to county-level using the mode function in GEE.
2.2. Methods
2.2.1. Define extreme precipitation conditions
We adopted z-score (equation (1)), here namely the 'standardized anomaly', to quantify the extreme conditions for precipitation (z)
where  refers to growing season precipitation for year t,
  is multi-year mean growing season precipitation, σ refers to the standard deviation of growing season precipitation during the study period. This index measures the degree to which precipitation departs from its 'mean' state where positive and negative values denote wet and dry conditions. Excessive precipitation conditions were defined as growing season precipitation larger than 2σ at each county.
2.2.2. Estimate yield anomaly
The observed maize yield presented an increasing trend due to technological and management factors (e.g. the use of chemical fertilizers), and long-term climate change (e.g. rising atmospheric CO2) (Lu et al 2017). To remove the long-term trend in yield that is not related to climate variability, a trend estimated based on a locally weighted regression model (LOWESS) for each county was subtracted from the original yield to get yield anomaly. The LOWESS method can automatically capture the characteristics of non-linear and non-stationary time-series data and provide a good trend fitting for crop yield (Lu et al 2017). We applied the LOWESS function with default setting (f = 2/3, iter = 3) for each county separately using the 'stats' package in R programming language. Maize yields from crop models were detrended using the same method. The yield detrending measure is equivalent to controlling the time-varying effect in statistical models.
2.2.3. Classify maize yield response to precipitation
According to prior knowledge, maize yield response to precipitation can be categorized into three main types that are, linear, non-linear, and unresponsive. At each county, we constructed linear (equation (2)) and quadratic polynomial regression models (equation (3)) based on the time-series of growing season precipitation (independent variable X) and yield anomaly (dependent variable Y) and used their estimated coefficients and statistical levels to identify response types:


where a is the estimated intercept to control the county fixed effect, and b and c are estimated coefficients used to characterize the yield response types. Specifically, (a) if the linear slope (b) in equation (2) is statistically significant at 0.05 level, the yield response to precipitation can be categorized into linear type and the sign of slope coefficient determines whether it is linear increase (b> 0) or decrease (b< 0); (b) if the quadratic slope (c) in equation (3) is statistically significant at 0.05 level, the yield response to precipitation can be categorized into nonlinear type and the sign of slope coefficient determines whether it is U-shape (c> 0) or inverted-U shape (c< 0), and the inverted-U type gives the optimal precipitation threshold which corresponds to the maximum yield as equation (4):

where a and b are coefficients from equation (3). (c) if both the linear slope (b) in equation (2) and the quadratic slope (c) in equation (3) are statistically significant at 0.05 level, the response type is categorized as nonlinear because the higher-order regression can better fit the yield-precipitation relationship than the linear one; (d) if neither the linear slope (b) in equation (2) and the quadratic slope (c) in equation (3) are statistically significant at 0.05 level, the response type is categorized as unresponsive. Here we only included precipitation variables in the time-series regression models to better characterize the precipitation response of yield, because we found including both precipitation and temperature variables would lead to reduced yield sensitivity to precipitation and distorted precipitation responses due to the collinearity between these two (see supplementary discussion). Also, only counties with more than 5 valid yield values were used to fit linear and quadratic polynomial regression models. The majority of counties (71%) have more than 30 valid data points.
2.2.4. Compare precipitation responses between observation and crop models
The classification method (equations (2) and (3)) was first applied to observational yield and PRISM precipitation data to quantify precipitation response of maize yield at county-level. The same method was then applied to crop model simulations and climate forcing data to quantify simulated precipitation response of maize yield at their native 0.5° resolution. To reconcile the different spatial resolutions for comparison, the observational response types at county-level were upscaled to each 0.5° grid box using the majority method based on the harvest area of each county. To compare the crop model with observations, we defined simulated yield bias (ΔYield) as the simulated yield anomaly minus observed yield anomaly. Similarly, we defined the optimal precipitation threshold bias (ΔThreshold) as the simulated optimal precipitation threshold minus the observed threshold.
3. Results
3.1. Responses of rainfed maize yield to precipitation
Responses of county-level maize yield to growing season precipitation (May–August) in the US were classified into five classes, including two linear (increase and decrease) classes representing a linear yield change with precipitation, two nonlinear (inverted-U and U-shape) classes, and an unresponsive class representing no relationship between yield and precipitation. Among them, the inverted-U type is of particular interest to us as it defines an optimal precipitation threshold that corresponds to the maximum yield.
We first quantified the response of rainfed maize to growing season precipitation as it reflects the yield response under natural conditions. Results showed strong spatial variations in the precipitation response types of maize yield (figure 1). Despite a large fraction of counties with unresponsive type (30.39%), the inverted-U (40.28%) and increase (28.64%) were the two leading response types, together accounting for more than 70% of all county samples (n = 2053). The decrease and U-shape types were rare (<1% of the samples) and thus were not the focus in the following analysis. In terms of spatial distribution, the increase type was mostly located in the southeast US (figures 1(a) and (b)), the inverted-U was concentrated in the central US. In contrast, the unresponsive type was scattered throughout the country.

Figure 1. Responses of rainfed maize yield to growing season precipitation based on statistical (observational) data from 1980 to 2018. Spatial pattern (a) and statistics of different precipitation response types (b). Triangles with different colors in panel (a) represent four response types, and the filled colors denote the optimal precipitation threshold for inverted-U response. (c) Distribution of optimal precipitation threshold estimated from the inverted-U response with a labeled mean value in sky blue triangle symbol.
Download figure:
Standard image High-resolution imageWe estimated a mean growing season optimal precipitation threshold of 503 mm from all inverted-U samples in the US. The precipitation threshold was also considerably spatially variant, ranging from 250 mm in drier northern regions to 750 mm in the wetter southern regions (figure 1(c)). These diverse response types and varying thresholds revealed a highly heterogeneous response of maize yield to precipitation at a fine scale. This is also in sharp contrast to the universal response reported in previous studies over a large region (e.g. Schlenker and Roberts 2009, Agnolucci et al 2020).
To further investigate how spatial variations in precipitation responses are linked to background climate, we plotted the occurrences of five response types as a function of growing season mean temperature and precipitation (figure S1). We found that inverted-U mostly lied in moderate space of temperature (19.7 °C–23.1 °C) and precipitation (404–455 mm), a range that encompasses the optimal precipitation to sustain crop growth and achieve the maximum yield (e.g. midwestern US). The increase type was mainly found in relatively hotter (21.0 °C–24.6 °C) conditions, although it had a comparable precipitation range (391–459 mm) to inverted-U (table S2). This denotes the benefit of additional water in a hotter environment (e.g. the southeastern US) where natural precipitation is far below the optimal precipitation needed by the plant.
The optimal precipitation threshold derived from inverted-U response also depended on background temperature and precipitation (figure 2(a)). The threshold generally increased with higher background precipitation, reflecting the fact that existing maize may have already managed to adapt to the local moisture level to achieve its highest yield potential. Interestingly, the precipitation threshold also increased with rising temperature when fixing mean precipitation around 350–450 mm (figure 2(b)). This demonstrates an interactive effect of temperature that higher temperature uplifts the optimal precipitation threshold and broadens the beneficial range of precipitation to maize yield. This is because the large vapor pressure deficit associated with higher temperature increases plant water demand, making maize more tolerable to a higher amount of precipitation. Therefore, the warming-induced optimal precipitation threshold increase may also help reduce the adverse effects of extreme precipitation (Li et al 2019).
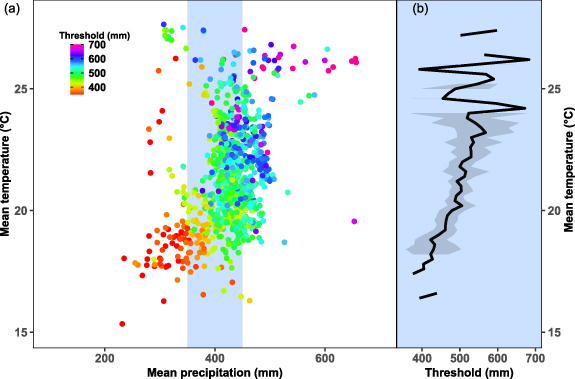
Figure 2. (a) Variations of optimal precipitation threshold for rainfed maize as a function of mean growing season precipitation and temperature during 1980–2018. (b) Relationship between optimal precipitation threshold and mean growing season temperature in the precipitation range of 350–450 mm (i.e. the blue shaded area in panel (a)). The black line in (b) denotes the mean precipitation threshold for each temperature bin at 0.2 °C intervals. The shading area in (b) indicates the confidence interval estimated from the t-test at the 99% level.
Download figure:
Standard image High-resolution imageAdditionally, the mediating effect of soil property is manifested in the relationship between optimal precipitation threshold and soil drainage. Precipitation threshold generally showed an increasing tendency from poorly-drained to well-drained soils across different precipitation ranges (figure S2). This suggests that maize grown in well-drained soil is likely to be more resilient to high precipitation, while it is more vulnerable in poorly-drained soil. It also confirms the benefits of artificial drainage (i.e. tile drainage) in cropland with inadequate soil drainage.
3.2. Comparing precipitation responses between irrigated and rainfed maize
We then examined the precipitation responses of irrigated yield in counties where both irrigated and rainfed maize exist. This ensures that the irrigated and rainfed crops share the same climate conditions so that their different responses indicate the effect of irrigation. Compared with rainfed maize, irrigated yield showed distinctively different precipitation responses with much more unresponsive (69% vs. 26%) and fewer increase (4% vs. 28%) types (figures 3(a) and (b)). The percentage of unresponsive type generally increased in counties with higher irrigation fractions, whereas the percentage of increase type decreased (figure S3). About 72% and 52% of the original increase (65/90) and inverted-U types (73/140) of rainfed maize were converted to unresponsive type under irrigation conditions. These different response types reflect the reduced sensitivity of irrigated yield to precipitation (figure 3(c)) because irrigation can effectively decouple yield from precipitation fluctuations and buffer the impact of climate variability (Troy et al 2015, Zipper et al 2016, Kukal and Irmak 2018, 2020).
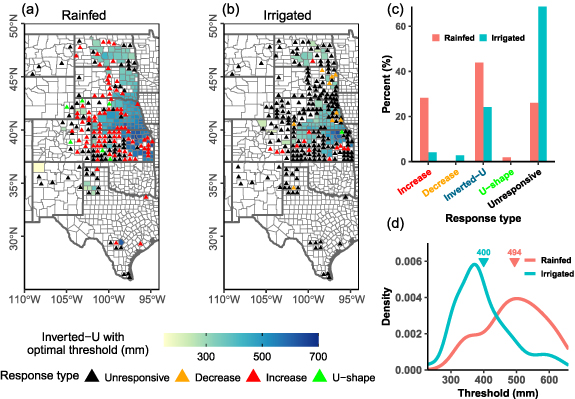
Figure 3. Precipitation responses of maize yield under rainfed (a) and (b) irrigated conditions using statistical data from 1980–2018. (c) Statistics of different precipitation response types and (d) distribution of optimal precipitation thresholds estimated from inverted-U type at counties reporting both irrigated and rainfed yields. The colored triangles in panel (d) labeled the mean optimal precipitation threshold.
Download figure:
Standard image High-resolution imageFor counties with inverted-U type under both irrigated and rainfed conditions, the optimal precipitation threshold was 400 mm for irrigated maize, about 95 mm lower than that of rainfed maize (494 mm) (figure 3(d)). The lower threshold of irrigated maize reflects their lower precipitation requirement due to irrigation water supply and suppressed water demand due to irrigation cooling (Li et al 2020). This result is also consistent with the temperature interaction effect shown in figure 2(b). A lower threshold can be expected when irrigation cooling decreases environmental temperature. However, the lower threshold associated with irrigation may also reduce crop's tolerance to high precipitation and increase their susceptibility to yield loss under excessive precipitation conditions (Li et al 2019). Our analysis indicated that under extreme precipitation conditions (>2σ), irrigated maize experienced a substantially larger yield loss (−20.6%) than that of rainfed maize (−9.4%) (figure S4).
3.3. Comparing simulated precipitation responses of crop models with observations
Taking observational response as a benchmark, we further evaluated simulated precipitation responses of rainfed maize yield from the ensemble mean of 12 crop models of AgMIP (Rosenzweig et al 2013b, Müller et al 2017). While crop models broadly captured the inverted-U type distributed in the northern and central US, which accounted for 34% of samples versus 29% from observation, they showed a widespread increase type throughout the country which did not present in observation (figures 4(a) and (b)). The percentage of increase type in crop models (59%) was substantially higher than that in observation (30%) (figure 4(c)). About 70% of unresponsive and 37% of inverted-U types from observation were misrepresented as increase type in crop models. Moreover, for optimal precipitation threshold derived from locations where inverted-U responses existed for both observation and models, the crop model ensemble indicated a threshold (594 mm) about 90 mm higher than that from observation (505 mm) (figure 4(d)).

Figure 4. Precipitation responses of rainfed maize yield in (a) observation and (b) crop model ensemble of AgMIP during 1980–2010. (c) Statistics of different precipitation response types and (d) distribution of optimal precipitation thresholds at grids where both observation and crop models have inverted-U response. The spatial extent of crop models was masked to match the observation. Note that the shorter time period of observational data is to match that of the AgMIP crop model simulations for comparison.
Download figure:
Standard image High-resolution imageThe overestimation in the increase response type and precipitation threshold was evident in individual crop models. The percentage of increase type varied in a range of 25.6% (PEGASUS) to 72.2% (ORCHIDEE-crop), whereas the optimal precipitation threshold varied from 547 mm (EPIC-BOKU) to 704 mm (LPJmL). The large spread in precipitation responses across crop models demonstrated the inaccurate simulation of precipitation responses that might result from underrepresentation of mechanisms associated with excessive water such as root damage, nitrogen deficiency, toxicities due to low soil oxygen, delayed planting, damage from harsh weather, as well as increased susceptibility to disease (Li et al 2019). These misrepresented responses will likely negatively affect the performance of crop models.
In addition to rainfed experiments, we also analyzed precipitation response with alternative experiments including full irrigation, fertilizer inputs, and unlimited nutrient supply. Similar to observation, irrigation in crop models reduced yield sensitivity to precipitation relative to rainfed conditions, as represented by the higher percentage of unresponsive type from 20% to 63% and lower optimal threshold from 557 mm to 440 mm. The fertilizer and nutrition supply experiments produced similar results to rainfed experiments, suggesting a minimal impact of these factors on the precipitation response of yield (figure S5).
3.4. Yield overestimation of crop models under extreme wet conditions
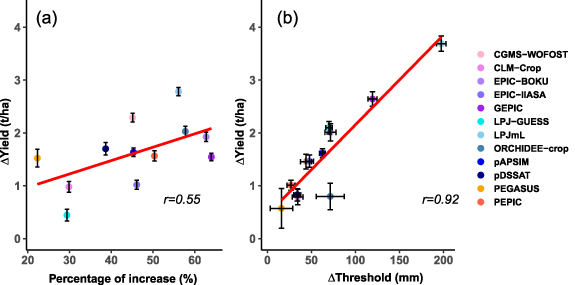
The misrepresented precipitation response in crop models, identified as overestimation in both increase type and optimal threshold, would lead to a continuous yield increase with higher precipitation (instead of a decline shown in observation data) and therefore yield overestimation under extremely wet conditions. To test this hypothesis, we analyzed the simulated yield bias (ΔYield) of rainfed maize under excessive precipitation conditions as a function of the percentage of increase type and bias in optimal precipitation threshold (ΔThreshold). We found a positive relationship (r = 0.55) between the increase percentage and ΔYield across all models (figure 5(a)), suggesting a higher percentage of increase type in a model led to a too high yield, and thus a more significant yield overestimation. Strikingly, the relationship between ΔThreshold and ΔYield was even stronger (r = 0.92). This means that 85% of the spread of yield bias can be explained by the precipitation threshold overestimation (figure 5(b)). For example, the PEGASUS model with the smallest threshold bias (16 mm) also had minimal yield overestimation (+0.57 t ha−1). By contrast, the LPJmL model with the largest threshold bias (198 mm) also had the largest yield overestimation (+3.69 t ha−1). Hence, our results support that misrepresented precipitation responses in crop models are responsible for the yield overestimation under wet conditions and demonstrate the key role of the optimal threshold in determining the yield response to precipitation.
Figure 5. Yield simulation bias (ΔYield) of rainfed maize under extreme precipitation conditions as a function of the percentage of increase (a) and bias in optimal precipitation threshold (ΔThreshold) across 12 crop models at grids with mismatched responses between observation and crop models. The mismatched grids for panel (a) are those observational responses misrepresented as increase by crop model, and for panel (b) are those optimal precipitation thresholds overestimated by crop models. The error bars denote standard error in each crop model.
Download figure:
Standard image High-resolution image
4. Discussion
4.1. The interactions of physiological and environmental processes in the precipitation responses
Our study demonstrates a highly heterogeneous response of maize yield to precipitation across the US. The precipitation response of yield reflects the integrated effect of different physiological and environmental processes of crop growth and yield formation and their responses to water availability. During the growing season, the different precipitation responses originate from the dynamic balance between crop water demand and supply, which can be understood from a perspective of optimal precipitation threshold—a comprehensive diagnostic measure to represent such dynamics over a long-term period. Under drier or hotter conditions when precipitation is below the optimal precipitation threshold crops needed to fulfill their water demand, an increase in precipitation could alleviate water stress and boost yield. Maize yield under these circumstances would show a linear increase response to precipitation. The yield continuously increases with higher precipitation until it reaches an optimal threshold, after which water supply surpasses crop water demand and excessive water begins to stress yield. The inverted-U type, typically found under moderate wet conditions, captures this non-linearity since the optimal threshold is encapsulated within the range of precipitation variability. The unresponsive type occurs when water is not a major limiting factor for crop growth. For example, yield in irrigated or cooler regions (e.g. in the north in figure 3(b)) could be insensitive to precipitation, or its response to precipitation is too weak to be detected at a certain significance level. Crop yield variability, in this case, would be controlled by other critical factors of crop growth such as temperature and solar radiation (Muchow et al 1990, Grassini et al 2009, Carter et al 2016, Lobell et al 2021, Ojeda et al 2021), and management factors such as planting date (Ojeda et al 2021). Additionally, a high pre-growing season water availability could exacerbate the subsequent yield loss under extreme precipitation conditions but alleviate drought impact, and the opposite is true for a low pre-growing season water availability (Li et al 2019). Soils with high plant available water capacity (PAWC) could moderate crop precipitation response compared with low PAWC (Wang et al 2017a).
4.2. The linkage between precipitation responses and extreme precipitation impacts
The regional variations in the precipitation response of maize yield offer new insights to understand the impacts of extreme precipitation. It has been reported that excessive rainfall can have either a negative or positive impact on maize yield, depending on the region (Li et al 2019). In regions where crop yield shows an increase response to precipitation or with high optimal precipitation thresholds, crops could withstand more extreme precipitation without suffering from yield loss (figure S6). Conversely, regions with lower precipitation thresholds (e.g. irrigated crops) are more vulnerable to extreme rainfall at a higher risk of yield loss (figure S4). Historically, we found 26.5% of county-year samples in our study region experienced growing season precipitation exceeding their optimal thresholds during 1980–2018 (figure S7), implying a potential risk of yield loss due to high precipitation. This potential risk would increase to 34.0% of county-year samples in the future (2020–2050) under the high-emission scenario (SSP5-8.5) of the CMIP6 multi-model ensemble when assuming unchanged crop planting patterns and yield response types.
4.3. Implications for climate change adaptation
The heterogeneous precipitation responses with their own distinct climate space allow for the possibility of adaptation to climate change, for example, by changing management practice to limit the exposure to adverse climate conditions, developing new crop insurance programs, and migrating crop types to make use of favorable climate (Sloat et al 2020). For droughts, irrigation effectively mitigates water stress, increasing and stabilizes yield regardless of precipitation variations (Zaveri and Lobell 2019, Kukal and Irmak 2020). However, the feasibility and sustainability of current and future irrigation practice is uncertain due to constraints from changing water resource availability (Rosa et al 2018, DeLucia et al 2019) and other social, economic, and political issues (Grassini et al 2011, Kresovic et al 2014). The accurate representation of precipitation response of maize yield in crop models is essential to better predict crop yield losses caused by extreme climate. It also assists design novel insurance policies to compensate farmers' losses at finer scales (Perry and Yu 2020, Diffenbaugh et al 2021). For example, the emerging weather index insurance established by linking weather conditions (mainly precipitation-related index) and yield losses has been demonstrated to be a cost-efficient way to improve drought risk management (Dalhaus et al 2018, Bucheli et al 2021, Vroege et al 2021). For extreme precipitation, one might consider migrating susceptible crops to regions with higher optimal precipitation thresholds. However, such migration may not necessarily benefit yield because regions prone to extreme precipitation impact (with lower precipitation thresholds) could also be more productive (e.g. Midwest US) than regions with higher thresholds (e.g. southern US). Among different precipitation response types, the highest yield appeared in inverted-U (7.8 t ha−1), followed by decrease (7.5 t ha−1), unresponsive (6.3 t ha−1), increase (6.0 t ha−1), and U-shape responses (5.3 t ha−1) (figure S8). Therefore, crop migration should take into account the trade-offs between resilience and yield, as well as other factors. Alternative measures such as improving drainage or changing crop variety are also viable options to adapt to extreme rainfall impacts. Future warming is expected to expand the tolerance to precipitation due to elevated precipitation threshold and lead to more increase type due to higher evaporation demand, both of which may reduce the risk of extreme precipitation. Noting that the optimal precipitation threshold here corresponded to the growing season total and did not consider seasonal variations in precipitation sensitivity of crop yield (Butler 2020). In reality, crop yield sensitivity to water varies with growth stages. For example, water stress in reproductive stages (e.g. silking) and excessive water in early vegetative stages would lead to a greater yield reduction than other stages (Li et al 2019). Besides, how the shifted seasonal distribution and amplified intensity of precipitation in the future affect crops' precipitation response requires further investigation. A recent study indicated that precipitation of different intensities could have varied impacts on crop yields: crop yield decreased in response to drizzle and rare rainfall extremes while benefiting from heavy rainfall (Lesk et al 2020).
4.4. Implications for process-based crop model improvement
We show that the analyzed 12 crop models from the GGCMI of AgMIP could not capture the observed yield responses to precipitation in the US. The misrepresented responses in crop model lead to poor model performance under excessive rainfall conditions with substantial yield overestimation. This is mainly due to the lack of accurate representation of multiple biological and chemical mechanisms associated with excessive water in the model, including root damage, nitrogen deficiency and toxic substances under hypoxic conditions, delayed planting, and increased susceptibility to disease (Li et al 2019). Therefore, incorporating these processes in crop models is key to improving models' characterization of precipitation response. Future modeling work should focus on developing empirical or mechanistic constraints to yield interaction with excessive soil water, for example, by adopting stress‐day approach (Kanwar 1988), damage function of root growth (Rosenzweig et al 2002), or the three‐stage empirical representation of waterlogging (Shaw and Meyer 2015). Besides, the spatial aggregation involved in producing statistical yield data and crop yield simulation may also contribute. The county-level statistical yield data are aggregated from individual farms within a county (NASS 1999) whose representativeness depends on sampling and yield heterogeneity. The gridded yield data from crop model simulations are typically driven by aggregated input data at a given spatial resolution, which may lead to systematic biases under coarse resolutions (Hoffmann et al 2015, Zhao et al 2015, Hoffmann et al 2016, Ojeda et al 2020). Such spatial aggregation issues could be mitigated by our use of yield anomalies instead of raw yields. Moreover, crop models incorporating updated representations of natural and management factors (e.g. soil property, artificial drainage, groundwater table depth, etc) with higher temporal and spatial resolutions (Zhao et al 2015), and improved phenology (Peng et al 2018) are beneficial for better capturing the spatially heterogeneous and seasonally varying (across different growing stages) yield responses to stressors (Li et al 2019).
5. Conclusion
This study revealed highly heterogeneous precipitation responses of maize yield in the US and advanced our understanding on their underlying complex interactions among climate, human, and environmental factors. The proposed quantification method is flexible to be applied to other crop types and climate variables. The large-scale observational benchmark and constraints from our results also guide future model improvement. Given that future precipitation change is highly uncertain compared to temperature, an unbiased yield response to precipitation in crop models that consider primary natural and human factors is essential for robust crop yield predictions/forecasts and climate change risk assessment.
Acknowledgments
This study is supported by the National Key Research and Development Program of China (No. 2017YFA0604701), and the Fundamental Research Funds for the Central Universities. R X is supported by the Postdoctoral International Exchange Program. We thank Dr Jingyi Huang for providing the soil drainage data. We would like to thank the high-performance computing support from the Center for Geodata and Analysis, Faculty of Geographical Science, Beijing Normal University [https://gda.bnu.edu.cn].
Data availability statement
All data used in this study are publicly available. The codes and data that support the findings of this study are available at Figshare (http://doi.org/10.6084/m9.figshare.17048258).
Author contributions
Y L and R X designed the study; R X and Y L performed the data analysis; R X and Y L, analyzed the results, with help from K G, L Z and B P; R X and Y L wrote the manuscript with contributions from all authors. C M provided the CMIP6 precipitation data.