

Abstract
The impact of climate change, rising CO2, land-use/land-cover change and land management on the carbon cycle in terrestrial ecosystems has been widely reported. However, only rarely have studies have been conducted to clarify the impact of climate change and rising CO2 on the carbon sink contributed by ecological restoration projects (ERPs). To better understand the impact of climate change and rising CO2 on ERPs, we took the Beijing–Tianjin Sand Source Control Project zone as an example to set up different scenarios to distinguish the confounding effects of these factors on the regional carbon budget based on a remote sensing data-driven model. Compared with business as usual, our results show that climate change caused a carbon loss of 78.97 Tg C. On the contrary, ERPs contributed a carbon sink of approximately 199.88 Tg C in forest and grassland. Furthermore, rising CO2 also contributed an additional carbon sink of 107.80 Tg C. This study distinguished the individual effects of different factors, and clarified the net carbon sink contributed by ERPs and rising CO2 and their significance for enhancing the regional carbon sink and reversing the adverse effects of climate change on the carbon sink. Furthermore, ERPs can sequester carbon more effectively and faster compared with rising atmospheric CO2 concentration.
Export citation and abstract BibTeX RIS

Original content from this work may be used under the terms of the Creative Commons Attribution 4.0 license. Any further distribution of this work must maintain attribution to the author(s) and the title of the work, journal citation and DOI.
1. Introduction
Terrestrial ecosystems are critical components of the earth system that mitigate CO2 emissions from fossil fuels and the associated global warming (Tian et al 2021). These ecosystems have absorbed ∼30% of anthropogenic carbon emissions from fossil fuels (Friedlingstein et al 2019). In recent decades, ecosystems have suffered serious degradation owing to disturbance by humans and climate change (Mitchard 2018, Santos et al 2020). Previous studies have demonstrated that ecological restoration projects (ERPs) have made a significant contribution to improving depredated ecosystems and enhancing carbon sequestration (Lu et al 2018, Erbaugh et al 2020, Tong et al 2020). Meanwhile, climate change has also had an impact on the carbon cycle and thus affects the improvement of carbon sinkage by ERPs. In addition, rising CO2 has also played a great role in strengthening the carbon sink (Dusenge et al 2019, Walker et al 2021). However, few studies have distinguished the respective impacts of these factors on carbon sinks.
In the past century, economic development and population growth have induced unsustainable land development, and management has caused continuous land degradation and carbon loss. Land-use/land-cover (LULC) change has induced the loss of approximately 205 ± 60 Gt C in the form of emissions into the atmosphere globally from 1850 to 2019 (Friedlingstein et al 2019). Meanwhile, forest fires induced by poor management, insect pests, timber harvesting, fuelwood harvesting and mining caused the loss of 2.03 Pg C in areas without LULC change from 1990 to 2010 (Lai et al 2016). These disturbances offset approximately 32.1% of the forest biomass carbon sink (Liu et al 2020). In recent decades, ERPs have been implemented worldwide on different scales to promote ecosystem quality and prevent ecosystem degradation (Mitchard 2018, Santos et al 2020, Zhou et al 2020a). Measures and practices included in ERPs have increased the area of forest and grassland and promote the quality of current forest and grassland by reducing the disturbance from logging, grazing, pests and diseases (Lu et al 2018, Liu et al 2020). These measures and practices have accelerated photosynthesis to take up more CO2 and induce greater input of soil organic matter from leaf litter and roots (Paul et al 2002, Deng et al 2017, Heinrich et al 2021). In addition, ERPs that have induced increased vegetation coverage have also reduced carbon loss by decreasing soil erosion (Lal 2003, Chirino et al 2006). Among such projects globally, the spatial scale and timespan of China's ERPs are the largest and most well-established (Lu et al 2018). Satellite imagery shows that these ERPs have induced LULC changes and that 42% of the greening of the Earth's surface in recent decades has occurred in China (Chen et al 2019). Furthermore, China's ERPs have been reported to contribute over half of the regional ecosystem carbon sink (Lu et al 2018), and in forests approximately a quarter of the carbon sink can be attributed to optimized management (Liu et al 2020). Planted trees will sequester more carbon with aging in later decades (Mora et al 2018). The continuing increase in height and leaf amount promotes them to take up more CO2 with the passage of time (Larjavaara 2014, Stephenson et al 2014). Thus, ERPs will make a greater contribution to the carbon sink in later years. In grassland, comprehensive measures including enclosure, light grazing and grazing exclusion implemented in grassland have also been reported to be effective practices to restore degraded grasslands and improve the carbon stock (Hu et al 2016, Deng et al 2017, Yu et al 2019). Although carbon costs and leakage will offset part of the carbon sink contributions from ERPs, these negative effects gradually weaken as newly planted vegetation grows (Liu et al 2019).
In addition, climate change has become one of the most critical driving factors changing the carbon cycle (Sleeter et al 2019, Pan et al 2020). The carbon sequestration contributed by ERPs certainly suffers from the unignorable positive or negative effects of climate change. Global climate warming has caused the average land surface air temperature to rise by 1.31 °C–1.51 °C between 1880 and 2019 (IPCC 2019). This change probably shortens the turnover time of carbon in land ecosystems and causes more uncertainties in estimates of carbon sequestration (Carvalhais et al 2014). In tropical areas, rising temperatures and reduced precipitation have led to a die-off of forests and increased carbon emissions (Mitchard 2018). In mid- and high-latitude areas, rising temperatures can prolong the growth period of vegetation, allowing the absorption of more CO2 (Post et al 2018). Unexpectedly, these effects are probably limited due to the availability of nitrogen and phosphorus (Wieder et al 2015). In addition, a warming climate may increase soil respiration, accelerating decomposition by soil microorganisms and causing more carbon loss, especially in arid and semiarid zones (Ren et al 2020, Xu et al 2015, Pan et al 2020). A warmer and drier climate may cause severe drought, which leads to more wildfires and insect pests (Chen et al 2020, Quan et al 2019, Lasslop et al 2020, Anderegg et al 2020). These changes probably cause a decline in the growth and survival rates of vegetation (Schlaepfer et al 2017, Cao et al 2018). Therefore, it is still uncertain whether climate change is beneficial or harmful for strengthening the carbon sequestration effect.
Rising CO2 has also been demonstrated to increase leaf-scale photosynthesis and intrinsic water-use efficiency to improve productivity (Walker et al 2021). It was deemed to be the decisive factor that has driven the significant increase in the carbon sink of global terrestrial ecosystems in recent decades (Zhu et al 2016, Wang et al 2020). However, prior studies found a declining response of the rate of vegetation carbon uptake to CO2, probably suggesting that the positive effect of increasing CO2 on the vegetation carbon sink would decrease (Peñuelas et al 2017, Wang et al 2020). Thus, whether rising CO2 will continue to promote the carbon sink in the future is uncertain.
To quantify the impact of climate change, rising CO2 and ERPs on carbon sequestration in areas where ERPs have been undertaken, a case study was conducted in the Beijing–Tianjin Sand Source Control Project (BTSSCP) zone. The BTSSCP zone is in an arid and semiarid region that is sensitive to climate change and rising CO2 which provided us with a suitable area to conduct our research. The goals of this study are (a) to understand the temporal–spatial dynamics of carbon sinks in the BTSSCP zone and (b) to analyze the respective effects of various factors on carbon sinks across different ecosystems.
2. Material and methods
2.1. Study area and the BTSSCP
The BTSSCP zone is located in an arid and semiarid area in northern China and covers approximately 458 × 103 km2 (figure 1(a)). It is located north of Beijing and suffers from the influence of the Siberian monsoon in the winter (Zhou et al 2020b). This region is characterized by a plateau, plains and mountains. The western, northwestern and northern portions of this area are located on the central Inner Mongolian Plateau, while the southeast portions are plains. There are mountains in the middle of the plains and plateau regions (Wu et al 2013). The annual average temperature is approximately 7.5 °C. More than 60% of the total annual precipitation falls in the rainy season (months 6–8) and decreases from 450 mm to 150 mm from southeast to northwest (Shan et al 2015). From 2001 to 2019, the annual average temperature did not exhibit a significant trend during the entire period (figure 1(c)). Conversely, the annual precipitation increased significantly at a rate of 4.26 mm yr−1 (p< 0.05). Except for precipitation, local vegetation also obtains its water supply from snow meltwater, which determines vegetation growth (Peng et al 2010, Sa et al 2021). Although the increased precipitation relieved the occurrence of drought, it was continued based on the 12-month standardized precipitation–evapotranspiration index (SPEI) for 2001–2019 (figure 1(d)).

Figure 1. Spatial distribution of (a) different LULCs in the BTSSCP zone; (b) LULC change between 2001 and 2019. (c) Annual precipitation and average temperature change from 2001 to 2019. (d) Twelve-month standardized precipitation–evapotranspiration index (SPEI) and area ratio (%) of drought (SPEI < −1.5) in the BTSSCP zone during 2001–2019. (e) Change in the normalized difference vegetation index (NDVI) from 2001 to 2019.
Download figure:
Standard image High-resolution imageIn recent decades, Beijing has suffered from severe sandstorms owing to ecosystem degradation induced by grazing and vegetation destruction (Liu et al 2019). To alleviate the risk of sandstorms, the Chinese government started the BTSSCP in 2001. The goal of this project was to reduce dust hazards by rebuilding and protecting forests and grass. This project covers five provinces (Beijing, Tianjin, Hebei, Shanxi and Inner Mongolia) and 75 counties (Lu et al 2018). Measures such as forest enclosure, afforestation, conversion of croplands to forests and grassland management are included in the BTSSCP (Liu et al 2019, Zhou et al 2020b). These measures induced the local landscape to experience substantial changes. The normalized difference vegetation index (NDVI) significantly increased (p< 0.05) at a rate of 0.0028 yr−1 (figure 1(e); appendix S3, figure S2 available online at stacks.iop.org/ERL/17/014002/mmedia). The area of the forest increased by 23.10% (9994 km2) (appendix S3, table S1). Increased forests were mostly converted from grassland, cropland and barren land, mainly in the southeast of the BTSSCP zone (figure 1(b)). Meanwhile, the areas of grassland increased by 0.42% (1359 km2) (appendix S3, table S1). For more detail please refer to appendix S1.
2.2. Methodology for carbon sink analysis
2.2.1. Estimation of the carbon sink
In this study, we estimated the carbon sink based on net ecosystem productivity (NEP), which was calculated from the net primary productivity (NPP) minus the soil heterotrophic respiration (Rh) (equation (1)); the workflow for calculating NEP is described in figure 2

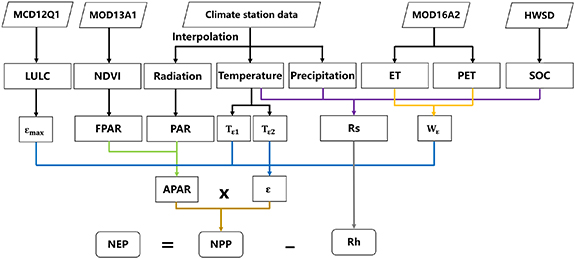
Figure 2. Datasets and workflow for calculating NEP (HWSD, Harmonized World Soil Database).
Download figure:
Standard image High-resolution imageNPP was calculated by the CASA model (Potter et al 1993, 2003, Zhang et al 2014), which is a light-use efficiency model that considers different environmental factors (equation (2))
Here NPP is the product of absorbed photosynthetically active radiation (APAR) and actual light use efficiency ( ), RAD is total shortwave solar radiation (MJ m−2), where 0.45 is the fraction of RAD within the 400–700 nm spectral range that can be used for photosynthesis (Campbell 1977), FPAR is the fraction of APAR, which is linearly related to the NDVI and can be calculated by equation (3),
  is the potential light use efficiency, and its use here in different biomes was verified according to a previous study in China (Zhu et al
2007),
is the potential light use efficiency, and its use here in different biomes was verified according to a previous study in China (Zhu et al
2007),  and
and  are two temperature parameters accounting for temperature stress on plants and adaptation of plants to local climate conditions, and
  is the parameter of soil water stress and is calculated according to equation (4)
where  and
and  are the NDVI values for pixels with full vegetation coverage and no vegetation coverage, respectively, and
  and
and  are the maximum and the minimum FPAR, respectively
where  is the water stress index,
  is the actual evapotranspiration and
  is the potential evapotranspiration.
Rh was calculated from the soil respiration (Rs) with equation (5), which was proposed by Yu et al (2010):

Rs was calculated at the monthly scale according to equation (6) (Yu et al 2010, Chuai et al 2018):
where SOC is the topsoil (0–20 cm) organic carbon storage density (kg C m−2), T is the mean monthly air temperature (°C) and P is the total monthly precipitation (cm).
2.2.2. Data sources and multiple dataset integration
Multiple datasets were used as inputs to drive the calculation of NEP. All datasets are summarized in table 1. As these datasets are varied in format, spatial and temporal resolution, they must be integrated to feed the needs of model input. We first converted all datasets into raster grids with WGS84/Albers equal area conic projection. Then, they were regrouped and resampled into a 1 km × 1 km grid for matching. Figure 2 is the workflow to describe the procedure of data integration and NEP calculation. Before integration, we filled data gaps due to missing observations in climate stations and bad-quality records in MOD13A1 NDVI time series. For missing observation records in climate stations, we filled the gaps by values of the neighborhood days. For bad-quality records in the MOD13A1 NDVI time series, we masked all cloud and aerosol affected pixels based on the quality indicator layer in the MOD13A1 dataset and filled the gaps with linear interpolation, and smoothed the data using a Savitzky–Golay filter algorithm. Explicit information about the data source and preprocessing is described in appendix S4.
Table 1. Required data for NEP evaluation.
| Data requirements | Spatial resolution | Period | Time scale | Sources |
|---|---|---|---|---|
| LULC | 30 m | 2001–2019 | Yearly | MCD Yang et al 2021 |
| NDVI | 500 m | 2001–2019 | 16 day | MOD13A1 (MODIS product) |
| SOC | 1000 m | Constant | Constant | Harmonized World Soil Database v 1.2 |
| ET/PET | 1000 m | 2001–2019 | 8 day | MOD16A2 (MODIS product) |
| Temperature | 1000 m | 2001–2019 | Monthly | Chinese National Climate Data Center |
| Precipitation | 1000 m | 2001–2019 | Monthly | Chinese National Climate Data Center |
| Radiation | 1000 m | 2001–2019 | Monthly | Chinese National Climate Data Center |
ET, evapotranspiration; LULC, land use/land cover; NDVI, normalized difference vegetation index; PET, potential evapotranspiration; SOC, soil organic carbon.
2.2.3. Model evaluation
To improve the feasibility of the simulation results, we compared our estimated NPP and NEP with available NPP and NEP datasets that were already validated in published studies. Available NPP was derived from the MOD17A3H product (https://lpdaac.usgs.gov/products/mod17a3hv006/), and three global NEP datasets based on machine learning methods (Bodesheim et al 2018, Jung et al 2020, Zeng et al 2020). All datasets were masked according to the range of the BTSSCP zone. Notably, the comparison of our data showed a high degree of consistency with these existing datasets, indicating the reliability of our results (appendix S2, figure S1(b)). Meanwhile, our estimated NPP was slightly higher than that of the MOD17A3H product (appendix S2, figure S1(a)). This was mainly due to MOD17 C6 products largely underestimating productivity for most ecosystems (Wang et al 2017, Zhang et al 2017).
2.3. Estimation of the effect of change factors on carbon sinks
2.3.1. Modeling setup procedure
2.3.1.1. Separating the effect of climate and CO2 on FPAR
Apart from LC/land management (LM), climate change and rising CO2 also affected FPAR. To separate the net effect of climate change and rising CO2 on the carbon sink, we must construct FPAR which is only driven by climate change or rising CO2.
To eliminate the effect of LULC change, we chose patches without LULC change in natural reserves of the BTSSCP zone (figure 1(a)) as samples to a construct a random forests regression (RF) model. Explicit information about natural reserves is described in appendix S4. Then we extracted the monthly temperature, precipitation, PET and CO2 concentration as predictors and FPAR as the explanatory variable of these areas during 2001–2019 to drive the RF model. Consistency in both training and validation was good, indicating the feasibility of our assumption (appendix S4, figure S2). Next, we used the trained RF to estimate the FPAR under the sole effect of climate change factors and rising CO2 to meet the needs of subsequent analysis.
2.3.1.2. Scenario design
To separate the respective effect of climate change, rising CO2 and ERPs on the carbon sink, we modeled four scenarios (B, CLIM, CO2, R) based on different combinations of inputs in land and climate factors (table 2). Here, scenario B was designed to analyze the state and change in the carbon sink under business as usual. Scenario CLIM was used to quantify the effect of climate change on the carbon sink only. Likewise, scenario CO2 was used to quantify the effect of rising CO2 on the carbon sink and scenario R was used to quantify the effect of real change on the carbon sink.
Table 2. Summary of factorial model simulations.
| Land factors | Climate factors | |||||
|---|---|---|---|---|---|---|
| Scenarios | LULCa | FPAR | RAD | TEM | PRE | WSI |
| Baseline (B) | □ | □ | □ | □ | □ | □ |
| Climate change (CLIM) | □ | ▪b | ▪ | ▪ | ▪ | ▪ |
| Rising CO2 (CO2) | □ | ▪c | □ | □ | □ | □ |
| Real state (R) | ▪ | ▪ | ▪ | ▪ | ▪ | ▪ |
LULC, land use/land cover; FPAR, fraction of APR (absorbed photosynthetically active radiation); RAD, radiation; TEM, temperature; PRE, precipitation; WSI, water stress index. ▪, Transient input variable from 2001 to 2019. □, Input variable is fixed at the level in 2001, except for climate factors fixed at the average for 2001–2003 (to reduce the uncertainty of inter-annual climate fluctuations).
a The maximum light-use efficiency  of different LULCs was varied, changes in LULC changed the maximum light-use efficiency, which affects calculation in equation (2).
b The transient FPAR derived from the RF model corresponding to varying climate-driven factors.
c The transient FPAR derived from the RF model corresponding to varying CO2 driven factors.
of different LULCs was varied, changes in LULC changed the maximum light-use efficiency, which affects calculation in equation (2).
b The transient FPAR derived from the RF model corresponding to varying climate-driven factors.
c The transient FPAR derived from the RF model corresponding to varying CO2 driven factors.
2.3.1.3. Scenario comparison to distinguish the respective effects of different factors on the carbon sink
Here, we use equation (7) to assess the effect of the change in individual factors on the carbon sink
Here  is the cumulative NEP difference in LULC t between scenario k and scenario B on the carbon sink from 2001 to 2019,
  is the NEP under scenario k of year i and
  is the NEP under scenario B of year i.
Next, the effect of different factors on the carbon sink was quantified according to table 3. Considering the stringent natural ecosystem restoration and protection measures and practices implemented in the BTSSCP zone (Liu et al 2019), we tentatively assumed that all contributions to the carbon sink in both increased and unchanged forests/grassland were due to ERPs under the condition of excluding the impact of climate change and rising CO2 (figure 3), and that the other LC/LM-induced carbon sink change was due to measures and practices of non-ERPs (table 3).
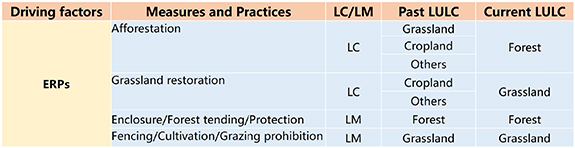
Figure 3. The association between LC/LM and ecological restoration projects (ERPs).
Download figure:
Standard image High-resolution imageTable 3. Equations to disentangle the effects of different factors on the carbon sink (CS).
| Factors | Equations |
|---|---|
| Climate change |

|
| Rising CO2 |

|
| ERPs |
|
| Non-ERPs |

|
ERP, ecological restoration project; F, forest; G, grassland; NEP, net ecosystem productivity; O, others; S, shrubland.
3. Results
Approximately 507.18 Tg C was sequestrated in the BTSSCP zone from 2001 to 2019 (figure 4), and 56.45% and 24.59% of the total carbon sink was contributed by forest and grassland, respectively (figure 4). Compared with the baseline scenario, climate change alone caused the total NEP to decrease by approximately 78.97 Tg C (figure 4). Climate change made the carbon sink in forests and grassland decline by about 39.55 Tg C and 33.43 Tg C, respectively (figure 6). The negative effect of climate change mainly occurred in the mid and southwest areas (figure 5). In contrast, ERPs contributed approximately 199.88 Tg C to the carbon sink compared with baseline (figure 6; appendix S5, table S2). Meanwhile, rising CO2 also contributed approximately 107.80 Tg C (figure 6). This made the carbon sink in forests and grassland increase by about 3.85 Tg C and 81.04 Tg C, respectively (figure 6).
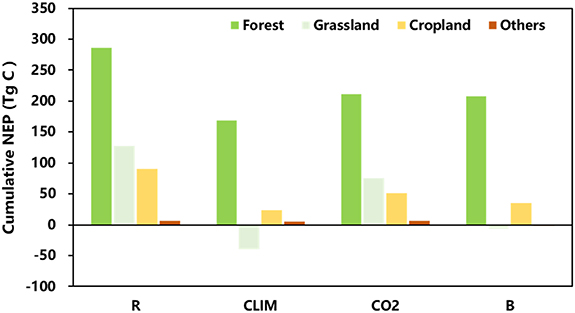
Figure 4. Cumulative NEP for 2001–2019 in different scenarios. 'Others' include wetland, impervious surfaces, snow/ice and barren land.
Download figure:
Standard image High-resolution image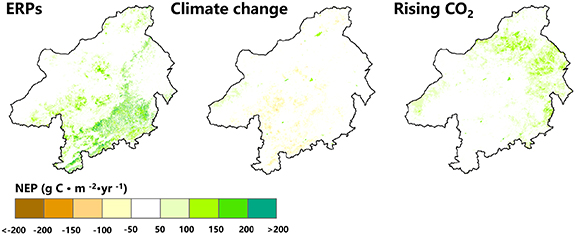
Figure 5. The spatial patterns of average annual NEP change as a result of ERPs, climate change and rising CO2 for 2001–2019.
Download figure:
Standard image High-resolution image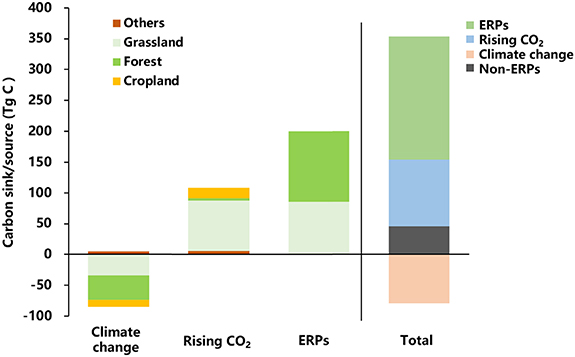
Figure 6. Carbon sink/source in the BTSSCP zone contributed by different factors.
Download figure:
Standard image High-resolution imageERPs induced a positive carbon sink rate change (CSRC) in unchanged forest and grassland of approximately 42.48 g C m−2 yr−1 and 9.63 g C m−2 yr−1, respectively (figure 7). In addition, ERPs induced a positive CSRC of approximately 143.80 ± 10.79 g C m−2 yr−1 in new forests and approximately 16.07 ± 17.49 g C m−2 yr−1 in new grassland (figure 7). Likewise, rising CO2 also induced a positive CSRC in forest and grassland of approximately 4.23 g C m−2 yr−1 and 17.37 g C m−2 yr−1, respectively (figure 7). Conversely, climate change induced a negative CSRC in forest and grassland of approximately 27.65 g C m−2 yr−1 and 6.31 g C m−2 yr−1, respectively (figure 7).

Figure 7. Effect of ERPs, climate change and rising CO2 on the carbon sink rate change (CSRC) for the period 2001–2019 (g C m−2 yr−1) (F, forest; G, grassland; C, cropland; O, others; GF, grassland converted into forest; CF, cropland converted into forest; OF, others converted into forest; CG, cropland converted into grassland; OG, others converted into grassland).
Download figure:
Standard image High-resolution image
4. Discussion
For evidence of the credibility of the estimated change in the carbon sink contributed by ERPs, we compared our results with values derived from Lu et al (2018) and Liu et al (2019). The comparison showed that our estimate was similar to theirs in the matched period (2001–2010) (appendix S2, figure S2). This suggests confidence in our approach to separate the contribution of ERPs to the carbon sink. In terms of the average carbon sink rate, forest NEP was the highest (311.26 ± 50.51 g C m−2 yr−1) across all LULCs (appendix S5, figure S1). This value was also similar to that of a previous study (310 ± 285 g C m−2 yr−1) by Liu et al (2018) but slightly higher than the figures of Zhao et al (2019) (152.45 ± 181.46 g C m−2 yr−1), Sun et al (2015) (58 ± 76 g C m−2 yr−1) and Wang et al (2018) (121 ± 5 g C m−2 yr−1). This difference may be related to the uncertainty in the different methods used in these studies. The methods used by Zhao et al (2019) and Sun et al (2015) were based on inventory data and did not consider the effect of spatial heterogeneity in forest quality and growth state. Moreover, inconsistent timespans were another important cause of the observed differences. Additionally, the method used by Wang et al (2018) considered only the carbon sink potential of vegetation without considering that of soil. Indeed, the soil carbon sink is a very important component of the total carbon sink of forests in the BTSSCP zone according to the study of Zeng et al (2014). For grassland, the estimate of the average NEP (18.69 ± 24.24 g C m−2 yr−1) (appendix S5, figure S1) was consistent with that of previous studies by Chen et al (2016) (11.25 g C m−2 yr−1) and Sui and Zhou (2013) (15.97 g C m−2 yr−1). This consistency was most likely due to the methods used in these studies, which were all based on approaches derived from remote sensing. For cropland, the average NEP estimate (68.61 ± 40.59 g C m−2 yr−1) of this study was similar to the values of Lu et al (2009) (65.04 ± 16.87 g C m−2 yr−1) and Du and Liu (2013) (77.45 ± 32.74 g C m−2 yr−1). In addition, the sensitivity of the CSRC to rising CO2 that we measured was also similar to the size calculated from MACC-II, Jena CarboScrope and TRENDY datasets (Fernández-Martínez et al 2019) (appendix S2, figure S3), which suggests that our results are reliable.
The effect of climate change on the carbon sink is negative, and widespread drought was probably the major cause. Based on the drought area ratio of varied drought frequency calculated from the 12-month SPEI (appendix S3, figure S1(a)), drought occurred at least once in approximately 50% of the total area, and droughts happened more than 14 times in approximately 22% of the total area for the period 2001–2019. Previous study in local areas has already found that serious drought restricts the vegetation growth to offset the contribution of restoration (Wu et al 2014). Meanwhile, Zhang et al (2020) found that drought would induce a shift from a carbon sink to a carbon source in the grasslands of Inner Mongolia, China. Notably, the annual cumulative drought area declined after 2012 (appendix S3, figure S1(b)). Continuous increase in precipitation, especially after 2012, may be the main reason for reduction in the occurrence and scale of drought (figure 1(c)). Indeed, reduced drought reversed the negative trend of climate change-induced carbon loss in later years (appendix S5, figure S2). However, improvement in the carbon sink resulting from reduced drought did not thoroughly offset the carbon loss caused by prior drought (appendix S5, figure S2).
On the contrary, the carbon sink contributed by EPRs and rising CO2 reversed the negative effect caused by climate change (figure 6). Compared with rising CO2, ERPs can enhance the carbon sink more quickly, especially in forests (figure 7). Moreover, the enhancing effect of ERPs in new forests was stronger than in old forests (figure 7). This was mostly due to the larger stems and roots and higher soil organic matter in old forests, which cause higher respiration (Tang et al 2014, West 2020). Likewise, the response of CSRC to rising CO2 was varied across different LULCs (figure 7), due to the varied sensitivity of different types of vegetation to rising CO2.
Of the carbon cycles of all LULCs, that of grassland has changed the most dramatically, changing from the largest carbon source to the second largest carbon sink (figure 7). The average grassland carbon sink rate changed from −3.86 g C m−2 yr−1 to 58.25 g C m−2 yr−1 from 2001 to 2019 (appendix S5, figure S1). Meanwhile, over 80% of the increase in the grassland carbon sink was from unchanged grassland (appendix S5, table S1). This is most likely due to prohibition of grazing and enclosure implemented in grassland due to ERPs (Wu et al 2013, Li et al 2019, Liu et al 2019). Prior research has already found that light grazing and enclosure would alter the composition of vegetation species, improve grassland productivity and reduce soil respiration to promote the carbon sink (Deng et al 2017, Yu et al 2019, Lin et al 2021). Another important cause is rising CO2. Previous results have shown that rising CO2 is an important cause of improvement in the grassland carbon sink in recent decades (Xu et al 2014, Chang et al 2021, Pastore et al 2021). In addition, the current carbon sink rate of grassland is lower than the estimate of Wang et al (2011) for abandoned grassland (128–130 g C m−2 yr−1). This indicates that carbon sinks in grassland will still increase in the future.
Unlike grassland, forest always was a carbon sink, and the carbon sink rate of unchanged forests (287.54 g C m−2 yr−1) was higher than that of increased forests (177.28 ± 77.36 g C m−2 yr−1) (appendix S3, table S1 and appendix S5, table S1). Increased forests are the result of artificial planting, and their stand age is younger than that of unchanged forests. These artificially planted trees were planted for less than 20 years and had not reached a sufficient age to achieve their peak carbon uptake rate (Mora et al 2018, Chen et al 2020). Thus, the carbon sink rate in increased forests still has the potential to improve in the future.
In addition, the carbon sink rate in cropland also increased considerably in the BTSSCP zone (figure 6). The increase in the cropland carbon sink was primarily related to improved irrigation technology (Zhao et al 2013, Peng et al 2021), optimized fertilization (Lu et al 2009, Zhao et al 2013, Liu et al 2019), longtime wheat–maize rotation (Wang et al 2015, Xue et al 2018) and the implementation of straw return (Lu et al 2009, Liu et al 2019). However, uncertainty still exists about the effectiveness of cropland carbon sequestration, as straw return may increase greenhouse gas emissions (Lu et al 2010). Compared with agricultural measures, ERPs are more effective and much lower uncertainty exists, leading to improvements in the carbon sink in forests and grassland. Although the effects of carbon costs and leakage in ERPs may offset part of the carbon sequestration, a greater amount of sequestered carbon is stably preserved (Liu et al 2019).
The continued acceleration in carbon sink improvement in the BTSSCP zone indicates that long-term ERPs achieve greater carbon sink benefits than short-term ERPs (appendix S5, figure S2). Although previous studies concluded that an increase in carbon sinks will occur in mid-latitude arid and semiarid regions (Post et al 2018) such as the BTSSCP, the growth of vegetation is slow in these areas owing to water and heat constraints (Pan et al 2020). Thus, carbon sink improvement in these areas is slow. As demonstrated in this article, if ERPs continue to be implemented in these areas, there could be rapid and noticeable improvements in the carbon sink over time. Compared with rising CO2, ERPs can sequester CO2 more quickly (figure 7). However, previous studies have found that if ERPs continue to be implemented in areas restricted by available water, reforestation may lead to a decline in soil moisture which finally causes disease, wilt or death of vegetation (Jia et al 2017, Zhao et al 2021). Thus, local species should be given priority in ERPs owing to their better tolerance to withstand the effect of drought and higher water-use efficiency (Craine et al 2013, Khoury and Coomes 2020). In addition, the implementation of an ecological water conveyance (EWC) plan may also be helpful. An EWC means diverting water from upstream or other basins to the target area. An EWC was implemented in the Heihe watershed in northwest China where the climate is similar to that in the BTSSCP zone (appendix S4, figure S3). The EWC in the Heihe watershed not only increased water resources and promoted the restoration of ecosystems but also promoted economic development with tourism and agriculture (Zhao et al 2020). Nevertheless, introducing an ERP requires a long-term strategy and a large capital investment and workforce (Yin et al 2021). A total investment of USD 8.11 billion was made in stage I of the BTSSCP, and more capital investments were made in stage II (Liu et al 2019). Thus, it is a challenge to balance investments in economic construction and ERPs.
5. Conclusion
In this study, we succeed in separating the effects of climate change, rising CO2 and ERPs on carbon sinks by setting different scenarios in the BTSSCP zone. Our results demonstrate the significance of ERPs in promoting the regional carbon sink and mitigating climate change. In addition, the negative impact of climate change on the carbon sink was also successfully reversed by ERPs. Moreover, rising CO2 gained an additional carbon sink. Currently, global warming-induced climate change has caused a large number of regions to change from carbon sinks to carbon sources and has induced a continuing loss of carbon stocks. Although rising CO2 may also increase the carbon sink in these areas, it is uncertain and much slower than an ERP. Thus, if positive measures such as afforestation and reforestation were conducted in these areas, it would be possible to prevent these areas from changing into carbon sources. Meanwhile, the intensity and scale of ERPs should be adapted to the regional availability of water resources.
Data availability statement
The data that support the findings of this study are available upon reasonable request from the authors.
Acknowledgement
This work is supported by National Major Research Program of China Grants 2017YFA0604702, National Natural Science Foundation of China Grants 71874182, Strategic Priority Program of the Chinese Academy of Sciences Grants XDA26010103, and the Youth Innovation Promotion Association, Chinese Academy of Sciences.