

Abstract
Numerous attempts have been made to understand the connection between extreme weather and Arctic amplification (AA), and it is still disputed whether the mechanism is the elongation and deceleration of planetary-scale waves. In this study, we provide further evidence that the Arctic's rapid warming is influencing extreme precipitation in the Northern Hermisphere based on observation and model outputs, and elucidate the underlying dynamic mechanisms. We find that AA has a significant positive correlation with extreme precipitation, both in the past (1901–2018) and in the future (by 2100). Moreover, observations reveal that, with the enhancement of AA since the mid-1980s, the planetary-scale wave amplitude has increased significantly at 0.66°/decade. This is associated with a negative Northern Hemisphere annular mode and an increased duration of weather patterns, resulting in more extreme precipitation events. Under Shared Socioeconomic Pathways SSP585 scenario, extreme precipitation increases by 8.7% along with wave amplitude increase of 7.9° by 2100.
Export citation and abstract BibTeX RIS

Original content from this work may be used under the terms of the Creative Commons Attribution 4.0 license. Any further distribution of this work must maintain attribution to the author(s) and the title of the work, journal citation and DOI.
1. Introduction
The Arctic plays a multifaceted role in the climate system, and can affect weather and climate (Shepherd 2016). Arctic amplification (AA)—the greater warming over the high latitudes of the Northern Hemisphere than the rest of the world—is one of the clearest manifestations of climate change over recent decades (Screen and Simmonds 2010). Several studies have found that extreme weather events (e.g. heat waves, drought, flooding, and cold spells) have occurred with increasing frequency in recent decades (Gallant et al 2014, Donat et al 2016), and that this is closely associated with the warming of the Arctic (Francis and Vavrus 2012, Cohen et al 2014, Francis and Skific 2015, Yao et al 2017, Ma and Zhu 2018, Ma et al 2018). Possible links between AA and extreme weather were first hypothesized in 2012, when it was suggested that Arctic warming may increase the frequency of persistent weather patterns that cause extreme events by slowing the eastward progression of Rossby waves in the upper-level flow (Francis and Vavrus 2012, Liu et al 2012). Previous studies also found that a weakening poleward temperature gradient resulting from Arctic warming favors a split jet-stream and the formation of a wave guide (Petoukhov et al 2013, Coumou et al 2014, Mann et al 2017), which traps a certain wavenumber range of jet-stream undulations, causing persistent weather conditions that often lead to summer heat waves, drought, and flooding. A causal link between AA and mid-latitude weather has also been supported by some modeling studies (Screen et al 2015, Francis et al 2020).
On the other hand, other studies have argued that there are no robust signals linking AA with extreme weather events in the mid-latitudes of the Northern Hemisphere (Screen and Simmonds 2013, Screen et al 2013, Cohen et al 2020, Blackport and Screen 2020a, 2020b, 2021). As indicated by Barnes (2013), observed positive trends in midlatitude extreme weather patterns are complex and are likely not simply a response to AA alone. Dai et al (2020) found AA to have minimal impact on the climate outside the high latitudes based on coupled model simulations with and without AA. The inconsistencies among studies surrounding the connection between Arctic warming and mid-latitude weather are caused by natural variability, such as volcanic eruptions, both in observations and model simulations (Francis 2017), but Cohen et al (2020) indicated other explanations are also possible. Additionally, the inherent complexity and intermittent character of atmospheric dynamics obscure the causal link between changes in the Arctic and mid-latitude weather (Overland and Wang 2018). Thus, it remains an open question as to whether AA drives robust and observable extreme events in the mid-latitudes, and more evidence should be provided to clarify this matter.
Extreme precipitation is one of the most severe types of extreme event, disrupting individuals, agriculture, and commerce. A warmer Arctic atmosphere can hold more water vapour, which enhances precipitation over the Eurasian continent (Screen 2013, Cohen et al 2014). Additionally, changes in the storm tracks associated with the North Atlantic and Arctic Oscillation (NAO/AO) have a strong influence on the surface precipitation variability in the North Atlantic (Bader et al 2011). However, existing studies have focused on changes in extreme weather events or large-scale waves. In this study, we focus on the direct response of extreme precipitation to AA, which has received relatively little attention. We provide more evidence to support the connection between AA and extreme weather events in the mid-latitudes by exploring the changes in large-scale waves and circulation from 1901 to 2018.
The data and methods are presented in section 2. In section 3, we show the spatial and temporal correlations between AA and extreme precipitation in the Northern Hemisphere. We then explore the underlying mechanisms linking Arctic warming with extreme weather in the mid-latitudes by analyzing wave activity in the upper troposphere. Finally, the conclusions are presented in section 4.
2. Data and methods
2.1. Observed extreme precipitation indices
We used extreme precipitation indices obtained from the HadEX3 dataset in this study. The dataset currently contains 17 land-based temperature extreme indices and 12 precipitation extreme indices on a 1.25° × 1.875° grid from 1901 to 2018, derived from daily station records and recommended by the World Meteorological Organization Expert Team on Climate Change Detection and Indices (ETCCDI; Donat et al 2013, Dunn et al 2014, 2020). The indices represent seasonal and/or annual values, and are supplied either pre-calculated or as timeseries of daily temperature maxima (Tmax), daily temperature minima (Tmin), and daily precipitation accumulations for each station. We selected two extreme precipitation indices: R95pTOT and R99pTOT. The R95pTOT (R99pTOT) index is the contribution from very (extremely) wet days; i.e. days exceeding the 95th (99th) percentile of daily precipitation (Dunn et al 2020). These indices use a specified reference period (1961–1990) to calculate percentile values used to derive the final quantities. The indices can be download freely at www.metoffice.gov.uk/hadobs/hadex3/index.html. For more information, we refer the reader to Dunn et al (2020).
2.2. The sixth Coupled Model Intercomparison Project (CMIP6) dataset
We used CMIP6 daily precipitation, monthly geopotential height and monthly surface air temperature (SAT) datasets, including the historical simulations covering the period 1901–2014 and the predictions for Shared Socioeconomic Pathways (SSPs) SSP245 and SSP585 over the period 2015–2100. The datasets were interpolated to 1° × 1° spatial resolution and only the first ensemble run was used (Veronika et al 2016, Wehner et al 2020). The CMIP6 models used in this study are shown in table S1 (available online at stacks.iop.org/ERL/16/074012/mmedia), and are available at https://esgf-node.llnl.gov/search/cmip6/. The method used to calculate the extreme precipitation indices from the CMIP6 dataset is the same as for the HadEX3 dataset.
2.3. Other datasets
We used the National Aeronautics and Space Administration Goddard Institute for Space Studies surface temperature analysis dataset (GISTEMP), which estimates the global surface temperature change from 1901 to 2018. The data have a resolution of 2° × 2° (Hansen et al 2010) and are available at https://data.giss.nasa.gov/gistemp/.
The reanalysis data for 1948–2018 employed in this study are from the National Centers for Environmental Prediction–National Center for Atmospheric Research (NCEP/NCAR). The data include analyses of the atmosphere at 17 pressure levels on a 2.5° × 2.5° grid and can be obtained from www.esrl.noaa.gov/psd/data/gridded/data.ncep.reanalysis.html (Kalnay et al 1996, Kistler et al 2001).
2.4. Definition of climatic indices and wave amplitude
In this study, we used the Arctic amplification index (AAI) to measure the intensity of Arctic warming relative to that of the globe. It is defined as the difference between the annual mean SAT anomaly in the Arctic (north of 70° N) and the global annual mean SAT anomaly (Liu et al 2020).
The Northern Hemisphere annular mode (NAM) is the dominant mode of atmospheric variability in the extratropical regions of the Northern Hemisphere (Limpasuvan and Hartmann 2000, Kerr 2001). It represents the 'seesaw' phenomenon of air quality between mid-latitudes and high-latitudes. The NAM index is calculated as the difference in the normalized monthly zonal-mean sea level pressure between 35° N and 65° N (Li and Wang 2003), and is distinctly superior to the index proposed by Thompson and Wallace (1998) based on empirical orthogonal functions (Angell 2006, Gao and Washington 2010).
We also explored the effects of AA on mid-latitude weather patterns by analyzing changes in the atmospheric circulation at 500 hPa, which are related to a rapidly warming Arctic. A narrow range of 500 hPa heights (5400 ± 50 m) for each year was selected to capture the wave pattern in the geopotential height field and compared with the results with other isohypses (5500 and 5600 ± 50 m). The wave amplitude was defined as the difference between the maximum and minimum latitudes of the 500 hPa isohypse at each longitude for each year (Francis and Vavrus 2012).
3. Results
3.1. The link between AA and extreme precipitation in the mid-latitudes
To help elucidate the connection between AA and extreme weather in the mid-latitudes, we first present the spatial correlation between the AAI and the extreme precipitation indices (R95pTOT and R99pTOT) from 1901 to 2018 (figure 1). Significant positive correlations are found across the Northern Hemisphere both before and after detrending, especially in North Africa, Europe, and China, where the correlation coefficients are above 0.3 and exceed the 95% confidence level.

Figure 1. The spatial distributions of correlations between the AAI and extreme precipitation indices (a) R95pTOT and (b) R99pTOT from 1901 to 2018. (c) and (d) are same as (a) and (b) respectively, but are detrending results. Black dots indicate correlation coefficients exceeding the 95% confidence level.
Download figure:
Standard image High-resolution imageIt has been indicated that extreme precipitation in the Northern Hemisphere, especially in the mid-latitudes, is closely associated with the amplification of Arctic temperatures. In accordance with the rapid warming of the Arctic since the mid-1980s (Liu et al 2020), we find that extreme precipitation in the Northern Hemisphere has shown an overall increasing trend, with R95pTOT having increased more significantly than R99pTOT (figure S1). In North America, Europe, and China, extreme precipitation has increased by more than 1% per decade (exceeding the 95% confidence level). As reported in Dunn et al (2020), the extreme precipitation indices show increases on a global level, indicating that there are more heavy precipitation events that are also stronger, which contribute a greater fraction to the total precipitation than long periods of light rain.
Figure 2 shows the temporal variation of the normalized R95pTOT and R95pTOT indices and the normalized AAI during the period 1901–2018. The time series of the AAI and extreme precipitation indices are quite consistent, with low anomalies from 1901 to the 1920s and from the 1960s to early-1980s, and high anomalies from the 1930s to 1950s and from the mid-1980s to the present. The correlation between the time series of the AAI and R95pTOT (R99pTOT) index for the entire period is 0.53 (0.51), which exceeds the 99% significance level. When the linear trend is removed from both time series, the correlation remains moderate at 0.43 (0.39) and statistically significant at the 99% level for the period 1901–2018. The extreme precipitation events captured by R95pTOT and R99pTOT increase rapidly at 0.68% and 0.36% per decade, respectively, from 1986 to 2018 and during this time interval show a higher correlation with the AAI before detrending than after. Before detrending, the correlation coefficients are 0.71 (0.74), respectively, both of which exceed the 99% significance level, but after detrending, the correlation coefficients decreased to 0.27 (0.42, exceed the 95% significance level).
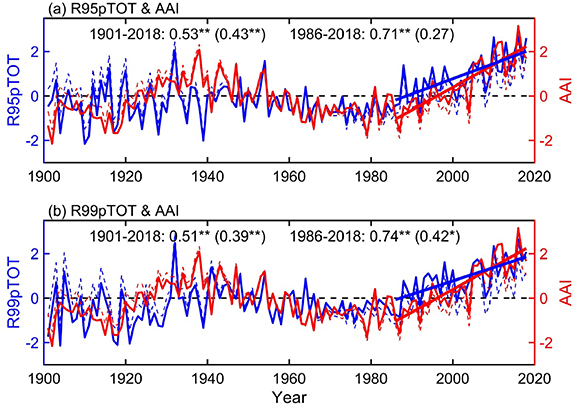
Figure 2. Time series from 1901 to 2018 of the normalized extreme precipitation indices (a) R95pTOT and (b) R99pTOT (blue) and the normalized AAI (red), with raw (solid lines) and detrended (dashed lines) data. The values outside (within) brackets represent the correlation coefficients before (after) detrending. The asterisk (*) and double asterisk (**) indicate correlation coefficients exceeding the 95% and 99% confidence levels, respectively.
Download figure:
Standard image High-resolution imageThe historical simulations based on CMIP6 multi-model ensemble mean also confirm that the variation in AA is in good agreement with the extreme precipitation indices, and the correlation coefficients before and after detrending are all above 0.7 (exceeding the 99% significance level) from 1901 to 2014 (figure S2). Simulations under the SSP245 and SSP585 scenarios indicate that the Arctic will continue to warm in the future and extreme precipitation will also show a consistent increase, with high correlation coefficients above 0.97 before detrending and above 0.46 after detrending, exceeding the 99% significance level in all scenarios. It is worth noting that by 2100, extreme precipitation, as captured by the indices R95pTOT and R99pTOT, increases by 4.1% and 2.7%, respectively, under the SSP245 scenario, and by 8.7% and 6.0%, respectively, under the SSP585 scenario.
We have shown that a significant positive correlation between Arctic warming and extreme precipitation in the Northern Hemisphere exists, both in observations and model simulations, but the linking mechanisms are not yet clear. We explore this in the following section.
3.2. Dynamic processes in connection with AA and extreme precipitation
To further investigate the link between Arctic climate change and extreme precipitation events in the Northern Hemisphere, we linearly regressed the 500 hPa geopotential height onto the normalized NAM, AAI, R95pTOT, and R99pTOT indices during the period 1986–2018 (figure 3). The regression onto the NAM indicates that the 500 hPa geopotential height is lower at high latitudes and higher in the mid-latitudes of the Northern Hemisphere. The zonal symmetry of this pattern is remarkable and indicates that the NAM is in an enhanced negative phase when the geopotential height increases (figure 3(a)). Previous studies have also found that there has been a negative trend in the NAO/AO (similar to the NAM) over the past two decades based on the observed 'warm Arctic—cold continents' temperature-anomaly pattern (Overland et al 2011, Cohen et al 2012). The negative phase of the winter NAO/AO has a significant correlation with reduced Arctic sea-ice cover under global warming (Strong et al 2009, Overland and Wang 2010, Hopsch et al 2012). When the NAO/AO is in a negative phase, its circulation pattern is conducive to the occurrence of extreme precipitation (Sergio et al 2009, McCabe‐Glynn et al 2016).
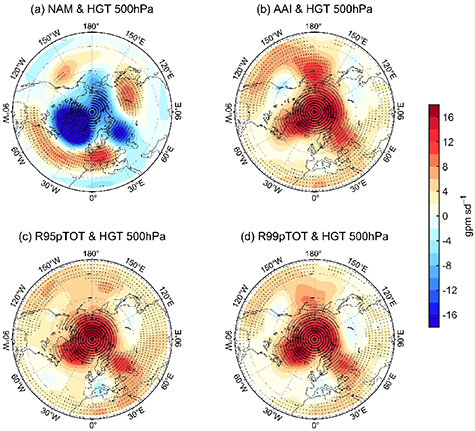
Figure 3. Linear regression of 500 hPa geopotential height (HGT) (units: gpm sd−1) on normalized (a) NAM, (b) AAI, (c) R95pTOT and (d) R99pTOT during the period 1986–2018. Dotted regions represent correlations at the 95% significance level.
Download figure:
Standard image High-resolution imageIn contrast to the NAM, the regression of 500 hPa geopotential height on the AAI and extreme precipitation indices (R95pTOT and R99pTOT) show a higher geopotential height at high latitudes and a slightly lower geopotential height in the mid-latitudes of the Northern Hemisphere (figures 3(b)–(d)). In addition, there are clear signs of wave activity in the mid-latitudes, especially in Eurasia. Therefore, a possible mechanism linking the NAM with extreme precipitation in the Northern Hemisphere is the change of large-scale wave activity in the mid- and high-latitudes, as reported in previous studies (Francis and Vavrus 2012, Cohen et al 2014).
To further explore the role of wave activity in the link between the Arctic and the mid-latitudes, we captured the large-scale wave pattern in the geopotential height field by calculating the annually averaged maximum latitude of the 500 hPa geopotential height (5400 ± 50 m), corresponding to wave peaks or ridges. The evolution of these wave peaks is consistent with the temporal evolution of the normalized indices R95pTOT and R95pTOT in the period 1948–2018, with positive correlation coefficients of 0.69 and 0.64, respectively, before detrending, and of 0.56 and 0.49, respectively, after detrending, all exceeding the 99% confidence level (figure S3). A stronger correlation is found following the increase of AA after the mid-1980s, with the correlation coefficients between the maximum latitude of waves and the R95pTOT and R95pTOT indices being 0.67 and 0.7, respectively, both exceeding the 99% confidence level. Similarly, CMIP6 multi-model ensemble mean also show a significant positive correlation between the maximum latitude of waves and the extreme precipitation indices, both in the historical and future projections (figure S4).
We have shown that the increase in extreme precipitation in the Northern Hemisphere is closely related to the rising maximum latitude of wave peaks in the 500 hPa geopotential height field, consistent with previous studies linking AA to extreme weather in the mid-latitudes (Francis and Vavrus 2012, Barnes 2013). However, it is worth verifying whether the increase in the maximum latitude of these wave peaks coincides with an increase in wave amplitude. Figure 4 shows the wave amplitude trends in the Northern Hemisphere at each longitude based on observations after 1986 and CMIP6 multi-model ensemble mean (historical runs and future projections). We find that the wave amplitude shows an increasing trend throughout the Northern Hemisphere. Observations indicate clear increases in wave amplitude (greater than 1°/decade) in the ocean areas, especially in the North Pacific Ocean (130° E–150° W) and North Atlantic Ocean (60° W–0° E). The wave amplitude in the Pacific Ocean increases by more than 2°/decade. Furthermore, the temporal evolution of the historical simulation is consistent with the observations, although with somewhat smaller trends, mainly in the ocean areas. If AA is further enhanced in the future, the wave amplitude will increase significantly over both the oceans and continents of the Northern Hemisphere. In the SSP585 scenario based on CMIP6 multi-model ensemble mean, the increase is about 7.9° by 2100, which is significantly larger than the increase of 5.2° in the SSP245 scenario. The corresponding extreme precipitation (i.e. R95pTOT) in the Northern Hemisphere will increase by 4.1% and 8.7% by 2100 under the SSP245 and SSP585 scenarios, respectively. These predicted trends all exceed the 99% confidence level.
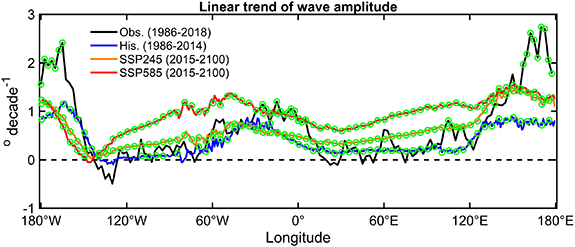
Figure 4. Linear trends in the large-scale wave amplitude (°/decade) at each longitude based on observations (Obs.), historical simulations (His.) and future projections (SSP245 and SSP585) based on the CMIP6 multi-model ensemble mean. Green circles indicate significance at the 95% confidence level.
Download figure:
Standard image High-resolution imageTo verify the robust of the CMIP6 simulations, we further evaluated the uncertainty of each model for simulating the variability in extreme precipitation (R95pTOT and R99pTOT), AAI and the maximum latitude of large-scale waves (figure 5). It is indicated that most of the CMIP6 models simulate the historical increases of extreme precipitation, AAI and maximum latitude, which show a consistency with observation, and only a few models simulate a decreasing trend. Except for one model that has no obvious trend in the simulation of AAI in the SSP245 scenario, the other models all show an obviously increasing trend and exceed the 99% significance level in the SSP245 and SSP585 scenarios. Futhermore, it clearly shows that the AA will continue to enhance with the increase in global temperature in the future, resulting in the maximum latitude of large-scale waves to expand at a trend of 2.3°/decade in the SSP585 scenario based on CMIP6 multi-model ensemble mean, and the corresponding extreme precipitation in the Northern Hemisphere, that is R95pTOT and R99pTOT, will increase by 1%/decade and 0.7%/decade respectively.

Figure 5. Linear trends in the R95pTOT, R99pTOT, AAI and max latitude based on observations (Obs.; triangle) for 1986–2018, CMIP6 historical simulations (His.; circle) for 1986–2014 and CMIP6 future projections (SSP245 and SSP585; circle) for 2015–2100. The black circles represent different models from CMIP6, the colored circles represent the CMIP6 multi-model ensemble mean, and the solid triangles and circles indicate significance at the 95% confidence level.
Download figure:
Standard image High-resolution image
In conclusion, we have provided statistically robust evidence of the link between AA and extreme precipitation in the Northern Hemisphere, both in the past and in the future. Because AA increases their amplitude over the mid- and high-latitudes of the Northern Hemisphere, this leads to more persistent weather patterns and more extreme weather events.
4. Conclusions
In this study, we have investigated the link between AA and extreme precipitation in the Northern Hemisphere, with a focus on the role of large-scale wave activity in the mid-latitudes. We find that extreme precipitation over the Northern Hemisphere has increased significantly as AA has intensified (e.g. in North Africa, Europe, and China), both in observations and models. The correlation coefficients between AA and R95pTOT and R99pTOT are 0.53 and 0.51, respectively, for 1901–2018, but this correlation increases to 0.71 and 0.74 when considering the period since the mid-1980s. Moreover, we find a clear increase in wave amplitude in the 500 hPa geopotential height field of more than 0.66°/decade from observations. The link between AA increasing the large-scale wave amplitude and the duration of weather patterns, and thus extreme precipitation in the Northern Hemisphere, was also found in CMIP6 models, both in the historical simulations and in the future predictions. By 2100, the wave amplitude and extreme precipitation (R95pTOT) in the Northern Hemisphere increases by 5.2° and 4.1%, respectively, under the SSP245 scenario. This increases further to 7.9° and 8.7%, respectively, under the SSP585 scenario. In addition, the uncertainty analysis for CMIP6 models shows that the multi-model ensemble mean is more robust than the results from single model.
These results provide further evidence of the connection between the Arctic and mid-latitude weather, and highlight the importance of research on current Arctic climate change. Nevertheless, several aspects of the Northern Hemisphere weather and climate response to AA remain unresolved. The majority of studies based on observational and reanalysis datasets support an association between AA and changes in large-scale circulation, as reported in this study, but disputes still exist because modeling results show only a weak connection (Cohen et al 2020, Dai et al 2020). More metrics and approaches are needed to identify regional and seasonal mechanisms linking Arctic climate change with atmospheric circulation in the Northern Hemisphere. Although our results suggest that Arctic warming is having an impact on extreme events in the Northern Hemisphere, more research is needed to reach a consensus. This would not only act as a valuable reference for future studies on climate change, but also help to improve climate models.
Acknowledgments
This work was supported by the National Science Fund for Distinguished Young Scholars (42025102), the National Key Research and Development Program on Monitoring, Early Warning and Prevention of Major Natural Disaster (2018YFC1506005), and the National Natural Science Foundation of China (Grant No. 41675065).
Data availability statement
The HadEX3 dataset is available for download online (www.metoffice.gov.uk/hadobs/hadex3/index.html). All CMIP6 data are available for download online (https://esgf-node.llnl.gov/projects/cmip6/). The GISTEMP surface temperature analysis dataset is available at https://data.giss.nasa.gov/gistemp/. The NCEP reanalysis data is available at www.esrl.noaa.gov/psd/data/gridded/data.ncep.reanalysis.html.
No new data were created or analysed in this study.