

Abstract
The CO2 efflux from soil (soil respiration (SR)) is one of the largest fluxes in the global carbon (C) cycle and its response to climate change could strongly influence future atmospheric CO2 concentrations. Still, a large divergence of global SR estimates and its autotrophic (AR) and heterotrophic (HR) components exists among process based terrestrial ecosystem models. Therefore, alternatively derived global benchmark values are warranted for constraining the various ecosystem model output. In this study, we developed models based on the global soil respiration database (version 5.0), using the random forest (RF) method to generate the global benchmark distribution of total SR and its components. Benchmark values were then compared with the output of ten different global terrestrial ecosystem models. Our observationally derived global mean annual benchmark rates were 85.5 ± 40.4 (SD) Pg C yr−1 for SR, 50.3 ± 25.0 (SD) Pg C yr−1 for HR and 35.2 Pg C yr−1 for AR during 1982–2012, respectively. Evaluating against the observations, the RF models showed better performance in both of SR and HR simulations than all investigated terrestrial ecosystem models. Large divergences in simulating SR and its components were observed among the terrestrial ecosystem models. The estimated global SR and HR by the ecosystem models ranged from 61.4 to 91.7 Pg C yr−1 and 39.8 to 61.7 Pg C yr−1, respectively. The most discrepancy lays in the estimation of AR, the difference (12.0–42.3 Pg C yr−1) of estimates among the ecosystem models was up to 3.5 times. The contribution of AR to SR highly varied among the ecosystem models ranging from 18% to 48%, which differed with the estimate by RF (41%). This study generated global SR and its components (HR and AR) fluxes, which are useful benchmarks to constrain the performance of terrestrial ecosystem models.
Export citation and abstract BibTeX RIS

Original content from this work may be used under the terms of the Creative Commons Attribution 4.0 license. Any further distribution of this work must maintain attribution to the author(s) and the title of the work, journal citation and DOI.
1. Introduction
As the largest CO2 flux from the terrestrial biosphere to the atmosphere, soil respiration (SR) plays an important role in regulating land C budgets and atmospheric CO2 concentrations (Raich and Schlesinger 1992, Rustad et al 2000, Davidson and Janssens 2006). SR primarily consists of autotrophic respiration (AR) from plant roots and heterotrophic respiration (HR) from decomposition of soil organic carbon (SOC) by microorganisms (Lambers 1979, Hanson et al 2000). SR rates are highly sensitive to changing environment and disturbances (Davidson and Janssens 2006, Harmon et al 2011, Wang et al 2017), and especially global warming is expected to enhance SR on the global scale (Bond-Lamberty et al 2018). Moreover, disturbances induced soil C loss likely accounts for 20%–50% HR flux in forests. Therefore, changes of disturbances in frequency and severity can profoundly impact SR dynamics (Harmon et al 2011). Due to its large magnitude, even a small change in the global SR can substantially impact atmospheric CO2 concentrations (Zhou et al 2014).
Large uncertainties in simulating global SR and its components (HR and AR) exist among current terrestrial ecosystem models. The simulations of global HR by 20 Earth system models (ESMs) from CMIP5 (Coupled Model Inter-comparison Project Phase) varied from 42 to 73 Pg C yr−1, and the maximum estimate by the Max‐Planck‐Institute Earth System Model-Mixed Resolution (MPI-ESM-MR) model (∼73 Pg C yr−1) was 1.7 times of the lowest estimate of ∼42 Pg C yr−1 simulated by Community Earth System Model, version 1-Biogeochemistry (CESM1-BGC) (Hashimoto et al 2015). Such a large divergence implies a low confidence in the estimated C budgets over global scales. Therefore, it is necessary to evaluate models based on well-defined benchmarks to diagnose model strengths and deficiencies. However, there is limited knowledge on model performance with respect to SR, as well as the HR and AR component fluxes, due to limited benchmark datasets that allow for identification of simulated uncertainties in the magnitude and spatial distribution of SR (Bond-Lamberty 2018).
The changes of SR components (HR and AR) provides information about the different carbon cycling processes in the diverse ecosystem models. HR is the CO2 efflux that derives from microbial decomposition of soil organic matter, which is regulated by C substrate supply and quality, soil and environmental factors (i.e. soil temperature and moisture, clay content and pH), as well as microbial physiology. The AR indicates the CO2 released from the autotrophic metabolism of plant roots, which is more directly from plant photosynthesis, and highly depends on C allocation of plant photosynthate to root (Trumbore 2006, Brunner et al 2015). A recent study showed an increasing ratio of HR to SR during the past two decades, which suggests larger increased magnitude of soil C losses due to climate change in many ecosystems (Bond-Lamberty 2018). Accurate quantification of HR and AR is essential to understanding of C-cycling processes in response to global change (Trumbore and Czimczik 2008). Therefore, the model evaluations and analyses also require distinguishing the spatial variations of HR and AR to assess if the inter-ecosystem processes of the model have been represented adequately. Usually, the model evaluations only focused on the magnitude of SR (sum of HR and AR), which cannot judge the reliability of HR and AR simulations, and was not able to reveal the inadequate representation of HR and AR in the ecosystem models.
The development of global soil respiration database (SRDB) open the path to the application of machine learning approaches in global simulations of SR and its components (Bond-Lamberty 2018 and Jian et al 2018). The random forest (RF) algorithm is widely considered to be one of the best methods to model complex interactions among independent variables (Cutler et al 2007), which has been deployed in estimating biomass and litterfall production over regional and global scales (Xia et al 2018, Li et al 2019). Jian et al (2018) estimated global SR of 78.8 Pg C yr−1 by the RF approach. Warner et al (2019) generated global SR at 1 km spatial resolution using RF, based on that, they indirectly predicted global HR by empirical relationships between SR and HR deriving from meta-analyses. However, only a few studies have been conducted to estimate SR and its components (HR and AR) using the RF method. In this study, the latest SRDB (version 5.0) (Jian et al 2021) and related climate data would be used to develop the RF model. The primary objectives of this study were to (a) develop RF models to estimate the global spatial distribution of SR and its components (HR and AR), (b) evaluate the performance of process-based ecosystem models on reproducing SR, HR, and AR against the simulations of the RF model and (c) compare the differences among process-based ecosystem models.
2. Data and methods
2.1. Global datasets of soil respiration
In this study, the field observations of SR and HR were collected from the global SRDB, version 5.0, which encompasses all published studies that report the annual SR or HR data measured in the field (not laboratory). The SRDB v5.0 compiled more than 10 000 SR records from nearly 2000 publications (Jian et al 2021). We selected a subset of the SR and HR observations from the SRDB using the following criteria: (a) the observed SR and HR were under natural condition, without any experimental treatments (i.e. experimental warming, precipitation manipulation, nitrogen addition); (b) for each record, the SR value should be larger than the corresponding HR value if the corresponding HR was reported, to avoid inconsistent data. In total, 3331 annual SR flux records and 840 annual HR flux records were selected in this analysis. The observation sites were distributed across various ecosystem types with latitudes ranging from 44.23° S to 69.42° N and longitudes from 150.33° W to 175.77° E (figure 1).

Figure 1. Distribution of the total soil respiration (SR) and heterotrophic soil respiration (HR) observations. Background colors show the vegetation type derived from the Global Land Cover 2000 (GLC-2000; Giri et al (2005)).
Download figure:
Standard image High-resolution image2.2. Random forest method
The SR and HR models were developed using the 'quantregForest' package version 1.3-7 (https://cran.r–project.org/web/packages/quantregForest/index.html) in the R software version 3.4.3 (R Core Team 2017). The 'quantregForest' package is similar to the previous 'random Forest' package (https://cran.rproject.org/web/packages/randomForest/), but can yield the entire distribution of predictions instead of a single mean value of prediction (Meinshausen 2006). As an efficient machine learning method, the RF approach was extensively used for spatial prediction of biogeochemical parameters in geosciences (Xia et al 2018, Li et al 2019, Reichstein et al 2019). The original RF algorithm was proposed by Breiman (2001). The RF algorithm produces a model composed of many independent regression trees. The independent trees are obtained by randomly selecting from a subgroup of predictors every time a branch of a tree is grown. Based on the given training database, each individual decision tree in RF outputs the mode of classes or the mean prediction, and the generalization error for RF can converge to a limit with the increase of the decision tree number.
The SR and HR models were developed by the RF approach. The initial set of explanatory variables included: mean annual air temperature (MAT), annual precipitation (Prec), mean annual relative humidity (RH), mean annual leaf area index (LAI), annual photosynthetically active radiation (PAR), soil organic carbon (SOC) content (in 0–30 cm soil depth), precipitation during growing season (Prec_GS), mean relative humidity during growing season (RH_GS), mean LAI during growing season (LAI_GS) and PAR during growing season (PAR_GS). In this study, the growing season is composed of all months where the mean monthly air temperature was above 0 °C. The period of the time series of all these variables was from 1982 to 2012. The LAI data were derived from the Global Land Surface Satellite LAI datasets (Xiao et al 2013) and the SOC data were developed by Shangguan et al (2014). The meteorological variables were derived from the Modern-Era Retrospective analysis for Research and Applications datasets (Rienecker et al 2011).
A complete combinatorial method was employed to select the optimal set of predictors out of the ten variables. The root mean squared error (RMSE) was used to evaluate the performance of each model based on different predictor combination. In our RF models, five predictors, including MAT, Prec, RH, RH_GS and LAI_GS, were selected to predict SR. The variables combination of MAT, Prec, RH, PAR, RH_GS, LAI_GS, PAR_GS was selected for HR prediction. The best combination of predictors was further used for the RF model establishment and cross-validation. It should be noticed that there was a large discrepancy in the number of the observations within SRDB among various vegetation types. We compared the proportions of the SR and HR observations and the area proportion of various vegetation types (figure S1(a), table S1 (available online at stacks.iop.org/ERL/16/054048/mmedia)). Large divergences were observed between the proportions of the SR and HR observations and the area proportion of the corresponding ecosystem types. Especially, the proportion of SR and HR observations at the evergreen broadleaf forests and the shrublands were much lower comparing with the proportion of corresponding ecosystem area (figure S1). The results reflected the scarce observations of SR and HR in evergreen broadleaf forest and shrubland ecosystems which are corresponding to the high and low respiration rate regions, respectively (figure S1(b)). Therefore, in order to reduce the model uncertainty induced by observations imbalance among various ecosystem types, the SR and HR observations were binned to five bins according to the ecosystem types (table S1). The RF models of SR and HR were developed and cross-validated by randomly selecting observations from each vegetation type bin with the different probability. The probability of selection was equal to the area proportion of the corresponding vegetation types to global vegetated land area (figure S1). As a result, 80% of the observations were selected for model training, leaving 20% for cross-validation. The observations selection procedures and the RF models were run 2000 times for cross-validation and prediction. In addition, as a comparison, we also developed RF models by selecting observations from each vegetation type with equally probability (figures S2 and S3). The established models were implemented to estimate SR and HR at 0.5° × 0.5° resolution over 1982–2012. The global AR fluxes were calculated as the difference of SR and HR. The uncertainty of the predicted global SR, HR and AR were expressed in the standard deviation (SD), the median absolute deviation (MAD) and the coefficient of variation (CV, %). The variable importance and partial dependence analyses of the RF models for SR and HR were conducted (figures S4–S6). However, it should be cautious the instability of the variable importance ranking, especially when the predictors are highly correlated (Gregorutti et al 2017).
2.3. Terrestrial ecosystem models
This study includes ten process-based terrestrial ecosystem models: the Boreal Ecosystem Productivity Simulator (BEPS) (Liu et al 1997), the coupled Canadian Land Surface Scheme and Canadian Terrestrial Ecosystem Model (CLASS-CTEM) (Melton and Arora 2016), the Community Land Model, version 5.0 (CLM5.0) (Lawrence et al 2019), the CSIRO Atmosphere and Biosphere Land Exchange (CABLE) (Wang et al 2010), the Integrated Biosphere Simulator (IBIS) (Foley et al 1996, Yuan et al 2014), the Land surface Processes and eXchanges (LPX-Bern) (Lienert and Joos 2018), the Lund-Postdam-Jena General Ecosystem Simulator (LPJ-GUESS) (Smith et al 2014, Olin et al 2015), the ORganizing Carbon and Hydrology In Dynamic EcosystEms (ORCHIDEE) (Krinner et al 2005), the Vegetation Integrated Simulator for Trace Gases (VISIT) (Ito 2019), and the Vegetation Global Atmosphere Soil model (VEGAS) (Zeng et al 2004).
The CLASS-CTEM, the CLM5.0, the LPX-Bern, the ORCHIDEE, the VEGAS and the VISIT model were driven with the Climatic Research Unit (CRU) Japanese Reanalysis (JRA) v2.0 atmospheric forcing dataset (https://catalogue.ceda.acuk/uuid/7f785c0e80aa4df2b39d068ce7351bbb). The BEPS, the CABLE, the LPJ-GUESS and the IBIS model were driven by CRUNCEP v7 dataset (https://rda.ucar.edu/datasets/ds314.3/). Both the CRU JRA and the CRUNCEP datasets are six hourly and gridded reanalysis data which are based on the combination with the CRU monthly dataset. The CRU JRA version 2.0 dataset is constructed by combining the CRU monthly data covering from 1901 to 2018 with the JRA data six hourly data covering from 1958 to 2018. The CRUNCEP dataset is a combination of the CRU monthly data covering the period 1901–2015 and the National Centers for Environmental Prediction (NCEP) reanalysis six hourly data covering the period 1948–2016. There is high consistence of the two datasets in terms of several major climate variables (i.e. air temperature, precipitation, specific humidity, pressure and the incident shortwave radiation; figures S7 and S8). All models used the Land-use Harmonization (LUH2) land use data (http://gsweb1vh2.umd.edu/LUH2/LUH2_GCB_2019/states.nc).
3. Results
3.1. Global estimates of SR, HR and AR derived from the RF models
The RF models were cross-validated against total SR and HR observations to test the model performance. SR model and HR model explained 89% and 86% of the variation of observed SR and HR, respectively (figures 2(a) and (b)). Based on the RF models, we generated global distribution of SR and HR from 1982 to 2012. On average, total global SR and HR were 85.5 Pg C yr−1 (83.6–87.8 Pg C yr−1) and 50.3 Pg C yr−1 (49.2–51.1 Pg C yr−1) during this period, respectively. The global uncertainty were 27.3 (MAD) and 40.4 (SD) Pg C yr−1 for SR, and 16.9 (MAD) and 25.0 (SD) Pg C yr−1 for HR. Average global AR (the difference between SR and HR) was 35.2 Pg C yr−1 (33.9–36.9 Pg C yr−1 during 1982–2012). The global average ratio of AR contribution to SR (AR/SR) was 0.41 across all ecosystem types.
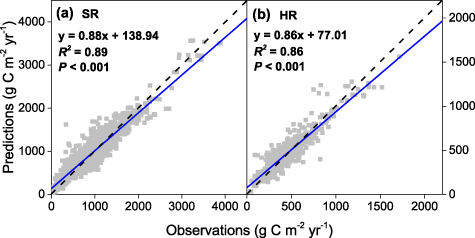
Figure 2. Observed and predicted total soil respiration (SR) (a) and heterotrophic soil respiration (HR) (b). The dash line indicates 1:1 line and the solid line is the fitted linear regression to the data.
Download figure:
Standard image High-resolution imageOverall, our results showed that the simulated SR, HR and AR were the highest in the tropical moist forest regions and lowest in cold tundra and dry desert regions (figures 3(a), (c) and (e)). The simulated ratio of AR contribution to SR pointed toward an exceptionally high contribution of AR at northern hemisphere high latitude regions (figures 3(f) and 7(d)). Generally, the CV of simulated SR and HR were highest in the regions with lower SR and HR predictions (i.e. cold tundra and dry desert regions) (figures 3(b) and (d)).

Figure 3. Global distribution of simulated average total soil respiration (SR) and the corresponding coefficient of variation (CV) (a), (b), heterotrophic soil respiration (HR) and its CV (c), (d), autotrophic soil respiration (AR) (e) and the ratio of AR to SR (f) during 1982–2012.
Download figure:
Standard image High-resolution image
Figure 7. The relationship between the simulated soil respiration and carbon pools derived from the process-based ecosystem models. SR, HR and AR indicate the soil respiration, heterotrophic soil respiration, and autotrophic soil respiration, respectively. Csoil, Clitter and Croot indicate soil organic carbon stock, litterfall carbon stock and root biomass carbon stock, respectively. The black dots in the plots showed the average outputs from each model during 1982–2012. The shade areas indicate the 95% confidential intervals. The dash lines indicate no significant relationship.
Download figure:
Standard image High-resolution image3.2. Evaluation and intercomparison of process-based ecosystem models
The performance of the RF model and the ten investigated terrestrial ecosystem models were examined against the SR and HR observations from the SRDB (figure 4). The Pearson's correlation was employed to evaluate the relationship between the observed and simulated SR and HR values. Both of the correlation coefficient for SR and HR simulated by the RF model were above 0.5 and it was larger than all the other investigated models (figures 4(a) and (b)). The RMSE was used for quantifying the spatial differences between the simulations and observations of SR and HR. The smaller RMSE indicate the better model performance for reproducing spatial pattern of SR and HR against the observations. The RMSE of SR and HR simulated by RF across the observation sites were 348 g C m−2 yr−1 and 240 g C m−2 yr−1, respectively. Comparing with the ten investigated ecosystem models, the RMSE of both SR and HR simulated by RF were the lowest (figures 4(c) and (d)). Overall, among the ten investigated ecosystem models, the VEGAS model performed the best on SR simulation (figures 4(a) and (c)), while the VEGAS and CLM5.0 model performed the best on HR simulation (figures 4(b) and (d)). The performance of the RF models was better than all the ten investigated ecosystem models.

Figure 4. The RMSE and correlation coefficient of simulated SR (a), (c) and HR (b), (d) against the observations. The RMSE shows the spatial differences between the simulated and observed SR and HR, a lower RMSE value indicates better performance of the model (a), (b). The unit of RMSE is kg C m−2 yr−1. The correlation coefficient indicates the correlation relationship between the estimates by models and the observations (c), (d). A correlation coefficient value of a model close to 1 represents good model performance.
Download figure:
Standard image High-resolution imageOur results showed large differences in the simulations of SR and its components among the investigated terrestrial ecosystem models. For SR simulation, the estimate derived by the CLASS-CTEM model (91.7 Pg C yr−1) was ∼30 Pg C yr−1 larger than the estimate of 61.4 Pg C yr−1, derived from the BEPS model (figure 5(a)). The SR simulated by the RF model was 85.5 Pg C yr−1, which was higher than the average simulated SR of the ten models (76.9 Pg C yr−1). The simulated HR ranged from 39.8 Pg C yr−1 by the ORCHIDEE model to 61.7 Pg C yr−1 by the CLASS-CTEM model. The differences of the HR simulations among the models were up to 1.5 times (figure 5(b)). The estimate of HR by the RF model (50.3 Pg C yr−1) almost matched the ensemble mean of the ten ecosystem models (50.4 Pg C yr−1). A large divergence of AR estimates was observed among the ten investigated terrestrial ecosystem models. The highest estimate of 42.3 Pg C yr−1 derived from the CLM5.0 model was 3.5 times of the lowest estimate of 12.0 Pg C yr−1 by the BEPS model (figure 5(c)). The ensemble mean of the ecosystem models (26.5 Pg C yr−1) was 8.7 Pg C yr−1 lower than the estimate by RF (35.2 Pg C yr−1). The estimates of global average AR/SR ratio varied from 18% by the LPX-Bern model to 48% by the LPJ-GUESS model (figure 5(d)).
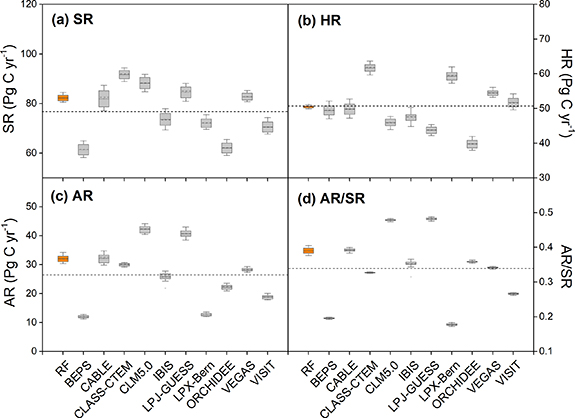
Figure 5. Simulated global annual total soil respiration (SR) (a), heterotrophic soil respiration (HR) (b), autotrophic soil respiration (AR) (c) and the average ratio of AR to SR (d) by the benchmark RF model and process-driven ecosystem models during 1982–2012. The dash lines indicate the ensemble mean of the ten ecosystem models.
Download figure:
Standard image High-resolution imageEcosystem models reproduced overall similar latitudinal variations of SR and HR (figure 6). The largest quantitative divergences among individual models were found at the tropical and subtropical regions (figures 6(a) and (b)). The simulated RF values showed similar latitudinal pattern of SR and HR with that derived from ecosystem models, except at the northern high latitudes where the RF simulations were higher than those of all process-based models between 70 and 80° north. AR showed an overall similar latitudinal pattern as SR and HR with increasing trend towards the equator (figure 6(c)). While the RF models suggest an increasing AR contribution to SR towards higher latitudes, most ecosystem models suggest a reverse trend towards highest contribution of AR at the mid-latitudes and/or the tropics (figure 6(d)).
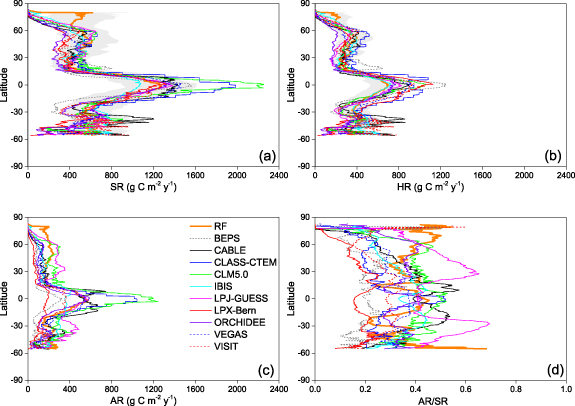
Figure 6. Latitudinal patterns of total soil respiration (SR) (a), heterotrophic soil respiration (HR) (b), autotrophic soil respiration (AR) (c) and the ratio of AR to SR (d) by the benchmark RF model and the compared process-driven ecosystem models. The grey shaded area indicates the mean ± MAD of predicted SR and HR by RF.
Download figure:
Standard image High-resolution image4. Discussion
4.1. Simulation of global SR and its components by the RF models
In this study, we developed SR and HR models by the RF method and estimated the global distribution of SR and its components (HR and AR). The model validation against the observations suggested that the RF models can reproduce very well the global patterns of SR and its components (figure 2). Our estimate of the average global SR was 85.5 Pg C yr−1, which was close to a recent estimate of 87.9 Pg C yr−1 by Warner et al (2019) generated by the RF method. However, higher estimates of SR were also reported. Hashimoto et al (2015) developed a climate-driven empirical model and yielded the mean global SR of 91 Pg C yr−1 during 1965–2012, and Zhao et al (2017) reported a mean annual global SR of 93 Pg C yr−1 using an artificial neural network model. Our estimate of global HR (50.3 Pg C yr−1) was also comparable to other estimations. Hashimoto et al (2015) employed the empiric relationship from a meta-analysis between HR and SR and estimated the mean global HR of 51 Pg C yr−1. In a recent study, Warner et al (2019) provided a global HR of 49.7 Pg C yr−1 based on the empiric ratio between HR and SR.
Other lines of evidences also implied that our estimates were reliable. Our RF simulations suggest a HR/SR ratio 0.59. Based on the global SR observations database, Bond-Lamberty et al (2018) reported that the global HR/SR ranging from 0.54 to 0.63 during 1990–2014. Our estimate of global HR/SR ratio therefore is consistent with this result. The highest AR/SR ratios in our RF simulations were observed in boreal tundra and coniferous forest ecosystems in high latitude regions (figures 3(f) and 6(d)). A recent global analysis of carbon allocation showed the larger photosynthate allocate ratio to root in boreal forests than subtropical and tropical forests (Xia et al 2019). As the CO2 emission from the autotrophic metabolism of root biomass contributes to AR, and therefore, the larger carbon allocation ratio to root in boreal forests highly increase the ratio of AR to SR.
However, the RF outputs in high latitude regions has to be seen with some caution. The CV maps of simulated SR and HR showed the highest variation in the regions with lower SR and HR predictions (i.e. cold tundra and dry desert regions) (figures 3(b) and (d)). One of the reasons is that the relatively high CV may be caused by the low estimates of SR and HR, which does not necessarily mean a higher prediction error. In other cases, the high CV of simulated SR and HR may be due to the divergent prediction distributions across the RF model (Warner et al 2019) (figure S9). Moreover, the northern high latitude regions were comparatively poorly represented in our model training dataset, and the observation records within 60–90° N regions only account for ∼8% of the total records of SRDB (figure 1). Previous study has highlighted that the quantity of the training data had strong influence on the performance of machine learning models (Chen et al 2014), and therefore sparse distribution of observations in the high latitudes may be the major cause for low reliability of the simulated AR contribution to SR. Hence, more intensive field observations regarding SR, HR and AR should be conducted in the high latitude regions in order to enhance the estimates of SR and its components. In addition, it should be cautious that ecological data are almost always spatial autocorrelated, ignoring the autocorrelation might lead to an overoptimistic performance of model validation and hide model overfitting (Dormann et al 2007, Roberts et al 2017, Ploton et al 2020). Recently, Ploton et al (2020) founded that ignoring the spatial autocorrelation of data leaded strong disparities in modeling aboveground carbon stocks of tropical forests by machine learning approaches.
Due to the defect of SR and HR measurement methods, few studies directly measured CO2 efflux from decomposing dead wood debris. That resulted in an inevitable bias on the observations of SR and HR in the SRDB. Given that, we assumed that the RF models which based on the SRDB might lead to the underestimation of SR and HR. However, the model bias highly depends on the ratio of decomposition of dead woody pools to SR. Rowland et al (2013) estimated that the respiration from the coarse wood debris (⩾10 cm diameter) is approximately 5% of annual total ecosystem respiration in tropical rainforest. Considering the grassland and the other forest biomes where the productivity and wood density is less than the tropical rainforest, we infer that the contribution of dead wood debris respiration to the total ecosystem respiration is less than 5% at global scale. The further evaluation should be conducted by integrating more observations of decomposition from dead woody pools.
4.2. Benchmark analysis of process-based ecosystem models against RF estimates
Our estimates of SR and its components by RF method provides an opportunity to conduct the benchmark analysis of ecosystem models. All investigated ecosystem models in this study estimated the global SR varying from 61.4 to 91.7 Pg C yr−1 (figure 5), however, their estimates of global terrestrial net C sink are in the reasonable ranges 3.8 Pg C yr−1 with a relative low variation (SD of 0.8 Pg C yr−1) during 2008–2017 (le Quéré et al 2018). In order to match the estimates of terrestrial net C sink within reasonable ranges, the models usually adjust estimates of vegetation gross primary production (GPP) with SR estimates. Therefore, the uncertainties of SR simulations can lead to the bias of other variables in C cycling (e.g. GPP and net primary production (NPP)). Moreover, there are large differences in the components estimates (i.e. HR and AR) (figures 5(b) and (c)). Especially, the variation of simulated AR from the ten investigated ecosystem models was higher than that of SR and HR (figure S10). It is a big challenge for current terrestrial ecosystem models that model validation and benchmark for the internal processes are absent, which strongly limits our abilities to accurately quantify the magnitude of C cycle variabilities and to predict future scenarios. In addition, the inadequate performance of internal processes also highly impacts the simulated responses of ecosystem carbon cycle to future climate change.
Based on this study and other estimates using machine learning methods and meta-analysis independently, the critical variables of global C cycling can be estimated for further model benchmarking analysis (table 1). The global GPP was reported as ∼120 Pg C yr−1 (111–126 Pg C yr−1) by FLUXCOM using machine learning methods (Jung et al 2017), and the NPP was estimated as 56 ± 14.3 (mean ± SD) Pg C yr−1 by a global meta-analysis (Ito 2011). Based on the global GPP and NPP estimates, the total ecosystem autotrophic respiration was calculated as 64 Pg C yr−1. Our results showed the AR (below ground AR) was 35.2 Pg C yr−1. Given that, the aboveground autotrophic respiration (AAR) was 28.8 Pg C yr−1. Meanwhile, this study estimated SR as 85.5 Pg C yr−1, and HR as 50.3 Pg C yr−1, thus the net ecosystem production (the residual of NPP and HR), was 5.5 Pg C yr−1. If we take the C emission due to global fire disturbance in account, which was estimated of 2.2 Pg C yr−1 during 1997–2016 (van der Werf et al 2017), the global C sink was 3.3 Pg C yr−1, this figure is very close to the estimate of 3.8 ± 0.8 Pg C yr−1 by Global Carbon Project during 2008–2017 (le Quéré et al 2018).
Table 1. Representation of C flux in global carbon cycle.
| C flux (Pg C yr−1) | Reference | C flux (Pg C yr−1) | Reference | ||
|---|---|---|---|---|---|
| GPP | 120 (111–126) | Jung et al (2017) | TAR = GPP-NPP | 64 | |
| NPP | 56 ± 14.3 | Ito (2011) | AAR = TAR-AR | 28.8 | |
| HR | 50.3 | This study | NEP = NPP-HR | 5.5 | |
| AR | 35.2 | This study | NBP = NEP-Disturb | 3.3 | |
| Disturb | 2.2 | van der Werf et al (2017) | NBP | 3.8 ± 0.8 | le Quéré et al (2018) |
Note: GPP: gross primary productivity; NPP: net primary productivity; HR: heterotrophic soil respiration; AR: autotrophic soil respiration; TAR: total ecosystem autotrophic respiration; AAR: aboveground autotrophic respiration; NEP: net ecosystem productivity; NBP: net biosphere productivity; Disturb: C emission due to global fire disturbance.
4.3. Intercomparison of process-based ecosystem models
Basically, the magnitude of simulated SR and HR was determined by environmental variables (e.g. soil temperature and moisture), respiration substrates and model parameters (e.g. SOC transit time, temperate sensitivity). Our results showed no significant relationship between simulated SR and SOC, litterfall and root biomass C stocks among the investigated ecosystem models (figure 7). The results suggested the parameterization exerted more important influence on the SR simulation than SOC, litterfall and root biomass C stocks, although there were extensive differences of simulated C pools among investigated models (figure 8). Other lines of evidences also support this conclusion that terrestrial ecosystem models have shown substantial differences of soil C transit time (Wang et al 2019). For example, there is a four-fold difference in the simulated C transit time among the ESMs from the CMIP5 (Todd-Brown et al 2013). In addition, the soil and litter C pools is a result of C input and decomposition at long time scale and a proportion of SOC was chemically and physically protected from decomposition by microbes, which contribute to the recalcitrant carbon pools (Bradford et al 2016). We further examined the variation of simulated GPP and NPP and their relationship with the simulated SR and its components among ecosystem models (figure 9). Significant positive relationship was observed between simulated NPP and HR (figure 9(d)). It can attribute to the changes of litterfall production induced by NPP which directly impact the HR. However, there were no significant correlation between AR and GPP (figure 9(e)). AR only represents the root respiration, and therefore the ecosystem GPP hardly explains the differences of AR among various models. Our results highlight that detailed analysis should be conducted to investigate the relationship between AR and the ratio of the photosynthates allocating to belowground components.

Figure 8. Estimated global soil carbon stock (a), litterfall carbon stock (b), root biomass carbon stock (c), gross primary production (GPP, d) and net primary production (NPP, e) by the diverse ecosystem models.
Download figure:
Standard image High-resolution image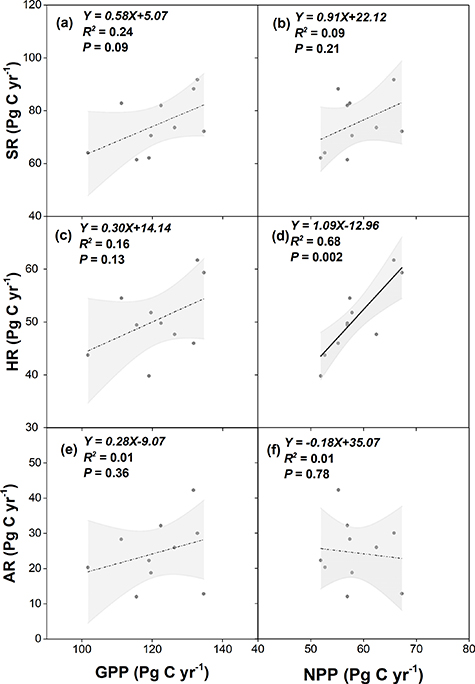
Figure 9. The relationship between the simulated soil respiration and vegetation production derived from the process-based ecosystem models. SR, HR and AR indicate the soil respiration, heterotrophic soil respiration, and autotrophic soil respiration, respectively. GPP and NPP indicate gross primary production and net primary production, respectively. The black dots in the plots showed the average outputs from each model during 1982–2012. The shade areas indicate the 95% confidential intervals. The dash lines indicate no significant relationship.
Download figure:
Standard image High-resolution image
Moreover, previous studies also highlighted the importance of the Q10 (temperature sensitivity of SR) value in current terrestrial ecosystem models to the divergent of HR simulations (Holland et al 2000, Todd-Brown et al 2014). Furthermore, some ESMs employ constant Q10 values whereas highly spatial variability of Q10 has been widely observed in field studies (Anav et al 2013). Those simplified representations can contribute to the poor model performance on SR simulations (figures 4 and 6). In addition, the global SR, HR, AR and AR/SR of different ecosystem types simulated by the ecosystem models were estimated. The highest CV of the simulated SR, HR, AR and AR/SR by the ecosystem models were observed in open shrublands/tundra ecosystems which mainly distributed in the northern high latitude regions (tables S2–S5). That might attribute to the large divergences in simulating permafrost soil carbon and turnover time among the ecosystem models (Todd-Brown et al 2013). This also suggested that more field observation of SR should be conducted in those regions to constrain the ecosystem models.
5. Conclusion
The accurate estimation of global SR and its components is crucial to the projection of terrestrial C budgets. In this study, we developed SR models by the RF method based on the global observed SR database. The RF model performed well on simulating the global distribution of SR and its components. The estimates of global average total SR, HR and AR were 85.5, 50.3 and 35.2 Pg C yr−1 during 1982–2012, respectively. Comparing with the observation data, the RF models showed better performance than all the investigated ecosystem models. Moreover, inter-comparison of the ten terrestrial ecosystem models revealed large divergence of model performance on SR simulation. All the models could reproduce the spatial patterns of SR, but substantial differences in magnitude of simulations were shown. Our study provided an extensive and normalized global distribution of SR and its components, which can be used as a benchmark for advancing ecosystem models and their parameterization and validation.
Acknowledgments
This study was supported by the National Science Fund for Distinguished Young Scholars (41925001), National Key Basic Research Program of China (2018YFA0606104), Innovation Group Project of Southern Marine Science and Engineering Guangdong Laboratory (Zhuhai) (NO.311020008), Guangdong Basic and Applied Basic Research Foundation (2020A1515111145) and Fundamental Research Funds for the Central Universities (19lgjc02, 18lgpy09).
Data availability statement
The data that support the findings of this study are available upon reasonable request from the authors. The globally gridded dataset of soil respiration and its components we generated using the Random Forest method are free to the public for scientific purpose and can be downloaded at https://doi.org/10.5281/zenodo.4686669