

Abstract
Soils are warming as air temperatures rise across the Arctic and Boreal region concurrent with the expansion of tall-statured shrubs and trees in the tundra. Changes in vegetation structure and function are expected to alter soil thermal regimes, thereby modifying climate feedbacks related to permafrost thaw and carbon cycling. However, current understanding of vegetation impacts on soil temperature is limited to local or regional scales and lacks the generality necessary to predict soil warming and permafrost stability on a pan-Arctic scale. Here we synthesize shallow soil and air temperature observations with broad spatial and temporal coverage collected across 106 sites representing nine different vegetation types in the permafrost region. We showed ecosystems with tall-statured shrubs and trees (>40 cm) have warmer shallow soils than those with short-statured tundra vegetation when normalized to a constant air temperature. In tree and tall shrub vegetation types, cooler temperatures in the warm season do not lead to cooler mean annual soil temperature indicating that ground thermal regimes in the cold-season rather than the warm-season are most critical for predicting soil warming in ecosystems underlain by permafrost. Our results suggest that the expansion of tall shrubs and trees into tundra regions can amplify shallow soil warming, and could increase the potential for increased seasonal thaw depth and increase soil carbon cycling rates and lead to increased carbon dioxide loss and further permafrost thaw.
Export citation and abstract BibTeX RIS
1. Introduction
Rapid increases in air temperature across the Arctic and Boreal region are associated with warming soils, thawing permafrost, and expanding tall-statured shrubs and trees in the tundra (Romanovsky et al 2003, Myers-smith et al 2011, Elmendorf et al 2012). Warming soils place the vast pool of carbon frozen in permafrost at risk of thawing and releasing greenhouse gases into the atmosphere (Schuur et al 2015, Biskaborn et al 2019). Warming soils also impact belowground plant function and root growth (Iversen et al 2015), modifying plant nutrient use, primary productivity, and transpiration (Cable et al 2014, Lafleur and Humphreys 2018, Hewitt et al 2019). Warmer soils and deeper seasonal thaw alter soil nutrient and carbon cycling (Keuper et al 2012, Salmon et al 2016, Finger et al 2016). Thus, quantifying the degree of soil warming is critical to understanding future ecosystem function and the stability of underlying permafrost (Jorgenson et al 2001, Loranty et al 2018).
Vegetation change across the pan-Arctic is altering land surface energy dynamics with critical implications for soil thermal regimes in the permafrost region (Elmendorf et al 2012, Myers-Smith et al 2015, Martin et al 2017). Experimental manipulations of shrub cover in tundra ecosystems indicate that increasing shrub canopy ('shrubification') cover reduces summer soil temperatures and decreases the depth of seasonal thaw via canopy shading (Blok et al 2010, Myers-Smith and Hik 2013). In contrast, a recent study using eddy covariance measurements suggests that shrubs are associated with warmer summer soil temperatures (Lafleur and Humphreys 2018). Shrubs increase winter soil temperatures due to insulation by trapping snow (Myers-Smith et al 2015). The net effect on annual thermal regimes may depend on local and seasonal environmental conditions including microclimate, topography, and soil properties (Zellweger et al 2020), and individual plot scale studies provide limited insight. The lack of consensus in plot scale observations creates uncertainty regarding potential feedbacks of shrubification in the tundra, and calls for a larger scale assessment of the impacts of vegetation on soil temperature.
Treeline advance may have similar soil temperature consequences to shrub expansion since observations indicate that greater tree leaf area is associated with decreased summer thaw depths (Fisher et al 2016). Associations between boreal forest cover and snow depth have also been related to warmer winter soil temperatures (Jean and Payette 2014). However, the effects of changing forest cover on soil temperatures has received considerably less attention compared to shrub expansion studies. This is an important knowledge gap as links between vegetation structure and soil thermal dynamics are critical for assessing the vulnerability of permafrost to ongoing climate warming and vegetation shifts (Lawrence et al 2012, Cable et al 2016).
The current understanding of boreal and tundra vegetation impacts on soil temperature is limited to local or regional scales (Blok et al 2010, Fisher et al 2016, Paradis et al 2016, Frost et al 2018) and lacks the generality necessary to predict soil warming and permafrost stability on a pan-Arctic scale. The net effects of vegetation on annual thermal regimes may also reflect local and seasonal meteorological and soil conditions. A synthesis of high-latitude studies with broader geographic coverage and greater variability in soil and site conditions can offer the potential to evaluate whether plot scale observations of vegetation impacts on soil temperature are consistent across studies within similar types of vegetation (Fidler et al 2017). Here we establish empirical linkages between observations of vegetation and air-soil temperatures using 106 sites located within nine common Arctic and Boreal vegetation types (Walker et al 2005) to address the following questions: (a) do shrubs and trees cool shallow soils during the warm season? (b) how does vegetation affect cold season soil temperatures? (c) does vegetation influence the seasonal dynamics of soil temperature on annual timescales?
2. Methods
2.1. Temperature data
Daily average soil and air temperature was compiled from 235 sites across the Arctic-boreal region that are underlain by permafrost and that include a vegetation description at the study locations. We compiled a total of 877 305 soil temperature observations and 304 492 air temperature observations. Figure 1 displays the pan-Arctic permafrost extent (Brown et al 2011) with study sites to provide context. Table 1 contains a full break down of the number of observations and sites for each vegetation type and table S1 (is available online at https://stacks.iop.org/ERL/16/015001/mmedia) (electronic supplement) contains site descriptions for all sites used in analysis, and table S2 (electronic supplement) information for all 235 sites initially compiled.

Figure 1. Map of study sites for each vegetation type shown with permafrost extent. Geographical locations of study sites are shown with a proportional representation of each vegetation type in a 100 km radius as a single point. The number of sites represented by each point is indicated in the center of the circle.
Download figure:
Standard image High-resolution imageTable 1. Summary of site and temperature observations in analysis.
| Vegetation type | Number of Sites | Site x years | Number of daily soil temperature observations | Number of daily air temperature observations |
|---|---|---|---|---|
| Herb-barren | 2 | 9 | 5096 | 3193 |
| Graminoid tundra | 24 | 85 | 68 574 | 33 289 |
| Short shrub tundra | 24 | 109 | 54 520 | 43 476 |
| Tussock tundra | 17 | 77 | 58 520 | 33 609 |
| Wetland | 15 | 35 | 13 915 | 12 241 |
| Tall shrub tundra | 5 | 73 | 77 372 | 27 058 |
| Evergreen needleleaf boreal | 10 | 25 | 16 892 | 10 964 |
| Deciduous needleleaf boreal | 6 | 9 | 5760 | 3100 |
| Mixed boreal | 3 | 7 | 5111 | 2432 |
| Total | 106 | 429 | 305 973 | 169 362 |
Our analysis focused on a total of 106 sites with 305 973 soil and 169 362 air temperature observations that met the following considerations to achieve a harmonized analysis, and the remaining 129 sites originally compiled were not used in the analysis. The 106 sites used in the analysis were selected based on the criteria explained below. We focused only on soil temperature measured within the top 20 cm of the active layer, and sites without observations in the upper 20 cm were not included. We focus on the temperature in the upper 20 cm of the active layer has the closest coupling to the air temperature and influences the temperature of the soil below (Smith and Riseborough 1996, Hillel 1998). An initial analysis demonstrated that soil temperature varies nonlinearly at depths below 20 cm, and this nonlinear relationship can be highly variable between sites. Our sample size of sites with data below 20 cm was too limited to adequately characterize these deeper depths across the study domain, and thus any sites that did not make observations in the upper 20 cm of the soil were excluded. Air temperature measurements also needed to be taken from a minimum height of 1 m to avoid measurements within the snow during the winter. Sites with air temperature sensors mounted below 1 m in height above the ground were excluded. We use water years (October–September) rather than the calendar year to characterize annual temperature patterns since winter soil temperatures will be highly dependent on autumn soil temperature and snow accumulation. Sites needed at least 75% of a water year with observations to be included in the study. To avoid confusion with calendar year seasons and the ambiguity of defining transition periods, we define seasonality based on when site temperatures are below freezing (cold season) and above freezing (warm season).
2.2. Vegetation data
Each site was classified into a vegetation type based on the growth form of the dominant plant cover. We classified tundra plant communities similar to the broad physiognomic categories that vegetation communities are grouped in by Walker et al (2005) to allow for our results to be placed into to broader geographical contexts. Boreal vegetation classes were classified by leaf functional type of the dominate tree cover including evergreen needleleaf boreal forest, deciduous needleleaf boreal forest, and mixed evergreen needleleaf and deciduous broadleaf boreal forest. Tundra vegetation types include herb barren, graminoid tundra (non-tussock forming), short shrub tundra (<40 cm in height), tussock tundra, tall shrub tundra (>40 cm in height), and wetland. Here we separated wetland as any vegetation type that experiences inundation throughout the duration of the warm season rather than a single plant functional type deviating from Walker et al (2005). We also simplified shrub categories from Walker et al (2005) including all dwarf and prostrate shrubs in our short shrub category and all tall shrubs defined as above >40 cm. Herb-barren and deciduous needleleaf have limited geographic scope with a few sites located in close proximity. We included these sites for comparison, but caution against broader geographic extrapolation.
2.3. Soil and air temperature models
Many sites have incomplete observations of air or soil temperature throughout a water year due to the timing of sensor deployment or sensor failure. We implemented a phenomenological model of daily soil temperature in a Bayesian framework to account for missing observations. We used this model to gap fill missing temperature observations in the sites with 25% or less missing data in a water year. Using a statistical modelling approach allowed us to avoid bias in metrics such as mean annual, maximum, and minimum temperatures that can be heavily biased with missing observations and quantify uncertainty in these metrics. This modelling approach also provided a quantitative comparison of annual soil temperature patterns throughout a water year, and these parameters can be compared between sites in empirical models to better understand variabilities in air-soil temperature decoupling. A full description of the daily soil and air temperature model is included in the electronic supplement.
2.4. Empirical vegetation-temperature relationships
We implemented empirical models of air and soil annual temperature parameters (maximum, minimum, and mean annual soil temperature) to evaluate the influence of vegetation on air-soil temperature decoupling. We compared differences between the air and soil minimum and maximum temperature in a year and the number of days in the water year that were above zero across sites. We used a normalized measure of air and soil temperature decoupling to understand the cumulative decoupling of temperatures above and below freezing (Smith and Riseborough 1996, 2002). The n-factor for the freezing degree day soil:air ratio (nf) was calculated from the degree days below freezing (FDD), and the thawing n factor (nt) was calculated from the degree days above freezing (TDD):

We implemented multiple regressions in a Bayesian framework to evaluate empirical relationships between vegetation type and soil temperature parameters. We included the uncertainty from the air and soil temperature model in the empirical models of temperature parameters and n-factors that had missing observations using a Berkeson error model to account for uncertainty in parameters. A multiple linear regression was conducted in a hierarchical Bayesian framework with the corresponding air temperature parameter and depth of measurement used as covariates and the vegetation type treated as fixed effects. This approach allowed us to compare soil temperature parameters between vegetation types while controlling for air temperature and sensor placement. Since we compare multiple soil temperature parameters between nine vegetation groups, we used a Bonferroni correction on credible intervals for any statistical inferences made between groups to help account for the many comparisons in this analysis (Ogle et al 2019).
3. Results
3.1. Soil and air temperature models
The daily soil temperature model had a model fit with R2 of 0.95 (figure S1, electronic supplement). Soil temperature data were slightly over-predicted at low temperatures (<−15 °C) and under-predicted at higher temperatures with a least squares regression intercept of −0.09 at an observed temperature of 0 °C and slope of 0.95 °C per 1 °C increase in observed soil temperature. The daily air temperature model fit had a R2 of 0.83 (figure S1, electronic supplement). Air temperature data were slightly over-predicted at low temperatures (<−10 °C) and under-predicted at higher temperatures with a least squares regression intercept of −1 °C at an observed temperature of 0 °C and slope of 0.83 °C per 1 °C increase in observed soil temperature. The empirical models of annual temperature measures with vegetation type, depth in soil, and annual air temperature measures had model fits with R2 of 0.69 for minimum soil temperature, R2 of 0.70 for maximum soil temperature, and R2 of 0.72 for mean annual soil temperature (figure S2). Bivariate plots of the relationship between the air and soil temperatures in these empirical models are shown in figure S3. Models accounting for soil depth within each vegetation type for the n-factors, and the length of days above freezing had model fits with R2 = 0.51, 0.69, and 0.28, respectively (figure S4).
3.2. Warm season soil temperatures
Boreal forests and tussock tundra have lower soil temperatures in the warm season than other tundra vegetation types after accounting for air temperature and the depth of measurement. In above-freezing conditions, soil temperatures are highly decoupled from the air with a thawing n-factor at the soil surface (0 cm) far below one in boreal forests (figure 2(a)) with a ratio of 0.73 [Bonferroni adjusted 95% credible interval (CI): 0.54, 0.90] for evergreen needleleaf and 0.53 (CI: 0.38, 0.67) for deciduous needleleaf forests. Tussock tundra soil temperatures showed the greatest degree of decoupling from air temperatures compared to all other tundra types with a ratio of 0.81 (CI: 0.76, 0.87). Soils in herb-barren, graminoid tundra, and tall shrub tundra tended to be similar or warmer than the air with a thawing n-factor at or above one (figure 2(a)).

Figure 2. Thawing n-factor (a). Mean estimates of number of days in a year above freezing for each vegetation type at a depth of 0 cm (b). Mean annual maximum air temperature for each vegetation type at a depth of 0 cm and an air temperature maximum of 12 C (c). Boxes contain 25th and 75th percent credible intervals and whiskers show Bonferroni corrected credible intervals for a 5% significance level used to assess differences between vegetation types.
Download figure:
Standard image High-resolution imageSoil temperatures remain above-freezing for the longest time period in boreal forests, wetlands, short shrub tundra, and tussock tundra with a statistically similar length of time ranging between 160 and 174 d on average (figure 2(b)). Under the same air temperature maximum of 12 °C and at the soil surface (0 cm), deciduous needleleaf boreal forests had the lowest maximum soil temperatures that were roughly 5 °C lower than the air (6.9; CI: 4.2, 10.3). Tall shrub tundra had slightly higher maximum soil temperatures than the air (12.7 °C; CI: 12.1, 13.2), and higher maximum soil temperatures than graminoid tundra (11.1 °C; CI: 10.8, 11.5). The similarity in the length of days above-freezing between different vegetation types suggests that differences in warm season soil temperature coupling to the air temperature is driven by magnitude of the maximum soil temperature rather than the length of time above freezing.
3.3. Cold season soil temperatures
Short shrub tundra, graminoid tundra, and herb-barren had the lowest soil temperatures in the cold season and all other vegetation types had similar soil temperatures despite broad differences in canopy height and characteristics between these vegetation types. The freezing n-factors indicated that tall shrub, tussock, wetlands, and boreal forest soils were much warmer than the air with the highest decoupling from air temperatures (figure 3(a)), varying between 0.30 (CI: 0.12, 0.47) in deciduous needleleaf forests and 0.39 (CI: 0.35, 0.43) in tall shrub tundra. Short shrub and graminoid tundra had much closer coupling of freezing soil temperatures to the air with freezing n-factors of 0.62 (CI: 0.57, 0.68) and 0.58 (CI: 0.55, 0.62), respectively. Herb-barren soils were colder than the air with a freezing n-factor of 1.2 (CI 1.11, 1.29).

Figure 3. Freezing n-factor (a) for each vegetation type at a depth of 0 cm. Mean annual minimum air temperature for each vegetation type at a depth of 0 cm and an air temperature maximum of −22 C (b). Mean annual temperature for each vegetation type at a depth of 0 cm and an average annual air temperature of −6 C (c). Boxes contain 25th and 75th percent credible intervals and whiskers show Bonferroni corrected credible intervals for a 5% significance level used to assess differences between vegetation types.
Download figure:
Standard image High-resolution imagePatterns in minimum soil temperature followed similar patterns as the freezing degree day ratios with herb barren, short shrub tundra, and graminoid tundra experiencing the lowest temperatures. Under a standardized air temperature of −22 °C and at the soil surface (0 cm), minimum soil temperatures were −13.8 °C (CI: −14.7, −12.9) in graminoid tundra and −15 °C (CI: −16.1, −13.9). Soil temperatures were much higher than the air in boreal forests with evergreen needleleaf at −7.3 °C (CI: −11.6, −3.4) and deciduous needleleaf at −1.9 °C (CI: −10.6, 10). Tall shrub and tussock tundra had similar minimum soil temperatures of −8.8 °C (CI: −9.7, −7.9 and CI: −9.9, −7.6, respectively). Long-term patterns of winter precipitation derived from WorldClim data illustrate greater variability within than between vegetation types (figure S5), suggesting that geographic patterns in snowfall do not contribute to winter soil temperature patterns that we observe. We also found overlap in latitude and air temperatures (figures S6–S8) in most vegetation types indicating that potential differences between vegetation types likely do not reflect regional or climatic patterns for most vegetation types.
3.4. Annual soil temperature dynamics
Ecosystems with vegetation with very short canopies (<40 cm: herb barren, graminoid, and short shrub tundra) have the lowest mean annual soil temperatures compared to ecosystems characterized by trees or tall shrub vegetation types (figure 3(c)). Patterns in mean annual temperature closely followed patterns in minimum soil temperature (figures 3(b) and (c)). At a standardized mean annual air temperature of −6 °C, mean annual soil temperatures in short shrub and graminoid tundra are −2.8 °C (CI: −3.3, −2.4) and −2.5 °C (CI: −2.9, −2.2), respectively, approximately two degrees lower than mean annual soil temperatures in evergreen needleleaf boreal forests and tall shrub tundra (figure 3(c)).
Variation in mean annual soil temperature is primarily driven by the minimum soil temperature in the cold season (figures 4(a) and (b)) in all vegetation types, and is likely linked to the latent heat exchange necessary for warming frozen soil. Surprisingly, summer maximum soil temperatures showed weak relationships (figures 4(c) and (d), tables S3 and S4), explaining 9%–50% of variability in mean annual temperature in most tundra vegetation types with the exception of herb-barren and tall shrub tundra. Mean annual soil temperature and maximum soil temperatures were closely related in (R2 = 0.80) in herb-barren. There was no significant relationship in tall shrub tundra. Mean annual soil temperature was also not significantly related to maximum soil temperatures in all boreal forest types indicating that warmer summer conditions do not necessarily increase mean annual temperatures. Maximum soil temperature was not significantly related to minimum soil temperature with the exception of tall shrub tundra (electronic supplement, figure S9). Colder minimum temperatures were associated with warmer maximum temperatures in tall shrub tundra. This demonstrates that for many vegetation types, cold season conditions predominately drive mean annual soil temperatures, and there is not a strong coupling between cold season and warm season soil temperatures.

Figure 4. Relationship between annual minimum (a), (b) and maximum (c), (d) soil temperature with average annual soil temperature for each vegetation type. Significant linear relationships for each vegetation type are shown with lines and shaded polygons represent Bonferroni corrected credible intervals for a 5% significance level. Dashed lines show the mean value for the vegetation type when the regression is not significant.
Download figure:
Standard image High-resolution image4. Discussion
4.1. Impacts of vegetation on cold- and warm-season soil temperature
We found that tall shrub tundra had the highest soil temperatures after herb-barren during the warm season (figures 2(a)–(c)) when normalized by air temperature, contrary to observations of local soil cooling associated with shading from shrubs in the warm season (Blok et al 2010, Loranty et al 2018). Short shrub tundra also had higher temperatures than boreal forests and tussock tundra. Tall and short shrub ecosystems do not reflect the localized cooling effect of shading observed by other studies (Sturm et al 2001, Hinzman et al 2005, Myers-smith et al 2011), but rather exhibited relatively tight coupling with warm season air temperatures. Consequently, record high summer air temperatures across the Arctic (Serreze and Barry 2011, Overland et al 2017) may have a greater impact on warm season ecosystem processes such as plant phenology and productivity and nutrient dynamics in tundra ecosystems compared to boreal ecosystems (Loranty et al 2018, Post et al 2019). The cooling impact of shrubs during summer observed in manipulation experiments (Blok et al 2010, Myers-Smith and Hik 2013, Nauta et al 2015), likely describes a highly localized microclimate effect that is limited to directly below the shrub canopy (Lantz et al 2013). Our results indicate that such microclimate effects are awash in a larger dataset that includes a broader range of measurement probe locations within the ecosystem and varied meteorological conditions. As such, we acknowledge the limited geographic scope of herb-barren and deciduous needleleaf forest in this study are not necessarily representative of pan-Arctic wide patterns. Our results highlight that individual plot scale results in the warm season are highly localized results and measurements in localized regions are not suitable for broadly generalizing how vegetation can impact soil temperatures across the permafrost region.
We found that cold season soil temperatures were more consistent between vegetation types compared to the warm season, and vegetation types that are characterized by short canopies had the lowest temperatures after controlling for air temperature. While we were unable to control for snow cover in our analyses, the broad geographic and climatological ranges captured by our sample sites (figures S6–S9) indicate that our results do not reflect regional variation in snowfall. Vegetation affects cold season soil temperatures through impacts on snow distribution and snowpack characteristics (Essery and Pomeroy 2004, Myers-smith et al 2011). Greater shrub height (Paradis et al 2016, Frost et al 2018) and higher forest cover (Jean and Payette 2014) are directly linked to higher winter soil temperatures, but we observe similarly high cold-season soil temperatures across all tall shrubs and trees. The insulating effect of snow on soil temperatures saturates at snow depths as low as 20 cm (Slater et al 2017), and thus geographic variation in snow cover or large differences in canopy height between the shrubs and trees in our study may have minimal influence across our broad geographical scope.
4.2. Vegetation and soil temperature on annual timescales
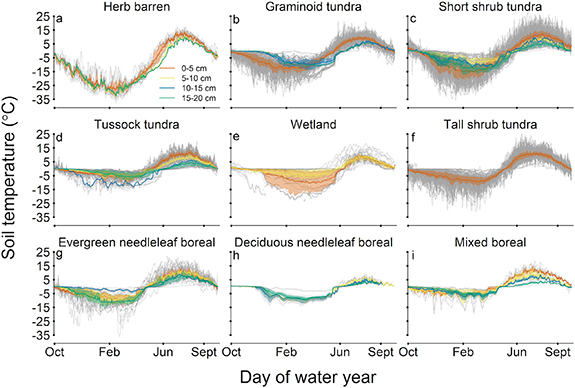
Overall, we found that annual soil thermal regimes in the permafrost region are dominated by cold season conditions likely due to physical processes associated with frozen soils such as higher thermal conductivity in frozen soils, the amount of latent heat necessary to thaw soils, the influence of snow meltwater in the spring, and the release of latent heat in freezing soils (Shur and Jorgenson 2007, Throop et al 2012). Herb barren was the only vegetation type where both minimum and maximum temperatures were highly correlated with the mean annual soil temperatures as is typical for annual fluctuations in soil temperature (Hillel 1998). Annual patterns in soil temperature have a longer duration of the cold season than the warm season (figures 2(b) and 5) and soils in all vegetation types excluding herb-barren had some sites that experienced a zero curtain. The zero curtain is characterized by a prolonged time period (days–months) when temperatures linger near zero due to latent heat associated with freeze/thaw or the addition of snow meltwater into the soil (figure 5). Mean annual soil temperature did not significantly vary with warm season maximum temperatures in boreal and tall shrub tundra suggesting that mean annual conditions are more sensitive to temperature changes in the cold season.
Figure 5. Mean daily soil temperature data (0–20 cm) throughout the water year (October–September) for each vegetation type for all observations (grey lines). Mean daily soil temperature within each vegetation type is shown with the 25th and 75th percentiles for depth increments of 0–5 cm (red), 5–10 cm (yellow), 10–15 cm (blue), and 15–20 cm (green).
Download figure:
Standard image High-resolution image
Surprisingly, higher winter soil temperatures were not associated with higher summer soil temperatures with no relationship between minimum and maximum temperatures in all vegetation types except for tall shrub tundra (figure S5). Sites with colder minimum temperatures tended to have warmer maximum temperatures in tall shrub tundra. It is likely that sites with warmer minimum temperatures and colder maximum temperatures could experience prolonged periods of freeze/thaw cycles due to high water content in the soil (Outcalt et al 1990, Romanovsky and Osterkamp 2000). This indicates that soil thermal characteristics and snow that influence coupling with air temperature are likely a driving factor in seasonal soil temperature amplitude (Nicholson 1979, Smith and Riseborough 1996). Further assessment of seasonal soil heat fluxes, soil moisture conditions, and vegetative traits and function would help elucidate the plot level seasonal drivers of temperature (Loranty et al 2018). In our synthesis, we found a paucity of data that simultaneously quantified vegetation composition and structure, soil moisture, soil, and snow properties. These inconsistencies are compounded by variation in duration of data availability, measurement height or depth in soil and air temperature measurements. While our modelling approach allowed us to overcome many of these issues, it is clear there is a continued need for better understanding the biological and physical drivers of soil-vegetation-atmosphere continuum coupling in the permafrost region, especially those related to interactions between vegetation canopies and snow cover.
4.3. Soil temperature and climate change
Our results indicate that ongoing vegetation change across the Arctic will alter relationships between air and soil temperatures with continued climate warming. Widespread tree and shrub expansion are among the most prominent changes, and will accelerate soil warming (Chapin et al 2000, Tape et al 2006, Pearson et al 2013, Frost and Epstein 2014). However, emerging evidence indicates that pan-Arctic vegetation change is not unidirectional (Phoenix and Bjerke 2016). Advances in long-term monitoring and remote sensing technologies have revealed heterogeneity in Arctic vegetation change typically inferred by time series analyses of satellite data (Myers-Smith et al 2020). In boreal forests, disturbances such as fire and permafrost thaw may lead to net declines in forest cover at the landscape scale (Helbig et al 2016, Sniderhan and Baltzer 2016). Consequently, accurate predictive understanding of future pan-Arctic soil temperature regimes, and associated impacts on permafrost and related climate feedbacks will require detailed understanding of vegetation dynamics. The contrary outcomes between some plot-scale shrub manipulations and our results demonstrates that small scale (meters–-kilometers) spatial heterogeneity around plant canopies likely impacts soil temperatures (Palmer et al 2012). Our synthesis of plot scale observations demonstrates that there are clear differences between trees, tall shrubs, and short tundra vegetation at larger spatial scales, but we cannot discern the causal mechanisms underlying these differences from our data alone. Our study suggests that a better understanding of the spatial heterogeneity in snow and soil conditions around plant canopies would lead to a better understanding of the impacts of vegetation on ground thermal regimes. Standardized and consistent methodological approaches that concurrently measure vegetation, snow, soil properties, and hydrologic conditions from plot to ecosystem scales with spatial coverage throughout the pan-Arctic and boreal regions would greatly enhance the causal understanding of vegetation impacts on soil temperature.
Permafrost temperatures are rising as the Arctic experiences increases in air temperature (Hinzman et al 2005, Romanovsky et al 2010), but rates of temperature increase vary with local hydrological conditions, soil thermal properties, and vegetation characteristics (Jorgenson et al 2001, Romanovsky et al 2010, Cable et al 2016). The mean annual temperature of the permafrost table is typically correlated with the mean annual temperature of the ground surface (Smith and Riseborough 1996, Romanovsky et al 2003). Our measures of mean annual surface soil temperature have implications for permafrost temperatures, but permafrost temperatures ultimately depend on both surface thermal dynamics and characteristics that affect heat transfer in the soil such as thermal conductivity and moisture content (Smith and Riseborough 1996, Cable et al 2016). Our work, for instance, does not quantify vegetation impacts on soil thermal conductivity (such as transpiration-driven soil drying that reduces conductivity), which might decouple the influence of warming surface soil temperatures on permafrost (Loranty et al 2018).
During the cold season, soil respiration is a significant source of carbon dioxide and can increase by a factor of 2.9–8.5 per 10 °C increase in winter soil temperature (Natali et al 2019). Our observations demonstrate that minimum soil temperatures are 4 °C–20 °C greater in tall shrub and tree vegetation types relative to short-statured vegetation types under the same air temperature. Though we cannot rule out the possibility that soil temperature increases preceded vegetation change, our results nonetheless imply that observed vegetation change across the Arctic may be associated with increased winter greenhouse gas emissions from soil respiration in recent decades. In the long term (centuries to millennia), soil warming that results in permafrost degradation and soil warming will alter carbon accumulation (Swanson et al 2000). Overall, continued increases in vegetation height associated with tall shrub and trees expansion over the next century (Myers-smith et al 2011, Elmendorf et al 2012) lead to warmer shallow soils and increase the potential for a permafrost carbon climate feedback.
Vegetation change across the Arctic has the potential to affect the coupling between air and soil temperatures, with important implications for soil and carbon dynamics in permafrost regions. Numerous field studies have provided insights regarding the direction and magnitude of soil temperature changes associated with vegetation transitions, primarily at the seasonal timescale. Our pan-Arctic synthesis reveals that trees and shrubs promote warmer shallow soil temperatures at annual timescales, mainly due to warmer cold-season soil temperatures. Summer air temperatures do not have strong impacts on annual soil temperature dynamics, and so will primarily affect seasonal plant function and soil carbon dynamics in most tundra vegetation types. Tree and shrub expansion will amplify the effects of climate warming on soil temperature potentially leading to increases in winter carbon emissions and could increase permafrost temperature and thaw.
Acknowledgments
We thank G Peter Kershaw, LeeAnn Fishback, Cathy Wilson, and Coleen Iversen for assistance in collection of data. We thank the Permafrost Carbon Network for support and organization of the data synthesis. We thank Vladimir Romanovsky for his feedback and contribution of publicly available data. This project was supported by the National Science Foundation (Grant No. 1417745 to M L, Grant No. 1417700 to S M N, Grant No. 1417908 to A K, Grant No. 1556772 to A R, Grant No. 1637459 to L G, Grant No. 1636476 and Grant No. 1503912 to E S E, Grant No. 1806213 to B M J, Grant No. 1833056 to K D T), UK Natural Environment Research Council (Grant No. NE/M016323/1 to I H M S, Grant No. NE/K00025X/1 to G K P, Grant No. NE/K000292/1 to M W), Natural Sciences and Engineering Research (to P L, I H M S, Grant No. RGPIN-2016-04688 to D O), Council of Canada, Canadian Graduate Scholarship to (I H M -S), Greenland Ecosystem Monitoring Programme: ClimateBasis (to J A and K A), The Next-Generation Ecosystem Experiments (NGEE Arctic) project is supported by the Office of Biological and Environmental Research in the DOE Office of Science (to A L B), Engineer Research and Development Center Army Direct (6.1) Research Program and the Strategic Environmental Research and Development Program (projects RC-2110 and 18-1170 to T A D), United States Geological Survey (to E E S), Arctic Challenge for Sustainability (ArCS; Grant No. JPMXD1300000000) and ArCS II (Grant No. JPMXD1420318865) (to M U and H I), the Danish National Research Foundation (Grant No. CENPERM DNRF100 to B E), the Academy of Finland (Grant No. 315519), the National Research Foundation of Korea (Grant Nos. NRF-2016M1A5A1901769; KOPRI-PN20081 to K Y and B Y L), Research Network for Geosciences in Berlin and Potsdam (to I G), the Swiss National Science Foundation (Grant No. 140631 to G S S), the URPP Global Change and Biodiversity, University of Zurich (to G S S), the University of Alberta Northern Research Awards (to D O), and the Northern Scientific Training Program (to D O), and UT-Battelle, LLC, under contract DE-AC05-00OR22725 with the US Department of Energy (DOE) Office of Science, Biological and Environmental Research (to V G S). S M has been supported by grants and/or in-kind from Natural Sciences and Engineering Research Council of Canada, AMAX Northwest Mining, Co. (North American Tungsten Corp., Ltd), Imperial Oil, Ltd, University of Alberta, Earthwatch International (EI), The Garfield Weston Foundation, Wapusk National Park, Churchill Northern Studies Centre, and the Northern Scientific Training Program. All code for this project are archived (DOI: 10.5281/zenodo.4041165). The data that support the findings of this study are openly available through the Arctic Data Center (Heather Kropp, Michael Loranty, Britta Sannel, Jonathan O'Donnell, Elena Blanc-Betes, et al 2020. Synthesis of soil-air temperature and vegetation measurements in the pan-Arctic. 1990-2016. Arctic Data Center. doi:10.18739/A2736M31X).
Data availability statement
The data that support the findings of this study are openly available at the following URL/DOI: doi:10.18739/A2736M31X. Data will be available from 03 July 2020.
Author contributions
H K, M L, and S M N conceived the work. H K performed data analysis and generated figures. H K, M L, S M N, A R, I H M S, B A, J A, E B B, D B, G B W, J B, A B, S C, C T C, T A D, G V F, M G, T T H, S D M, J A O, D O, V G S, O S, L S V, M W, B E, L G, J H, P L, E S E, M H, T M J, I G, K Y, J L, M M, K T, M L and K L contributed unpublished data and site descriptions used in data analysis. All authors contributed to data interpretation and preparation of manuscript text.