


Abstract
After completing the main construction phase of Wendelstein 7-X (W7-X) and successfully commissioning the device, first plasma operation started at the end of 2015. Integral commissioning of plasma start-up and operation using electron cyclotron resonance heating (ECRH) and an extensive set of plasma diagnostics have been completed, allowing initial physics studies during the first operational campaign. Both in helium and hydrogen, plasma breakdown was easily achieved. Gaining experience with plasma vessel conditioning, discharge lengths could be extended gradually. Eventually, discharges lasted up to 6 s, reaching an injected energy of 4 MJ, which is twice the limit originally agreed for the limiter configuration employed during the first operational campaign. At power levels of 4 MW central electron densities reached 3 × 10¹⁹ m−3, central electron temperatures reached values of 7 keV and ion temperatures reached just above 2 keV. Important physics studies during this first operational phase include a first assessment of power balance and energy confinement, ECRH power deposition experiments, 2nd harmonic O-mode ECRH using multi-pass absorption, and current drive experiments using electron cyclotron current drive. As in many plasma discharges the electron temperature exceeds the ion temperature significantly, these plasmas are governed by core electron root confinement showing a strong positive electric field in the plasma centre.

Original content from this work may be used under the terms of the Creative Commons Attribution 3.0 licence. Any further distribution of this work must maintain attribution to the author(s) and the title of the work, journal citation and DOI.
This article was updated on 26 August 2021 to correct the copyright line.
1. Introduction
The main objective of the optimized stellarator Wendelstein 7-X (W7-X) is the demonstration of steady-state plasma operation at fusion-relevant plasma parameters, thereby verifying that the stellarator is a viable fusion power plant concept. The design of W7-X is based on an elaborate optimization procedure to avoid excessive neoclassical transport losses at high plasma temperature, to provide satisfactory fast ion confinement in the centre of the plasma with a drift-optimized configuration [1], and to simultaneously achieve satisfactory equilibrium and stability properties at high β as well as reliable divertor operation [2].
The main construction phase of W7-X was completed in 2014. It was followed by the commissioning of the superconducting device [3], which was successfully concluded by assessment of a series of careful measurements of the magnetic field, confirming not only the basic magnetic field topology but also demonstrating that potential error fields are within the correction capabilities of the W7-X trim coils [4–6]. After the operating permit was granted, first plasma operation started in December 2015 and continued until March 2016, with a total of 10 weeks of plasma operation. During each of these weeks, 3 days were dedicated to plasma operation. While the magnetic field coils and their support structure inside the cryostat were kept at cryogenic temperatures for the whole campaign (⩽100 K, while with the magnetic field the operational temperature of the W7-X coils is ~4 K), the magnetic field was ramped up and down on every day of plasma operation.
Plasma operation of W7-X follows a staged approach in accordance with the successive completion of the in-vessel components [7]. During the first operational phase (OP 1.1) the plasma was limited to an effective minor radius of a = 0.49 m by five inboard limiters. To avoid plasma contact with the metallic walls, a magnetic field configuration was developed which had a rotational transform (at the plasma edge) above 5/6, with a 5/6 island chain lying just inside the plasma volume [8]. Assuming that the entire heating power has to be dissipated by the limiters, the heat load handling capability of the inertially cooled limiters restricted the total energy injected into the plasma to initially ∫P dt = 2 MJ. This was doubled to 4 MJ when it became clear that the limiter temperatures achieved at 2 MJ did not reach the predefined technical limits. After the installation of a test divertor unit, first experience with the magnetic island divertor will be gained in the subsequent operational phase, OP 1.2. During this phase the uncooled divertor targets will limit the injected energy to 80 MJ, allowing plasma pulses of 10 s duration at 8 MW of heating power. OP 1.2 will be followed by the installation of a steady-state capable high-heat flux divertor and the completion of active water cooling of all in-vessel components, in preparation for high power (10 MW) steady-state plasma operation at pulse lengths of up to 30 min (operational phase OP 2).
The main objective of OP 1.1 was the integral commissioning of plasma start-up and operation, using an electron cyclotron resonance heating (ECRH) system and an extensive set of plasma diagnostics [8]. These included measurements of electron temperature and density profiles (ECE and Thomson scattering [9]), line-integrated electron density (dispersion interferometry [10]), line-integrated measurements of ion and electron temperatures (imaging x-ray spectroscopy [11]), reflectometers [12], a diamagnetic loop [13], visible, near-infrared and infrared cameras for plasma and limiter observation [14], impurity spectroscopy (in the visible, VUV and x-ray wavelength ranges [15]), bolometer for measuring the plasma radiation [16], and neutral pressure gauges, Langmuir probes, and electron cyclotron absorption (ECA) and microwave stray radiation detectors [17] (a summary of all these diagnostic developments has been published in [18]). By the end of the first operational phase more than 30 diagnostic systems had been commissioned and had provided data [19], some of them already using Bayesian data analysis [20].
For OP 1.1 the ECRH system provided six gyrotrons with a total power of up to 5 MW for second harmonic heating at 140 GHz, corresponding to a central deposition at 2.5 T. Six independent launch positions at the low field side, using front steering launchers with movable mirrors, allowed the deposition profile to be moved vertically for off-axis heating and toroidally for current drive [21].
This paper gives an introduction to the experience with the first plasma operation on Wendelstein 7-X. It also reports on the first major results, focusing on the power balance, the characterization of the global confinement, and heating and current drive scenarios. Papers with a different focus on OP 1.1 results have been published [22, 23].
2. Establishing first plasmas: plasma breakdown, wall conditioning and achieved plasma parameters
Plasma breakdown was easily achieved in the first plasmas in helium. Plasma densities of about 2 × 10¹⁹ m−3 and central electron temperatures in the range of several keV were obtained after a few days of plasma operation. Since ions were heated only by collisional heat transfer from the electrons and the initial discharge durations were below 100 ms, ion temperatures stayed below 1 keV. An example of a helium discharge at the beginning of the campaign is shown in figure 1. A prefill of helium gas is followed by the application of ECRH power. Plasma breakdown was typically achieved after 10 ms. The reduction of both the shine-through power, measured by the ECA diagnostic, and the stray radiation level (details of the protection diagnostics are described in [17]) provides evidence for the increasing absorption of the ECR waves. An increase of the neutral gas pressure precedes a radiation collapse, as evidenced by a sudden loss of wave coupling finally leading to the termination of the discharge after about 50 ms. The combination of stray radiation and ECA measurements allowed us to distinguish between the loss of absorption (both signals increase) and reaching the cut-off, in which case the ECA signal would have remained low while the stray radiation level would have increased.

Figure 1. The temporal evolution of gas flow, ECRH power, neutral gas pressure, electron cyclotron absorption (ECA) signal measuring the shine-through power which is not absorbed by the plasma, and the sniffer probe signal which is an indicator of the microwave stray radiation level in the plasma vessel. Plasma breakdown was achieved typically after 10 ms of applying the ECRH power (indicated by green dashed lines). In this example, four gyrotrons with a total power of up to 3 MW were used. To prevent damage by high levels of non-absorbed power, sniffer probes were used as interlock signals. The discharge is terminated by a radiation collapse (vertical red line).
Download figure:
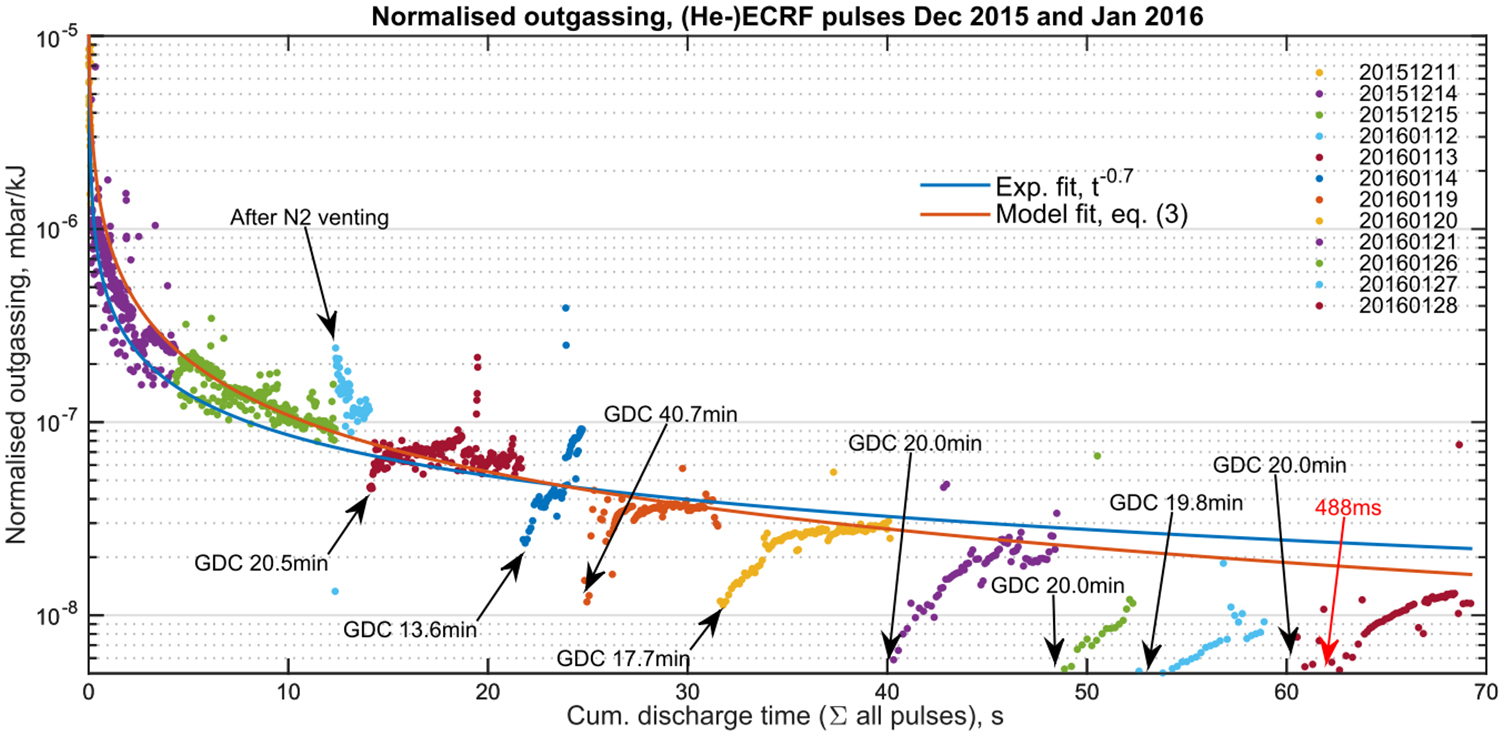
Standard image High-resolution imageAt the beginning, short ECRH produced plasmas were used to condition the plasma vessel walls. The sophisticated plasma control, designed for steady-state operation [24], made it possible to apply many consecutive pre-programmed ECRH pulses, realizing a plasma pulse about every 30 s. The ECRH cleaning and, once fully functional, the glow discharge cleaning (GDC), together made the out-gassing of the plasma vessel wall decrease by more than one order of magnitude, resulting in discharge durations of ~500 ms. Figure 2 shows the improvement of the wall conditioning with the accumulated discharge time, and also the effect of GDC. A detailed description of the measurements and their interpretation can be found in [25]. Although these measures led to acceptable discharge lengths and core plasma temperatures up to 10 keV for the electrons and up to 2 keV for the ions, out-gassing events remained an issue throughout the first plasma campaign of W7-X. Regularly, in one of the five torus modules of W7-X (module 4), an increase of the neutral gas pressure (measured with a midplane gas manometer) was observed, associated with an increase of the plasma edge emission (measured with the visible-light cameras). This was followed by a reduction of the electron temperature at constant heating power which preceded the radiation collapse. Searching the plasma vessel after the campaign revealed a number of plastic parts which had unintentionally been left in the plasma vessel after completion of assembly. Although some of the plastic parts were partially molten, they were in remote places which had no direct plasma contact. In addition, no clear correlation could be established between the location of the parts and the radiation observed by visible-light cameras and the pressure increases measured in the different modules.

Figure 2. The normalized out-gassing, defined as the ratio of the measured peak pressure divided by the energy absorbed during the respective plasma pulse, is plotted against the accumulated discharge time. Obviously, the out-gassing decreases with discharge time. Each glow discharge cleaning (GDC) leads to a further drop. However, after each GDC period the out-gassing tends to return to the envelope curve [25]. Reproduced with permission from [25].
Download figure:
Standard image High-resolution imageHydrogen plasmas were successfully established without any issues. Generally, the discharges were characterized by high electron temperatures at the beginning of the ECRH pulse (~10 keV at ~1019 m−3 and a few MWs of ECRH), quickly becoming stationary. The plasma density was controlled to become stationary within seconds. Ion temperatures increased up to 2 keV, but over a longer time due to the slow collisional heat transfer from the ECR-heated electrons. Limiter temperatures eventually reached values of several hundreds of °C, corresponding to peak heat fluxes of 2–3 MW m−2. The longest plasma discharges achieved at moderate heating powers, starting at 1 MW and dropping to 600 kW, lasted up to 6 s, reaching an injected energy of 4 MJ with stationary central temperatures of Te = 5 keV and Ti = 1.5 keV at central densities of several times 1019 m−3. These discharges could be sustained for more than 50 energy confinement times.
An example of temperature profiles and the density evolution of hydrogen plasma of 1.3 s duration is shown in figure 3. Applying independent calibration methods (e.g. Raman scattering for the Thomson scattering diagnostic), temperature and density measurements of the different diagnostics agree in many cases within about 10%. In the case of ECE, the relativistically downshifted emission at low frequencies from hot core electrons is not reabsorbed in the plasma, as at these frequencies the plasma is optically grey. This feature is not shown in figure 3. This interpretation is confirmed by microwave propagation calculations, using the TRAVIS code, and the temporal behaviour of this feature after the ECRH has been turned off. The relativistic feature decays on a much faster timescale of 5–10 ms, while the timescale of the channels corresponding to the blackbody emission exceeds 100 ms, being more in line with the energy confinement time expected for thermal electrons. With increasing temperature, the discrepancy between the different temperature measurements tends to increase [26]. Possible reasons for this discrepancy are deficiencies of the calibrations at higher temperatures, an inaccurate flux surface mapping which increases with temperatures and pressure, and suprathermal electrons. As for the presence of a significant fraction of suprathermal electrons, no clear indications exist. A more probable candidate is equilibrium effects, which were not considered in the analysis presented. As usual, the validation of this data is being further refined. For instance, the improvement of the calibration of the ECE measurements using a hot-cold-source is continuing. The details of the profile shapes are also still under investigation, which is essential for a refined transport analysis.

Figure 3. The profiles on the left show the electron temperature from ECE (high field side and low field side, both mapped onto the normalized radius, r/rLCFS) and from Thomson scattering for a low power (PECRH = 0.6 MW) plasma lasting 6 s. (The temperature profiles are also shown in [22].) Ion and electron temperature profiles have been inferred from the inverted line integrals measured by x-ray imaging spectroscopy (XICS). On the right, the line integrated density measurement using the dispersion interferometer (blue signal) is overlaid with the line integral calculated from the TS density profile measurement (red dots; the line integral extends over about 1 m). The measurements take nearly the same laser path through the plasma and typically agree within 10%. The example shown here is from a plasma with 4 MW of ECRH power. Reproduced from [22]. © IOP Publishing Ltd. CC BY 3.0.
Download figure:
Standard image High-resolution image3. First attempt at a global power balance
The global power balance provides a test of the consistency between heating power and the different contributions to the power loss from the plasma [26, 27]. For non-stationary conditions the change of the plasma energy also has to be considered:

During OP 1.1 only ECRH was applied for heating the plasma. The power from the gyrotrons, Pheat, has been measured, including the transmission efficiency of the quasi-optical transmission line from the gyrotrons to the plasma vessel, which is about 40 m long and consists of 16 mirrors and two polarizers [21]. By directing the power from a gyrotron on a direct path to a dummy load which incorporates a calorimeter, the gyrotron power can be determined. By using the same setup, but this time directing the gyrotron beam through most of the transmission line and using a retro-reflector back again to the dummy load, the transmission efficiency is given by the ratio of the two power measurements (see figure 4) [28]. The overall efficiency up to the vacuum windows of the ECRH launchers is estimated to be 94%. Vacuum windows and launchers are estimated to cause an additional 2% loss. This estimate is based on transmission measurements of the (diamond) vacuum windows and calculated losses caused by the finite apertures in the launchers, scraping off power in the wings of the Gaussian microwave beams.

Figure 4. The left hand side shows the measurement of the gyrotron power, comparing the power level of the direct way to the load with the level of the indirect way via a retro-reflector. The inferred transmission efficiency is 94%. Repeating the measurements at different power levels results in a linear dependence (right hand side figure) allowing a robust determination of the power loss.
Download figure:
Standard image High-resolution imageThe radiated power, Prad, was measured using two bolometer systems covering the plasma cross-section [16] and assuming toroidal symmetry of the plasma radiation. In addition, it was assumed that all conductive or convective losses from the plasma are picked up by the five inboard limiters. The limiter loads were measured using two infrared camera systems [14], looking at different parts of two limiters in different modules. Inferring the total power to the limiters, Plim, initial observations of an asymmetric heat flux distribution have been taken into account. Indications for toroidal asymmetries have been experimentally observed [29] and thus constitute a systematic error in this analysis [30].
To a large degree, particle and heat fluxes followed predictions from vacuum modelling of magnetic field lines [26, 29, 31]. Qualitatively, the heat flux patterns on the limiters correspond to the magnetic field line connection lengths, whereby longer connections produce higher heat fluxes. Two distinct stripes on each limiter were measured by infrared and visible light cameras. Additionally, some asymmetries amongst the W7-X modules were detected by several diagnostics, e.g. neutral gas manometers working in four out of five modules. It was expected that such asymmetries would arise either from field errors or from deviations from the ideal limiter positions. A small n = 1 field was added during several experiments, utilizing a set of five trim coils [32]. By changing the phase and amplitude of the n = 1 field, it was possible to find a configuration that reduced the asymmetries in the pressure distribution between the modules. Such experiments indicate that the phase of a small n = 1 error field, previously measured by flux surface mapping, agrees with the phase required to minimize the asymmetries [34]. Further increasing the n = 1 field, however, led to even stronger asymmetries in the limiter power loads, thus demonstrating that error field compensation is well within the capabilities of the trim coil system.
The plasma energy and its temporal change are derived from the profiles of ion and electron temperatures and electron density. Apart from possible uncertainties with the calibration of these diagnostics, a systematic error is introduced by the unknown impurity content. A further uncertainty stems from the neglect of charge-exchange losses of the ion energy. Comparing the kinetic energy derived from these profile measurements with the diamagnetic energy, Wkin exceeds Wdia by about 30%, which could be due to impurities in the plasma or the use of the vacuum field for the profile analysis. Since the ion density, ni, is not measured, Wkin can be calculated only approximately. It is clear that the measured electron energy We < Wkin < Wkin(ni = ne), the latter representing the theoretical maximum energy value, neglecting all impurities. Given Zeff values between 1.5 and 5.5, which have been estimated for OP 1.1, and assuming flat Zeff profiles, a range of possible reductions of ni with respect to ne can be estimated. This analysis indicates that up to 20% of the deviation of Wkin from Wdia could be attributed to impurities. Accordingly, Wkin is reduced by this amount in the analysis presented here. The remaining 10% deviation may indicate mapping errors during the integration of the temperature and density profiles or systematic errors of the corresponding measurements. Figure 5 shows the temporal evolution of the different power terms of an example discharge, with fairly good agreement in the power balance. In this example the overall power loss, consisting of limiter load and radiated power, is on average underestimated by approximately 25%. This is a very reasonable result, considering the uncertainties involved and the assumptions made. Altogether, the analysed discharges indicate that the deviation between heating power and loss power increases with increasing heating power, from values of 10% at 1 MW up to 40% at 4 MW.

Figure 5. The temporal evolution of the global power balance of discharge 2016-03-10.034. The total loss power, Ploss = Prad + Plim + dW/dt, agrees fairly well with the heating power, Pheat.
Download figure:
Standard image High-resolution image4. Confinement and plasma transport
From the knowledge of the plasma energy and the heating power coupled to the plasma, the energy confinement time can be readily derived. As described in the previous section the plasma energy can be inferred from the flux change measured by the diamagnetic loop or the kinetic plasma profiles. Although the validation of this data is still ongoing and only a limited dataset exists, a first attempt to compare the measured confinement times with the scaling law is illustrated in figure 6.

Figure 6. The figure shows the dataset which forms the basis of the ISS04 energy confinement time scaling [34] (the coloured points correspond to the different stellarator and heliotron devices). The grey triangles correspond to the L- and H-mode data from tokamaks. Also plotted are the data from the W7-X OP 1.1 campaign (yellow–green), two selected W7-X CERC discharges (dark blue), and three W7-AS CERC plasma (yellow–red).
Download figure:
Standard image High-resolution imageThe evaluated energy confinement times lie in a range of 0.4 to 1.1 times the confinement time given by the ISS04 scaling [34], corresponding to absolute values of τE in a range of about 100 to 150 ms. Looking at the variation of power and density in the OP 1.1 data set, within the error bars the exponent for the density is similar to the value of the scaling (n0.61±0.06 compared to n0.54 as given by the ISS04 scaling), while the power degradation seems to be weaker (P−0.35±0.03 instead of P−0.61 as given by the ISS04 scaling). However, since the variation of the density in particular was limited, these findings are still very preliminary. The dependence of τE/τISS04 on the heating power reveals that for ECRH power levels below 1 MW the confinement time consistently lies below the scaling, while for the higher power levels (up to 4 MW) τE/τISS04 reaches values up to 1. In discharges where the power was stepped down below 1 MW, an increase of the radiation fraction and a shrinkage of the hot and dense plasma core could be observed, accompanied by a reduction of the central temperature and density. On the basis of the available data one can only speculate whether this behaviour is related to some kind of density or impurity limit, possibly involving a violation of the local power balance starting from the plasma edge (e.g. see [35]). However, in some cases an increase in the radiation starting from the plasma center was also observed, so it is difficult to pinpoint one single mechanism.
Although the investigation of stellarator optimization was not foreseen during the first experimental campaign of W7-X, the fact that sufficiently long and stable discharge conditions were achieved of course immediately raised the question about possible first evidence for optimized confinement. To this effect the neoclassical transport coefficients were derived from the measurements of the temperature and density profiles [36, 37]. Enforcing the ambipolarity condition for the electron and ion fluxes, namely Γe(Er) = ∑ZiΓi(Er), a self-consistent radial electric field could be derived. In figure 7 the inferred radial electric field (from the neoclassical transport codes DKES [38] and SFINCS [39]) are presented. The radial electric field profile clearly shows a transition from electron-root confinement [40] in the core region of the plasma (Er > 0) to the ion-root transport regime at larger radii (Er < 0). The core electron-root confinement (CERC) leads to decreased electron heat transport in the centre, at low plasma densities resulting in Te Ti. At higher heating powers the observations are similar, showing an electron-root region which grows with increasing ECRH power.

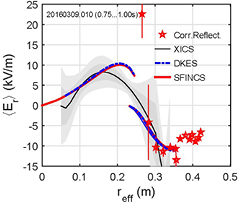
Figure 7. The radial electric field profiles, using the neoclassical transport codes DKES and SFINCS, are calculated from measured density and temperature profiles enforcing the ambipolarity condition. Superimposed to these profiles are local measurements of the radial electric field, inferred from correlation reflectometry [12] and x-ray spectroscopy data (XICS) [11], the latter measuring not only electron and ion temperatures but also the poloidal plasma rotation from which Er is inferred (an earlier analysis is presented in [22]).
Download figure:
Standard image High-resolution imageThe analysis indicates that the electron transport is strongly reduced in the electron-root region [36]. However, the outer region of the plasma, which is in the ion-root regime, covers a much larger fraction of the plasma volume. The temperatures in the outer region are smaller and anomalous transport significantly determines the overall confinement properties. Experimental variations of the effective helical ripple, εeff, between 0.7% and 1.4% (by changing coil current ratios) show a change of the transport which is weaker than in the 1/ν-transport regime (D1/ν ~ ε T7/2/n). In the presence of an electric field, the transport does not depend on εeff (√ν-transport regime: D√ν ~ n1/2 T5/4 E ), which is in line with the observation of electron-root transport in the central regions of the plasma. Hence, the influence of the optimization parameter εeff should be relatively unimportant. In this case the leading mechanism is the formation of a large radial electric field which is determined by the ambipolarity condition. Under electron root conditions, the particle fluxes are governed by the ions. The ion flux is dominated by convective Er-transport and the resulting Er is sufficiently large (the E × B precession gets comparable to collision frequency) to bring also the electrons into the √ν-regime. In addition, the electron fluxes are influenced by T-driven transport (thermo-diffusion).


W7-AS low-density core electron-root plasmas [41] have confinement times of about a factor of two below the ISS04-scaling, while W7-X plasmas with the same feature lie on the scaling. One parameter which could play a role in explaining this difference is the larger than average elongation of W7-X as compared to W7-AS. The elongation is not a parameter of the ISS04-scaling. One should also bear in mind that these first W7-X plasmas were achieved in a device with a large fraction of unprotected metal surfaces and wall conditions which were not optimal for achieving clean plasmas.
Another quantity related to the optimization of W7-X which is under investigation is the bootstrap current. Experiments clearly show a dependence on the toroidal mirror ratio of the magnetic field configuration, as expected theoretically. In the W7-X design the bootstrap and Pfirsch–Schlüter currents were minimized to achieve a resonant magnetic island divertor which as far as possible is not affected by increasing plasma-β. A more detailed analysis which summarizes the first evidence concerning optimization will be published elsewhere [37].
Further transport investigations during OP 1.1 include the comparison of on- and off-axis ECRH. As shown in figure 8, the central peaking of the electron temperature profile disappears completely when the deposition is moved away from the centre to a larger radius. This means that, at least at the low power level applied (0.6 MW of ECRH), the electron temperature profiles inside the off-axis deposition radius do not show profile resilience. Another feature of this experiment is the density peaking which is observed in the off-axis heated discharge and the flat density profile in the presence of a strong temperature gradient in the case of central ECRH. The reason for the observed behaviour of the density profile is still under investigation. In the long mean-free-path regime neoclassical transport theory predicts an outward thermo-diffusion, leading even to hollow density profiles in the presence of strong temperature gradients [42]. In W7-AS an anomalous inward particle pinch was observed (known as thermo-diffusion weakness), which, however, required a temperature gradient [43] and which at least in the off-axis heating case is not present when the density is peaking. Another question is how the electric field of the electron-root regime influences the particle balance. Core fuelling due to strong recycling could also play a role. Using modulated ECRH and the ECE diagnostic, heat wave experiments were also conducted [27, 44]. These included a comparison of on- and off-axis ECRH modulation, showing a distinct difference in the radial amplitude and phase evolution between the two cases.

Figure 8. The plots compare electron temperature and density profiles of discharges with on- (black curves) and off-axis ECRH (red curves). The profiles have been measured by the Thomson scattering diagnostic. The ECRH power was 0.6 MW. The deposition radii are indicated by the vertical arrows.
Download figure:
Standard image High-resolution image5. Heating scenarios and current drive experiments
The W7-X ECRH system is designed for steady-state heating at 140 GHz corresponding to 2nd harmonic gyro-frequency of the electrons at 2.5 T [21]. The standard ECR heating scenario in W7-X at densities below 1.2 × 10²⁰ m−3 is the X2 mode, which was used for most of the plasmas during OP 1.1. Between the X2 cutoff density at 1.2 × 10²⁰ m−3 and the O2 cutoff density at 2.4 × 10²⁰ m−3, O2 heating is required for effective coupling of the ECR waves to the plasma. Since, single-pass absorption for O2 heating is much lower than that for X2 heating, however, O2 ECRH requires a multi-pass absorption scheme using reflecting surfaces inside the plasma vessel. High-density operation above 1.2 × 10²⁰ m−3 will be required to minimize the neoclassical transport losses in the 1/ν-transport regime. Because of D1/ν ~ T7/2/n, high-performance plasmas (maximizing nTτE ) will require high densities at moderately high plasma temperatures.
During OP 1.1 densities above the X2 cutoff were not reached. However, the unexpectedly high electron temperatures, which guarantee strong absorption of the microwaves, allowed first O2 heating experiments to be carried out [45]. At first the single-pass absorption was determined using a low power O2 beam in an otherwise X2-heated plasma. The absorption coefficient was measured comparing the ECA signal with and without plasma. Consistent with ray-tracing calculations, ηsingle-pass ~ 70% was achieved for electron temperatures exceeding 5 keV. In a second step, a purely O2-heated plasma was established. Figure 9 illustrates the multi-pass absorption scheme of W7-X and shows the discharge parameters of a case where the heating was changed from X2 to O2. The plasma was started using two gyrotrons in X2 mode. After reaching central temperatures of 5 keV, ECRH beams from four gyrotrons in O2 mode were added. Finally, the X2 ECRH beams could be turned off and the discharge was sustained purely by O2 heating. The line-averaged density in this experiment did not exceed 3 × 10¹⁹ m−3. With this scheme, overall absorption values of ~95% were achieved, evidenced by a sniffer probe signal which remains low throughout the discharge. The roughness of the reflecting surfaces in the plasma vessel does not play a role, as the roughness of the reflection tile and the steel panels is an order of magnitude smaller than the wavelength. An effect which can reduce the absorption of the ECRH beams is change of polarization by the reflection. After turning off the heating power at the end of the discharges, the electron temperature drops according to the heat transport losses, while the plasma density does not change much provided the temperature is still high enough so that enough neutrals can be ionized, compensating for the particle transport losses.

Figure 9. The plot on the left shows a top view of a toroidal section of W7-X with iso-contours of the magnetic field (coloured lines, units in T) and illustrates the multi-pass absorption scheme using reflecting surfaces in the plasma vessel. The resonances of the ECRH beam (in grey) are indicated by the red areas. On the right hand side, the temporal evolution of a discharge is shown in which the heating was changed from X2 to O2.
Download figure:
Standard image High-resolution imageDepending on the toroidal launch direction with the front-steering mirrors of the ECRH launchers, electron-cyclotron current drive (ECCD) can be achieved in W7-X. ECCD is one of the possible options to control the island divertor configuration in the presence of a finite bootstrap current [46].
First experiments, comparing central co- and counter-ECCD, showed very interesting results. Figure 10 compares two discharges with co- (−10° ECRH launch angle) and counter-current drive (+10° ECRH launch angle). The current evolution, measured by Rogowski coils [13], takes place on the L/R timescale, which is much longer than the discharge duration of 600 ms, and can be explained by the interplay between current drive and shielding currents. Initially, the driven current is perfectly balanced by the shielding current. No net current can be observed. The redistribution of the currents is governed by the resistivity and the decay of the shielding current on the L/R timescale. The net plasma current starts to rise as the shielding current drops in the plasma centre and becomes radially broader. When plasma heating and the current drive are turned off at the same time (as was done in the experiments) and the decay of the shielding current is not complete, the parts of the current density distribution at larger radii and lower temperatures decay faster, resulting in a further rise of the net current, although the plasma has already started to decay. The story is complicated by the presence of a finite bootstrap current, which in the counter-ECCD case almost completely balances the current drive, while in the co-ECCD case it adds to the current drive. This is the reason why the measured current traces in figure 10 are not symmetrical.

Figure 10. Comparison of central co- and counter-current drive discharges. The current drive direction is defined in such a way that co-current drive increases the rotational transform provided by the external coils, while counter-current drive decreases the rotational transform. Shown are the time traces of the heating powers of the individual gyrotrons, the stray radiation level (measuring the non-absorbed power), the central electron temperature (measured by ECE), and the toroidal plasma current. In particular in the co-current case prominent crashes of the central electron temperature can be observed.
Download figure:
Standard image High-resolution imageOne feature that is not yet really understood is the relaxation oscillations of the electron temperature, which are particularly strong in the co-ECCD case. Qualitatively, they look very similar to sawteeth oscillations in tokamaks, showing a temporal evolution with a slow Te rise (lasting up to 200 ms), followed by a sudden crash, and a spatial redistribution with an inversion radius. Considering that the magnetic shear of W7-X is very low, attempts to understand these observations include the appearance of major resonances caused by the modification of the -profile by the current drive and the effect such resonances could have on the stability of the plasma. Figure 11 illustrates the effect of co-current drive and the interplay between the screening current as described in the previous paragraph. Starting from an unperturbed -profile, as given by the vacuum magnetic field configuration, the effect of current drive is calculated assuming only current diffusion. Input parameters are the measured electron temperature and density profiles and the ECCD profile calculated by the ray-tracing code TRAVIS [47]. As a result, runs through major resonances as it increases near the plasma centre. After 80 ms reaches 1 and after 200 ms the current density has developed a strong gradient in the region where = 1. However, at 200 ms the total current is still increasing while the screening current is dropping. The current diffusion calculation shows that the duration of 100–200 ms which it takes to form major resonances approximately agrees with the time period of the observed relaxation oscillation. Also, the collapse zone, as derived from the inversion radius of the Te-crashes (indicated by the green area in figure 11), roughly agrees with the position of the strong current density gradient and the position of the resonance at = 1. Similarly, it is expected that counter-ECCD lowers in the plasma core, possibly reaching = ½. Which type of instability has to be considered to explain the temperature crashes, and how the current drive direction is related to the period of the oscillations, is however not clear at this stage of the analysis.


Figure 11. The left figure shows the temporal evolution of the current density during co-ECCD. The right plot shows the corresponding evolution of the -profile, starting from the profile of the vacuum magnetic field configuration used in the experiment. For comparison a typical tokamak -profile has been superimposed. After 80 ms near the plasma centre reaches 1 and after 200 ms a strong current density gradient develops near this resonance.


Download figure:
Standard image High-resolution image
6. Summary and conclusions
Although the main focus of the first operational campaign of W7-X was on the integral commissioning of the basic device together with first plasma operation, the largely trouble-free operation and the fast completion of a comprehensive diagnostic set made it possible to spend a significant fraction of the campaign on physics studies.
Plasma breakdown was easily achieved with the available ECRH power. Continual plasma vessel conditioning with ECRH and GDC resulted in discharge lengths up to the limit defined by the maximum energy which in the OP 1.1 configuration could be injected during a single discharge (initially 2 MJ, eventually raised to 4 MJ). OP 1.1 discharges were typically characterized by low plasma densities (∫n dl significantly below 1020 m−3), electron temperatures in the core region up to 10 keV exceeding the ion temperature by a factor of ~5, and the tendency for plasma termination by an uncontrolled increase of plasma radiation. A conclusive disentanglement of impurity sources and impurity transport will probably not be possible for OP 1.1. Even the inspection of the plasma vessel after the end of OP 1.1 did not reveal the sources of radiation or the reason for the pressure events, predominantly observed in one module.
Despite such problems, a wealth of physics results could be established thanks to a reliable and powerful control system, an ECR heating system with six gyrotrons and a total heating power of 4.3 MW working without major issues during the campaign, and many diagnostics which were available from day one or became operational during the campaign. A central question which immediately emerged is whether a first validation of the stellarator optimization underlying the design of W7-X is possible. With respect to the energy confinement time the established CERC regime does not allow one to demonstrate the improvement of the effective helical ripple.
Other important results are a first successful power balance, including the measurement of the limiter heat fluxes, the comparison of on- and off-axis heating, indicating that at low power the central Te-profiles do not show profile resilience, the accomplishment of completely O2-ECR heated plasmas, and current drive experiments exhibiting interesting stability effects.
At present, W7-X is undergoing the preparation of the next stage of operation, including a test divertor unit, an upgrade of existing diagnostics and the installation of new diagnostics. The ECRH system will be complemented by another 4 gyrotrons, increasing the heating power from 5 to 9 MW. In addition, 7 MW of hydrogen neutral beam injection and a 1.6 MW ion cyclotron-heating system, both capable of about 10 s plasma heating, are being prepared for the next operation campaign.
Acknowledgments
This work has been carried out within the framework of the EUROfusion Consortium and has received funding from the EURATOM research and training programme 2014–2018 under grant agreement No 633053. The views and opinions expressed herein do not necessarily reflect those of the European Commission.