

Abstract
Quantifying how climate change may impact precipitation extremes is a priority for informing adaptation and policy planning. In this study, Coupled Model Intercomparison Project phase 6 global climate models are analyzed to identify robust signals of projected changes in summer and winter precipitation extremes over the United States (US). Under a projected fossil-fuel based economic (i.e. high greenhouse gas emissions) scenario, our results show consistent changes in the seasonal patterns for many precipitation extremes by the end of the 21st century. We find a robust projected increase in the intensity of winter precipitation across models, with less agreement during the summer. Similarly, a robust projected amplification of heavy precipitation over the northern US is evident in winter, while intermodel spread is prevalent in summer projections. Specifically, the heavy and very heavy winter precipitation days (R10mm and R20mm) exhibit larger increases compared to other aspects of precipitation. Additionally, changes in dry extremes (e.g. consecutive dry days) are found to differ significantly across various subregions and seasons. Overall, our results suggest that the US may suffer more natural disasters such as floods and droughts in the future.
Export citation and abstract BibTeX RIS

Original content from this work may be used under the terms of the Creative Commons Attribution 4.0 license. Any further distribution of this work must maintain attribution to the author(s) and the title of the work, journal citation and DOI.
1. Introduction
The Intergovernmental Panel on Climate Change Fifth Assessment Report (IPCC 2013) documents a 0.85 [0.65 to 1.06] °C increase in global mean temperature between 1880 and 2012, which is likely to increase by more than 2 °C further by the end of the 21st century under the two highest emissions scenarios (i.e. Representative Concentration Pathways 6 and 8.5). This global mean temperature change is associated with an overall increase in atmospheric water vapor content by approximately 6–7%/°C (Pall et al 2007, O'Gorman and Muller 2010), making more low-level moisture available during convective storm events. In particular, tropical and mid-latitude land areas, including North America, have and are likely to continue to experience a higher intensity and frequency of heavy rainfall events (Dulière et al 2013, IPCC 2013, Thibeault and Seth 2014). Further intensification of these extreme precipitation events may exacerbate the impacts of flooding, putting more people at risk for economic loss and mortality. For effective adaptation to regional climate changes, the demand for consistent and robust projections of changes in climate extremes has rapidly increased among policymakers and the public.
Global Climate Models (GCMs), despite limitations in their representations of some physical processes (even in the latest generation of models; Knutti et al 2008, Stouffer et al 2017), are a critical tool for projecting changes in mean climate and extreme events. However, it is important to view these projections in light of their uncertainties and assess the robustness of the climate change signal across models. Uncertainties in future projections are in part due to model resolution and physics, such as an inability to explicitly resolve subgrid convective processes (Foley 2010) or gravity-wave drag and its interaction with large-scale dynamics (Shepherd 2014), which are instead represented by idealized parameterizations. Uncertainties also result from unknown future changes in the influence of humans on climate (e.g. land cover/land use evolution, economic and technology development, and socioeconomic changes such as population growth; Nakicenovic et al 2000) and an incomplete theoretical understanding of the climate system's response on long timescales (e.g. climate feedbacks) (Knutti et al 2008, Knutti and Sedláček 2013). In addition, the signal from natural variability can often be as large as anthropogenic changes on region scales, which has a significant contribution to uncertainty for near term climate change (Hawkins and Sutton 2011, Deser et al 2016). Nevertheless, the efforts of the Coupled Model Inter-comparison Project Phase 3 (CMIP3; Meehl et al 2007) and Phase 5 (CMIP5; Taylor et al 2012), which provide large-scale coordinated simulations from state-of-the-art GCMs, have been an important contribution toward understanding projected changes in extreme events and their underlying controlling mechanisms. In this study we build on this effort by assessing the new generation CMIP6 models (Eyring et al 2016), focusing specifically on seasonal extreme precipitation changes over the United States (US).
Previous results from CMIP5 GCMs project an increase in global-scale extreme precipitation events (Seneviratne et al 2012, Sillmann et al 2013b, Wuebbles et al 2014). But, how extreme precipitation will change over the US is still fraught with uncertainties, partly because the previous GCMs fail to accurately simulate the frequency and intensity of regional precipitation events in the present climate (Meehl et al 2005, Dai 2006, Allan and Soden 2008, Harding et al 2013). For example, there is a documented inability to capture the drivers of summertime convective precipitation (Harding et al 2013) resulting from coarse spatial resolution and convective parameterization (Duffy et al 2003, Moncrieff and Liu 2006). Nevertheless, there have been important incremental improvements in the ability of climate models to represent the fundamental features of the historical climate, evident in the CMIP3 to CMIP5 transition (Sun et al 2015, Koutroulis et al 2016). Recently, the transition to CMIP6 (Erying et al 2016) has also included some updates, including increased representations of physical processes, some increases in horizontal and vertical resolution, and new emission scenarios for future projections (i.e. shared socioeconomic pathways; SSP). These CMIP6 experiments are now becoming available for scientific use, and a recent assessment (Akinsanola et al 2020b) has shown that the multimodel ensemble mean captures present-day daily precipitation distributions and the spatial characteristics of many extreme indices over the US reasonably well compared to gauge-based observations, performing better than most individual models. Furthermore, they reported that many extreme precipitation indices are better represented for the Western (Central-Eastern) US in the summer (winter) than winter (summer), and that higher horizontal-resolution does not necessarily correlate with improved model performance. Though many biases persist, a detailed assessment of the projected changes in precipitation extremes over the US based on the newly developed CMIP6 models is lacking. This study aims to address this gap by assessing the temporal and spatial changes in precipitation extremes over the US and its subregions. We evaluate these changes by examining derived precipitation extreme indices described by the Expert Team on Climate Change Detection Indices (ETCCDI; Klein Tank et al 2009, Zhang et al 2011), which is consistent with and presented in the context of recent present-day evaluations (e.g. Srivastava et al 2020, Akinsanola et al 2020b).
2. Data and methodology
In this study, simulated changes in the characteristics of daily precipitation, including intensity distributions and extreme indices, are analyzed from 12 CMIP6 climate models. Brief overviews of the CMIP6 simulations and analysis techniques are provided below.
2.1. CMIP6 simulations
Output from 12 CMIP6 climate model simulations (Eyring et al 2016; details in table 1) was available at the time of this analysis and used in this study. For each model, we used daily precipitation and monthly temperature from the first realization ('r1i1p1f1') for both the historical and the projected fossil-fuel based economic (i.e. high greenhouse gas emissions) scenario (Shared Socioeconomic Pathways; SSP5-8.5; O'Neill et al 2016) experiments. Both experiments included fully coupled simulations with interactive atmosphere, land, ocean, and sea-ice components. The SSP5-85 scenario is closely related to the CMIP5 RCP8.5 scenario, which produces a radiative forcing of about 8.5 Wm−2 by the end of the 21st century. The historical and projected future simulations cover the periods of 1950–2014 and 2015–2100, respectively. The capability of these 12 models to realistically reproduce the present-day seasonal precipitation extreme characteristics over the continental US has been evaluated in detail and documented in Akinsanola et al (2020b). All the datasets were regridded to a common grid of 2.81 × 2.81 (latitude × longitude) using an area-conserving remapping procedure, which is implemented in the Climate Data Operators (https://code.zmaw.de/projects/cdo) to produce multi-model summary statistics based on the lowest model resolution. The multi-model ensemble mean of all the CMIP6 simulations used in this study, referred to herein as 'EnsMean', is applied in this study to reduce uncertainty. The indices (described below) were first calculated for the individual models before averaging for the EnsMean; we use a simple multi-model mean and model weighting is not considered at this time. All the analyses and calculations presented herein are for two seasons: summer (June-July-August, JJA) and winter (December-January-February, DJF), and were integrated over the US domain and further assessed over the seven subregions defined in the National Climate Assessment Report (https://nca2018.globalchange.gov/; see figure S1 (available online at stacks.iop.org/ERL/15/104078/mmedia) in the supplementary information). For the analyses of spatial change in the indices, forty-year time slices were used for the projections of 2061–2100 and the historical period of 1975–2014, and the statistical significance was evaluated using a t-test. Additionally, we assessed grid points where at least 70% of the ensemble members agree on the sign of change in the ensemble mean, which provides further insight into the inter-model agreement.
Table 1. Information for the 16 CMIP6 climate models used in this study.
| S/N | Model | Institute | Resolution (olon × olat) | References |
|---|---|---|---|---|
| 1 | BCC-CSM2-MR | Beijing Climate Center (BCC) and China Meteorological Administration (CMA) | 1.13 × 1.13 | Wu et al (2018) |
| 2 | CanESM5 | Canadan Earth System Model | 2.81 × 2.81 | Swart et al (2019) |
| 3 | CESM2 | National Center for Atmospheric Research | 1.25 × 0.94 | Danabasoglu et al (2019b) |
| 4 | CESM2-WACCM | National Center for Atmospheric Research | 1.25 × 0.94 | Danabasoglu et al (2019a) |
| 5 | CNRM-CM6-1 | Centre National de Recherches Météorologiques (CNRM); Centre Européen de Recherches et de Formation Avancéeen Calcul Scientifique | 1.41 × 1.41 | Voldoire et al (2019) |
| 6 | EC-EARTH3 | EC-EARTH consortium | 0.70 × 0.70 | EC-Earth (2019a) |
| 7 | EC-EARTH3-Veg | EC-EARTH consortium | 0.70 × 0.70 | EC-Earth (2019b) |
| 8 | GFDL-CM4 | Geophysical Fluid Dynamics Laboratory (GFDL) | 2.50 × 2.00 | Guo et al (2018) |
| 9 | GFDL-ESM4 | Geophysical Fluid Dynamics Laboratory (GFDL) | 1.25 × 1.00 | Krasting et al (2018) |
| 10 | IPSL-CM6A-LR | Institute Pierre-Simon Laplace (IPSL) | 2.50 × 1.26 | Boucher et al (2018) |
| 11 | MRI-ESM2-0 | Meteorological Research Institute (MRI) | 1.13 × 1.13 | Yukimoto et al (2019) |
| 12 | UKESM1-0-LL | Met Office Hadley Centre | 1.88 × 1.25 | Tang et al (2019) |
2.2. Rainfall distribution
The changes in simulated precipitation characteristics are assessed using several statistics of the daily precipitation frequency and amount distributions. Together, these distributions reveal the precipitation rates that occur most frequently and those that contribute the most to total accumulated precipitation. The distributions were created using histograms with discrete logarithmically spaced precipitation rate bins as described by Pendergrass and Hartmann (2014). The logarithmic approach is efficient for assessing precipitation rates from drizzle to extremes since the bin structure covers four orders of magnitude (i.e. approximately one-hundred bins spanning 0.1 to 1000 mm day−1). In this study, bin widths and central values increase with higher precipitation rates by a fixed percentage of 10%, starting from a dry threshold of 0.1 mm day−1. The distributions are constructed from accumulated daily rainfall independently at each grid point before computing an area-weighted average over the US. This method is consistent with our present-day evaluation in Akinsanola et al (2020b) and previous global-scale studies (Kooperman et al 2016a, 2016b); the mathematical formulation is provided in the supporting Information.
2.3. Extreme precipitation indices
Previous studies have investigated climate extremes using either parametric extreme value theory to assess rare events (Kharin et al 2007, 2013) or using non-parametric indices of climate extremes based explicitly on empirical data (Zhang et al 2011, Sillmann et al 2013b, Odoulami and Akinsanola 2018, Akinsanola and Zhou 2019). In this study, we applied the non-parametric approach to the simulated precipitation using nine set of extreme precipitation indices (for descriptions see table S1) defined by the ETCCDI (http://etccdi.pacificclimate.org/indices_def.shtml). These indices include: simple daily intensity (SDII), maximum consecutive dry days (CDD), maximum consecutive wet days (CWD), total wet day precipitation (PRCPTOT), heavy precipitation days (R10mm), very heavy precipitation days (R20mm), maximum 5-day precipitation (RX5day), very wet days (R95pTOT), and extreme wet days (R99pTOT). These indices have been widely used to investigate changes in extreme observations (Donat et al 2013, Almazroui et al 2014, Sun et al 2016) and future projections (Kharin et al 2013, Sillman et al 2013b, Zhou et al 2014, Wu et al 2016, Akinsanola and Zhou 2019, Akinsanola et al 2020a). The indices used herein are related to precipitation occurrence and intensity, and are thus useful to characterize droughts and flooding indirectly, which is beneficial to a wide range of sectors.
3. Results
3.1. Changes in seasonal surface temperature
First, we document the changes in seasonal surface temperature over the entire US and its subregions from the last 40 years in the 21st century projections compared to 40 years of the historical simulations (table 2). We found a statistically significant increase in surface temperature across the entire US in both seasons. The changes by the EnsMean over the US is 6.07 K for summer and 5.21 K for winter. The overall changes by the ensemble members across all the subregions are larger in summer than winter, and we note that UKESM1-0-LL, CanESM5, and IPSL-CM6A-LR (UKESM1-0-LL and CanESM5) models exhibit the largest change among the ensemble members in summer (winter) season. The projected changes in precipitation extremes under a changing climate are discussed in the next sections.
Table 2. Area-weighted average projected (2061–2100) minus historical (1975–2014) differences in Summer (JJA) and Winter (DJF) surface temperature (K) over the subregions and all of United States.
| JJA | DJF | ||||||||||||||||
|---|---|---|---|---|---|---|---|---|---|---|---|---|---|---|---|---|---|
| S/N | Model | NW | SW | NGP | SGP | MW | SE | NE | US | NW | SW | NGP | SGP | MW | NE | SE | US |
| 1 | BCC-CSM2-MR | 5.85 | 5.04 | 6.66 | 5.69 | 6.34 | 5.15 | 5.52 | 5.58 | 4.87 | 4.13 | 5.68 | 3.13 | 6.05 | 6.08 | 3.16 | 4.80 |
| 2 | CanESM5 | 8.04 | 6.92 | 8.46 | 6.45 | 7.74 | 5.29 | 6.99 | 7.25 | 7.01 | 7.63 | 8.88 | 5.68 | 8.35 | 8.35 | 4.67 | 7.60 |
| 3 | CESM2 | 6.19 | 4.77 | 7.37 | 4.20 | 7.02 | 4.18 | 6.00 | 5.75 | 5.24 | 4.97 | 5.84 | 4.30 | 6.44 | 5.92 | 3.69 | 5.42 |
| 4 | CESM2-WACCM | 6.86 | 5.11 | 7.46 | 4.00 | 6.68 | 4.05 | 5.82 | 5.97 | 6.26 | 5.36 | 7.20 | 4.54 | 7.13 | 6.15 | 3.70 | 6.09 |
| 5 | CNRM-CM6-1 | 6.15 | 6.69 | 6.98 | 5.88 | 6.31 | 4.68 | 5.85 | 6.33 | 4.50 | 5.61 | 6.39 | 5.17 | 6.66 | 5.60 | 4.14 | 5.65 |
| 6 | EC-EARTH3 | 6.98 | 6.69 | 7.24 | 6.89 | 7.04 | 5.34 | 5.92 | 6.76 | 2.71 | 4.34 | 4.56 | 5.81 | 5.36 | 4.28 | 4.24 | 4.35 |
| 7 | EC-EARTH3-Veg | 5.96 | 5.88 | 6.46 | 5.92 | 6.35 | 4.93 | 5.34 | 5.96 | 2.46 | 4.01 | 3.87 | 5.10 | 4.67 | 3.88 | 3.86 | 3.90 |
| 8 | GFDL-CM4 | 5.52 | 5.31 | 6.57 | 6.04 | 6.10 | 5.04 | 5.94 | 5.65 | 4.47 | 4.07 | 5.07 | 4.36 | 5.99 | 6.92 | 4.54 | 4.72 |
| 9 | GFDL-ESM4 | 3.61 | 3.39 | 4.61 | 4.39 | 4.22 | 3.66 | 4.13 | 3.77 | 3.93 | 3.10 | 4.54 | 2.96 | 4.75 | 4.66 | 2.81 | 3.77 |
| 10 | IPSL-CM6A-LR | 7.94 | 6.42 | 9.18 | 5.29 | 7.71 | 5.11 | 6.97 | 7.09 | 4.06 | 3.91 | 5.68 | 4.23 | 6.36 | 5.83 | 4.51 | 4.75 |
| 11 | MRI-ESM2-0 | 4.89 | 4.84 | 5.29 | 4.71 | 4.71 | 3.74 | 4.61 | 4.80 | 3.26 | 3.91 | 3.74 | 3.89 | 4.65 | 5.40 | 3.62 | 3.98 |
| 12 | UKESM1-0-LL | 9.72 | 6.29 | 10.05 | 6.06 | 9.33 | 6.81 | 9.35 | 7.91 | 7.08 | 7.49 | 7.81 | 5.92 | 8.85 | 8.50 | 5.18 | 7.52 |
| 13 | EnsMean | 6.48 | 5.61 | 7.19 | 5.46 | 6.63 | 4.83 | 6.04 | 6.07 | 4.65 | 4.88 | 5.77 | 4.59 | 6.27 | 5.96 | 4.01 | 5.21 |
3.2. Changes in seasonal precipitation distributions
The distributions of precipitation frequency and amount, averaged over the US, are presented in figure 1 for present-day (1975–2014, blue) and projected (2061–2100, red) conditions in both summer and winter seasons. The present-day EnsMean distributions have been evaluated in a previous study and compare reasonably well to observations, but with some persistent biases, including lower overall intensity and higher light rain frequency (see Akinsanola et al 2020b for a full evaluation against several satellite and gauge-based precipitation products). The differences between present-day and future distributions are also presented in figure 2 to further clarify the rain rates with projected increases and decreases.
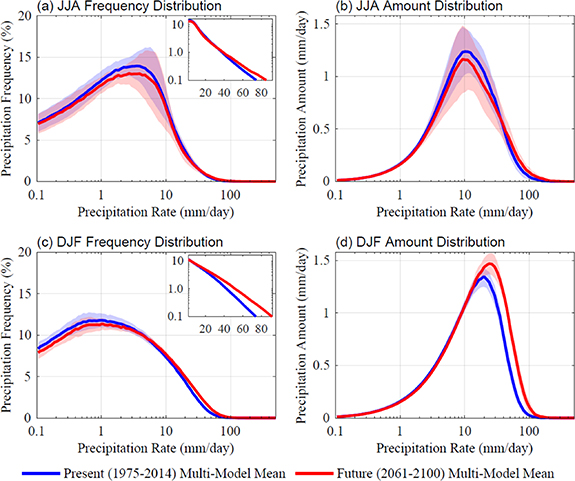
Figure 1. Summer (JJA) and winter (DJF) daily precipitation over the United States for (a), (c) precipitation frequency (%) and (b), (d) precipitation amount (mm day−1) distributions in CMIP6 models. Small plots in figures 1(a), 1(c) are frequency distributions shown on a linear axis. Shading is 95% confidence in the CMIP6 models.
Download figure:
Standard image High-resolution image
Figure 2. Projected (2061–2100) minus historical (1975–2014) differences in summer (JJA) and winter (DJF) daily precipitation over the United States for (a), (c) precipitation frequency (%) and (b), (d) precipitation amount (mm day−1) distributions in CMIP6 model simulations forced by the SSP5-8.5 scenario. Shading is 95% confidence across the CMIP6 models.
Download figure:
Standard image High-resolution imageUnder global warming, the EnsMean summer frequency distribution (figures 1(a) and 2(a)) exhibits a large decrease in light to moderate rain rates and a slight increase in heavy rates. The largest decrease occurs between 1 and 10 mm day−1 and the small increase is centered around 45 to 55 mm day−1 (figure 2(a)). Although there is considerable spread across models for the quantitative change, there is fairly strong qualitative agreement that light rates decrease (i.e. the 95% confidence interval is largely below zero for rates between 0.1 and 20 mm day−1 in figure 2(a)). On the other hand, the change in amount distribution exhibits a clearer signal. There is a reduction (intensification) in the amount of accumulated precipitation from light-medium (heavy) rates, with the change in sign of the response occurring between 30 and 40 mm day−1 (figure 2(b)). Despite the decrease in light rates and increase in heavy rates, the rate at which the peak in the summer amount distribution occurs does not change; both the present-day and projected EnsMean amount distributions peak at about 10 mm day−1 (figure 1(b)). One reason for this might be limitations in convective parameterizations (Moncrieff and Liu 2006, Moncrieff 2019), which often do not exhibit realistic variability in convective intensity. The overall change in the distribution results instead from a decrease in the amount of rain from the parameterized-convective component and increase in the heavier resolved large-scale component (Kooperman et al 2018).
There is also a projected decrease (increase) in the frequency of light (medium-heavy) precipitation rates over the US for the EnsMean during winter (figures 1(c) and 2(c)). However, the change in sign occurs at lighter rates than in summer (about 5 mm day−1 vs. 35 mm day−1), such that the reduction in light rate frequency contributes little to the change in the amount of accumulated precipitation. Rather, the projected amount distribution exhibits a higher precipitation amount for all rates above approximately 10 mm day−1 (figure 1(d)). Furthermore, these changes are associated with an increase in precipitation at rates between 10 and 100 mm day−1, shifting the amount distribution to the right in the future (figure 2(d)). Unlike summer, this shift includes an intensification of the 'amount mode' (i.e. the precipitation rate at the peak of the amount distribution), which could occur because winter in the mid-latitudes has a greater contribution from large-scale resolved precipitation in conventional GCMs or because of the thermodynamic changes which project onto extratropical cyclones (Yettella and Kay 2017). Compared to the summer distributions, there is higher agreement among models in the projected changes in winter precipitation over the US.
3.3. Temporal evolution of extreme indices for precipitation
The JJA area-weighted temporal evolution of the projected changes in precipitation indices is presented in figures 3(a)–(d) and S2–S10 in the supplementary information. Relative to the reference period 1975–2014, the EnsMean projects a slight increase (decrease) in CDD (CWD) in summer on average over the US (figures 3(a) and (b). The projected changes in both indices are evident towards the end of the 21st century, though there are some models that do not follow the EnsMean trend (i.e. zero falls within the 95% confidence interval). However, more consistent and significant trends are evident for some individual subregions, for example CDD in the Northern Great Plains (NGP) and Midwest (MW) (figures S2(b) and (c)). Projected increases between about 2 and 40% are found for CDD in all the subregions except the Southwest (SW) where a small decrease occurs after 2060 (figure S2(e)). The projected decrease in CWD over the entire US is largely contributed by the decrease over NGP, Northwest (NW), and Southern Great Plains (SGP) subregions while MW and SW exhibit very little change or small increases (figure S3). For all subregions, the CWD change varies significantly across models and the EnsMean change is not distinguishable from zero.
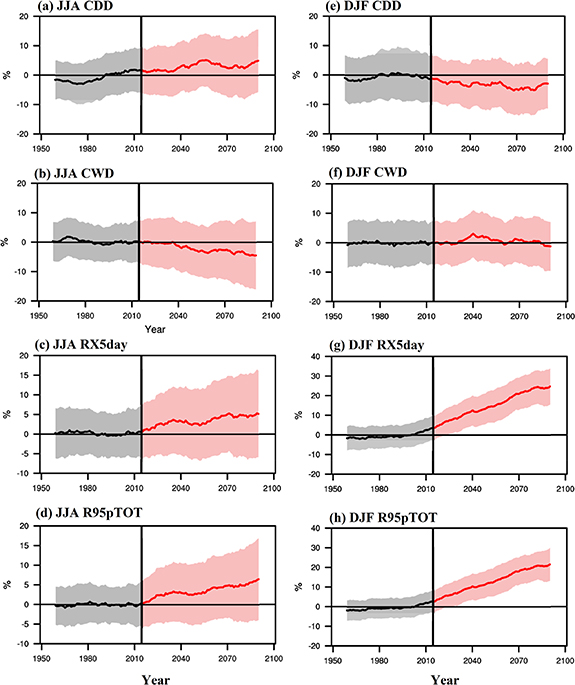
Figure 3. Precipitation extreme indices changes (%) relative to the reference period (1975–2014) mean for the 21st century under the SSP5-8.5 scenario averaged over the US. Solid lines indicate the EnsMean and the shadings show 95% confidence in the CMIP6 ensemble members. Time series are smoothed with a 20-yr running mean filter. The figures are computed as % change in regional weighted-average.
Download figure:
Standard image High-resolution imageA projected intensification of about 7% is evident in both RX5day and R95pTOT in summer over the entire US (figures 3(c) and (d)), with a general EnsMean increase in all the subregions (figures S4 and S5). At the subregion level, the 95% confidence interval range is quite large for both of these statistics; for the SGP region, the changes are only marginally distinguishable from zero. In addition to the marginal significance of the changes, accurately simulating precipitation intensity and timing in the SGP region during summer is particularly difficult for conventional climate models due to prevalence of organized mesoscale convective systems, which these models do not capture (Kooperman et al 2014). By the end of the 21st century, the most consistent changes across models occur in the NE for RX5day and the NW for R95pTOT. The spatial distributions of these statistics are discussed in more detail below (figure 4).

Figure 4. Projected changes in summer (JJA) precipitation extremes over the period 2061–2100 relative to the reference period 1975–2014 for (a)–(d) spatial changes, (e)–(h) area-weighted subregional changes (NW-Northwest, SW-Southwest, NGP-Northern Great Plains, SGP-Southern Great Plains, MW-Midwest, SE-Southeast, NE-Northeast, US-all of US). Hatching in (a)–(d) indicates grid points where at least 70% of the GCMs agree on the sign of the change in EnsMean, and areas with statistically significance differences at 95% level are marked with black stippling. Gray bars in (e)–(h) are the EnsMean values. Figures (e)–(h) are computed as % change in regional weighted-average.
Download figure:
Standard image High-resolution imageThe JJA timeseries for the additional five indices (i.e. SDII, R10mm, R20mm, R99pTOT, PRCPTOT) are provided in the supporting information (figures S6–S10), which support similar conclusions as those discussed above, but are summarized here for completeness. Since an increase in the frequency and amount of precipitation during summer only occurs for rates greater than ∼30 mm day−1 (figures 1(a), (b) and 2(a), (b)), statistics associated with more moderate rates (e.g. R10mm and R20mm) tend to show a decreasing trend over the US. Specifically, there is a decreasing evolution of R10mm over the US on average, largely due to the decrease over MW, NGP, and SGP subregions (figure S7). Similarly, a slight decrease over the US on average is seen for R20mm (figure S8), though there is large spread across models for many subregions (e.g. NW, SGP, and SW), since 20 mm day−1 is close to the transition point from decreasing to increasing frequency, which varies between models. SDII, which is a measure of the rain rate during only days with rain (see Akinsanola et al 2020b for details), also shows no significant changes over the entire US, but generally has a slight increase of about 4% (figure S6), consistent with an overall shift toward higher rates. Similar to R95pTOT, an enhancement of extreme wet day events (R99pTOT) is evident over the US on average and across all the subregions, with the largest increases over NW and NE subregions (figure S9). The overall evolution of precipitation includes a larger decrease in the amount of precipitation from light rates than the increase from heavy rates, such that total wet day summer precipitation (PRCPTOT) declines over US and its subregions (except the SW) by the end of the 21st century (figure S10).
The DJF area-weighted temporal evolution of the projected changes in precipitation indices is presented in figures 3(e)–(h) and S11–S19 in the supplementary information. In winter, EnsMean CDD decreases on average over the US (figure 3(e)), and most significantly in the NGP by the end of the century. The EnsMean CDD in most subregions shows a small decrease (MW, NE, NGP, and NW) or no change (SE and SW), with the exception of the SGP, which depicts more temporal variability and a general increase over time (figures S11). Averaged over the US, CWD shows no significant changes, but assessment at the regional level suggests that the CWD period is likely to marginally increase in the MW, NE, and NGP (figures S12). Other regions show no change or slight decreases, but with no significant difference from zero.
Despite uncertainty and regional differences regarding changes in the number of consecutive wet days (e.g. CWD), there are robust and consistent changes in the intensity of wintertime precipitation events. A projected intensification in RX5day is found over the entire US throughout the 21st century, with a consistent increase across all the subregions with the possible exception of SGP (figures 3(g) and S13). The projected increase in maximum 5 day precipitation across all the subregions and the average over the US ranges from 3–58%. A similar increase is also seen in R95pTOT across the US and the largest increases are evident in the MW, NE, and NGP (figures 3(h) and S14). These increases are evident and statistically different from zero prior to 2040 for all subregions, except for SGP. Additionally, other indices of moderate (e.g. SDII, R10mm, R20mm) and extreme (e.g. R99pTOT) winter precipitation also increase over most US regions (figures S15–S18). The increases in precipitation intensity in regions where maximum wet period length increases and maximum dry period length decreases (e.g. MW, NE, and NGP), contribute to a significant increase in total regional wet day winter precipitation (PRCPTOT), which leads to a slight increase averaged over the entire US. However, despite a clear increase in intensity, regions with less obvious or opposite changes in CDD and CWD (e.g. SE, SGP, and SW) show no change or declining PRCPTOT (figure S19).
3.4. Spatial and subregional changes in precipitation extremes
The projected changes in the extreme precipitation indices under SSP5-8.5 for the end of the 21st century are presented in figures 4 and 5 for JJA and DJF, respectively. Maps of the indices are shown for the EnsMean (figures 4(a)–(d) and 5(a)–(d)), and area-weighted averages for the entire US and subregions are shown for each individual model (figures 4(e)–(h) and 5(e)–(h)). For the spatial distributions, grid points where changes are statistically significant at the 95% significance level in the EnsMean are identified with stippling, while grid points where at least 70% of the ensemble members agree on the sign of change in the EnsMean are hatched.

Figure 5. Same as figure 4 but for the winter (DJF) season.
Download figure:
Standard image High-resolution image
The projected changes for summer are presented in figure 4. CDD (figure 4(a)) is intended to assess the length of dry periods and is generally inversely related to other precipitation indices (Akinsanola and Zhou 2019). The EnsMean projects a statistically significant increase in CDD over much of the northern US, particularly the NGP and MW subregions. The NE, MW, NGP, and NW subregions have the largest projected increase in CDD, between 16 and 42%. There is also strong intermodel agreement among the ensemble members—at least 70% of the models agree on the sign of change in the EnsMean in most grid points for these regions. In particular, all models agree on the overall sign of the change in the MW, all but one agree for the NE and NGP, and all but two agree for the NW (figure 4(e)). The SGP and SE subregions are also projected to have increases in summer CDD, but the increases in these regions are smaller and exhibit less model agreement. In the SW subregion there is a statistically significant decrease centered on Northern California and Nevada (figure 4(a)). However, the overall decrease in the SW subregion is small and intermodel spread is large (figure 4(e)). Differences in the subregional changes and the individual model response have a large influence on the projected changes averaged over the entire US, which has an increase of about 4%–22% in the EnsMean.
The spatial distribution of the changes in CWD is presented in figure 4(b). A statistically significant increase (decrease) is evident over much of the SE (NW) US. The strongest intermodel agreement is seen in the broad increase in North Carolina, Virginia, Kentucky, and Tennessee (figure 4(b)), with the majority of models agreeing on the sign of change overall in the SE region (figure 4(f)). Less conspicuous changes are found over the other major parts of the domain as the projected changes are not only small but also not statistically significant. Also, the projected changes exhibit high inter-model spread as fewer models agree on the sign of change in the EnsMean. Specifically, the regional changes in CWD averaged over the entire US and its subregions range from −40% to + 70% for the ensemble members and between −8% to + 4% for the EnsMean (figure 4(f)). The range of model projections for individual subregions are consistently bracketed by large decreases from GFDL-CM4 (which also consistently has the largest CDD increases) and large increases from CanESM5. The cause of consistent difference across models such as this will be the subject of future work. Overall, these results indicate that there are large uncertainties in the projected changes in CWD in CMIP6.
Generally, RX5day increases over most of the US (figure 4(c)). The area-weighted projected changes over the US and its subregions increase by about 6%–16% for the EnsMean, with the largest increases over the NE, SE, and NW subregions (figure 4(g)). However, few grid points are statistically significant at 95% level and have at least 70% of model members agreeing on the sign of change in the EnsMean. The NE is the only region with widespread and consistent increases across models, with only one (IPSL-CM6A-LR) disagreeing on the sign of the change. Overall, the changes in individual models range from −30% to + 55% (generally bracketed by a decrease in IPSL-CM6A-LR and increase in GFDL-CM4), implying large uncertainties in the projected changes, aside from the NE. The projected changes in R95pTOT presented in figures 4(d) and (h) are similar to RX5day, but with more agreement among models. R95pTOT is projected to increase over all of the US, with several areas showing at least 70% of the models agree on the sign of change in the EnsMean. The projected increases have broad statistical significance over the NE and NW, with a few significant grid points in the SE, SW, and NGP subregions. Overall increases range from 4%–13% for the EnsMean, with the largest increase over the NW subregion where only one model (IPSL-CM6A-LR) disagrees on the sign (figure 4(h)). Similar to the other indices, the largest changes across subregions are consistently from GFDL-CM4. Overall, the subregion averages suggest fair intermodel agreement, although a few models (i.e. CanESM5, IPSL-CM6A-LR, and UKESM1-0-LL) project an opposing change.
The spatial pattern of changes in SDII, R99pTOT, R10mm, R20mm, and PRCPTOT are presented in figures S20(a)–(e), while the area-weighted regional changes are presented in figures S20(f)–(j). Projected increases with agreement among models are evident over much of the US (particularly the NE, NW, and SE) for SDII and R99pTOT (figures S20(a) and (b)). Fewer grid points, specifically over the NE and NW subregions, have changes that are also statistically significant at 95% level. The subregional changes in SDII (R99pTOT) range from 2%–7% (3–11%) for the EnsMean, with NE subregion exhibiting the largest increase (figures S20(f) and (g)). The changes in the ensemble members for SDII (R99pTOT) ranges from −18% to + 30% (−29% to + 53%) across all the subregions and the US as a whole. Both the R10mm and R20mm (figures S20(c) and (d)) exhibit projected increases (decreases) over much of the SW, NW, and SE (NGP and MW), although the magnitude of the increase is greater for R20mm. The projected changes for some grid points are statistically significant at the 95% level with some intermodel agreement, particularly for the SW and MW in R10mm. The regional changes in both indices are also robust in some subregions (e.g. MW for R10mm and NW for R20mm), while significant intermodel spread is present in other regions (figures S20(h) and (i)). The EnsMean changes in PRCPTOT exhibit an increase over the SW, and parts of the NW and SE subregions while other subregions show a decrease (figure S20(e)), generally reflecting the pattern of change in moderate rates (e.g. R10mm). The projected changes are significant (95% level) and robust (70% model agreement) over much of the north central US. Based on area-weighted changes (figure S20(j)), decreases in the EnsMean dominate projections in most subregions, with the exceptions of an increase in the SW and no change in the SE. The changes in EnsMean (individual models) range from −10% to 2% (−41% to 64%).
The spatial and subregional distributions of the changes in CDD, CWD, RX5day, and R95pTOT for winter are shown in figure 5. There is a statistically significant decrease in CDD over the northern US, and less significant increases along the southern edges of the SW and SGP subregions (figure 5(a)). There is high intermodel agreement in the projected changes as at least 70% of the ensemble members agreed on the sign of change in the EnsMean to the north and south of the transition region. The projected decreases in CDD by the EnsMean range from −1% to −10% over the US as a whole and its subregions, except for the SGP where an increase of 4% is projected and SW where there is no regional average change (figure 5(e)). The changes in individual models range from −23% to + 22% in all the subregions and the US as a whole. Statistically significant projected intensification in CWD is evident over NGP, MW, and NE subregions of the US, while a less significant decrease is projected over SW, SGP, and SE subregions (figure 5(b)). There is considerable agreement among models in the projected changes, particularly for the NE (the subregion with the largest increase) and NGP, where almost all models agree on the sign of the change (figure 5(f)). The SGP subregion exhibits the largest decrease of any region, though three models show an opposite sign of change. In general, the pattern of CWD is consistent with CDD, except for the NW, where no significant change is found and models spread is relatively larger. Overall, the changes range from −18% to + 27% for the individual models and EnsMean (figure 5(f)).
Intensification of both RX5day and R95pTOT (figures 5(c) and (d)) in winter is projected over the entire US, regardless of the CDD or CWD changes, with high intermodel agreement to the EnsMean projected changes. Also, the changes at most grid points are statistically significant at the 95% confidence level. The subregional projected increases in both RX5day and R95pTOT range from 2%–57% (figures 5(g) and (h)), and all the ensemble members unanimously project an increase over the entire US and its subregions. As shown for the temporal evolution described above, the increase in the intensity of heavy winter precipitation events is the most robust and significant change in our CMIP6 analysis.
Furthermore, winter changes in SDII, R99pTOT, R10mm, R20mm, and PRCPTOT (figure S21) also show robust patterns. Similar to RX5day and R95pTOT, we found statistically significant and robust projected increases in both SDII and R99pTOT over the entire US (figures S21(a) and (b)). The increase in EnsMean ranges from 9%–33% across all the subregions and the entire US, and the largest increase is evident over the MW and NE subregions (figures S21(f) and (g)). Additionally, we found a robust increase in R10mm and R20mm over most of the domain (figures 21(c) and (d)), although a decrease is evident that is centered in Mexico. The largest projected increase is found over the NGP in both indices, and the largest intermodel spread is evident over SGP (figures S21(h) and (i)). The increases in both moderate and extreme intensity, along with decreases in CDD, translate to a robust projected increase in total wet day winter precipitation over the northern US (figure S21(e)). The southern US (i.e. SW, SGP, and SE subregions) encompasses the transition region for many indices (e.g. decreases in CDD to the north and increases to the south), such that changes are smaller, less significant and include projected decreases in PRCPTOT overall. Across the subregions, projected changes in individual model members range from −28% to + 30%, with the largest increase (decrease) over the NGP (SGP) subregion (figure S21(j)).
4. Summary and discussion
Documenting the projections of changes in daily precipitation characteristics, including the frequency and intensity as well as extreme events, are critical for long-term socioeconomic planning that minimizes damages to natural and human systems. The spatial and temporal changes in daily precipitation characteristics and associated extremes are investigated over the US and its subregions in the most recent GCMs (CMIP6). The present-day simulations of the sets of CMIP6 models used herein were evaluated in our previous study (see Akinsanola et al 2020b), and results from this study suggested that the EnsMean can reproduce the mean and extreme precipitation relatively well. While CMIP6 models exhibit slight improvements over previous versions, the 'drizzling' bias, which has been a long-standing problem of global climate models, has not been alleviated. Other biases in the present-day representation of these extreme indices have more seasonal and regional dependence, including high biases for the amount and frequency of precipitation in the western half of the US during winter and a low bias for the intensity of heavy rainfall in the Central US during summer. Overall, the EnsMean outperforms individual models across all the extreme precipitation indices, which is in line with previous multi-model studies (Sillman et al 2013a, Zhou et al 2014, Akinsanola and Zhou 2019) and is the primary focus of our analysis here.
In this study, we have focused on projected changes simulated by the CMIP6 models. These simulations project an increase (reduction) in the amount of intense (medium) precipitation in summer under a high greenhouse gas emissions scenario (SSP5-85). The CMIP6 models also project decreasing frequencies for daily precipitation rates between 0.1 to 20 mm day−1, though the projected changes in summer frequency distributions have considerable intermodel spread, which we interpret as an indication of uncertainty. In contrast, a robust projected enhancement (reduction) of winter precipitation frequency is evident for medium-heavy (light) rates over the US. These changes are associated with an increasing amount of precipitation from rates between 10 to 100 mm day−1. Furthermore, the temporal evolution of the projected extreme precipitation indices indicates a significant increase in most of the wet extremes (RX5day R95pTOT, and R99pTOT) for summer and winter seasons over most US subregions, with the highest intensification projected to occur in the late 21st century. Also, the CDD period and PRCPTOT are projected to have significant decreases and increases, respectively, over the northern US in winter, with a reversal evident in summer season. Overall, compared to the summer season, the winter exhibits more robust and consistent changes in these indices over time, highlighting the importance of seasonal-scale analysis. Our CMIP6 analysis for winter is consistent with earlier regional models (Dominguez et al 2012), which also projected a robust increase in the intensity of precipitation extremes over the western U.S. toward the latter half of the 21st century.
For a thorough analysis of spatial changes in precipitation extremes, we used two assessment statistics (i.e. assessing (a) grid points where changes are statistically significant at the 95% significance level in the CMIP6 EnsMean and, (b) grid points where at least 70% of the ensemble members agree on the sign of change in the EnsMean) as indicators of the robustness of the projected changes. Robust intensification dominates most of the projected winter precipitation extremes, particularly over the northern parts of the US, despite pronounced uncertainty that dominates the summer season (except an increase in CDD in the Central US). We note that the percentage changes in heavy and very heavy winter precipitation days (R10mm and R20mm) are larger than for other indices, indicating disproportionately larger increases in heavy winter precipitation compared to other aspects of precipitation. The 10–20 mm day−1 zero-crossing is also evident in the precipitation amount distributions, which show a significant increase in amount for rates above these values. Reduced agreement in summer is consistent with a previous study (Harding and Snyder 2014), which reported significant uncertainties in projected changes in warm-season precipitation extremes over the US. They attributed this uncertainty to the inadequacy of models to simulate hydrological extremes resulting from convective precipitation. However overall, the intensification of heavy precipitation over the US during the 21st century is part of a broader response consistently found in previous climate projection studies (e.g. Tebaldi et al 2006, Sun et al 2007, Giorgi et al 2011, Field et al 2012, Sigh et al 2013, Sillmann et al 2013b, Akinsanola and Zhou 2019).
Extreme precipitation events can have different impacts in winter versus summer, which motivates our seasonal-scale analysis. Specifically, the substantial projected increase in winter precipitation extremes has implications for flooding, transportation and energy-use during winter, but also water availability from snowmelt throughout the year. In summer, despite overall better present-day performance for many aspects of extreme precipitation (Akinsanola et al 2020b), we found significant uncertainties in the projected precipitation characteristics, which poses a challenge for adaptation planning. Nevertheless, focusing on the most robust features, such as a potential increase in drought stress in the NGP and MW (i.e. increases in CDD and decreases in PRCPTOT), provides useful information for mitigation and adaptation applications. Further improvements of the GCMs to realistically represent unresolved and poorly understood processes are crucial to reducing the uncertainties reported in this study. However, it is important to note that improvements in present-day simulations do not necessary imply a robust projected response across models. It is thus critical to also improve understanding of the dynamic and thermodynamic mechanisms responsible for the projected future changes as represented by the ensemble mean as well as individual models, which will be the focus further investigation.
Acknowledgments
We acknowledge the support of the U.S. Department of Energy (DOE) Regional and Global Model Analysis (RGMA) Program (DE-SC0019459) and via the National Science Foundation (NSF) IA 1844590. This material is based in part upon work supported by the National Center for Atmospheric Research, which is a major facility sponsored by the NSF under Cooperative Agreement No. 1947282 awarded to AGP. Also, partly performed under the auspices of the DOE by Lawrence Livermore National Laboratory under Contract DE-AC52-07NA227344. GJK acknowledge support from the University of Georgia's Office of Research, Junior Faculty Seed Grant Program and President's Interdisciplinary Seed Grant Program. We acknowledge the World Climate Research Programme's (WCRP) working group on coupled modelling which is responsible for CMIP6, and we thank the climate modeling groups (listed in table 1) for producing and making their model output available, the ESGF for archiving the data and providing access, and the multiple funding agencies that support CMIP6 and ESGF. We thank the DOE's RGMA program area, Data Management program, and National Energy Research Scientific Computing Center for making this coordinated CMIP6 analysis activity possible. We thank the anonymous reviewers and editor for their constructive comments and suggestions.
Data availability statement
The data that support the findings of this study are openly available at the following URL/DOI: www.wcrp-climate.org/wgcm-cmip/wgcm-cmip6.