

Abstract
Water shortage is regarded as the most critical constraint limiting the world's capacity for food security. While previous studies have attributed water scarcity primarily to climate change or some natural factors (e.g. lack of fresh water), few have investigated the impacts of shifts in agricultural systems on water resources. This study quantitatively distinguished the effects of spatiotemporal changes in climatic factors (e.g. temperature and precipitation), planted area, and crop type on China's irrigation water resources by use of logarithmic mean Divisia index. The results indicated that in the past 25 years (from 1990 to 2015), changes in planted area, crop mix, and climatic factors all led to an increase in irrigation water demand (IWD) in China. Changes in planted area had the greatest effect on IWD (+45.4 × 10⁹ m3), followed by the climate change effect (+10.8 × 10⁹ m3). In particular, the rapid expansion of maize and other crops in northern China in recent decades has greatly increased irrigation water consumption. It is suggested that in addition to mitigating the adverse effects of climate change, China must address its water scarcity problems by appropriately controlling the scale of some water-intensive crops. These strategies will be essential for adapting agricultural production to future climate change while ensuring food security and water sustainability.
Export citation and abstract BibTeX RIS

Original content from this work may be used under the terms of the Creative Commons Attribution 4.0 license. Any further distribution of this work must maintain attribution to the author(s) and the title of the work, journal citation and DOI.
1. Introduction
China is one of many countries confronted with serious water shortages. Farm irrigation consumes almost 90% of agricultural water in China and agricultural use accounts for more than 60% of China's fresh water (Cheng et al 2009, Guo and Shen 2016, Kang et al 2017, Zhang et al 2018). In recent decades, the pressure to ensure food security and sustainably use water resources has grown due to increasing population and associated economic development, urbanization, and improvements in living standards (Du et al 2015, Guo et al 2016, Kang et al 2017, Zhang et al 2018). In particular, the expansion of water-intensive crops and the spatial mismatch between food production and water resources in China has led to rapid declines in groundwater levels in several of China's major grain production areas (e.g. Northeast China and the North China Plain) (Hu et al 2010, Wang et al 2014, Kang et al 2017, Wang 2018). As a result, large reductions in crop yields caused by climate change and droughts have been seen in recent years (Feng et al 2010, Zipper et al 2016, Davis et al 2019). In light of these multiple threats, agricultural water scarcity problems are projected to be exacerbated and further threaten food security.
Ensuring food security and providing insights for agricultural water management require investigation and understanding of the factors driving irrigation water demand (IWD) and influencing variation in irrigation patterns. IWD is driven by multiple factors such as climatic conditions, water use intensity, planting area, and economic development (Qadir et al 2010, Dalin et al 2015, Camarotto et al 2018). Current research studies have investigated irrigation water resources from the aspects of supply and demand, spatial and temporal variations, and their driving factors (Schyns et al 2019, Xu et al 2019). However, as for the causes of agricultural water scarcity, previous studies have largely focused on climate change and other natural factors (e.g. lack of fresh water), and few studies have investigated human-driven factors such as shifts in cropping systems.
In this study, we investigated historical changes in IWDs for different crops in China from 1990 to 2015. We constructed a decomposition model based on the logarithmic mean Divisia index (LMDI) method to quantify the different effects of three main factors (planted area, crop mix, and climate change) on regional and national IWDs. The results may provide important insights and broad management recommendations to ensure water and food security to facilitate agricultural sustainability.
2. Materials and methods
2.1. Data sources
This study selected eight major crops in China, including wheat (Triticum aestivum L.) (winter wheat and spring wheat), maize (Zea mays L.) (spring maize and summer maize), paddy rice (Oryza sativa L.) (early-season, mid-season, and late-season rice), soybean (Glycine max L.), millet (Panicum miliaceum L.), potato (Solanum tuberosum L.), cotton (Gossypium hirsutum L.), and rapeseed (Brassica napus L.). Crop phenology data came from the crop growth and development data set (http://data.cma.cn/data/cdcindex/cid/4ee1c7fce9cd6a5f.html) of the China Meteorological Data Sharing Service System. The crop water demand coefficients (Kc) of different crops were provided by the FAO (www.fao.org/3/X0490E/x0490e0b.htm), and they were calibrated based on the local climatic conditions following the method provided by FAO.
The planted areas of different crops were derived from the county-level crop statistical data for 2850 counties in 1990, 1995, 2000, 2005, 2010, and 2015, provided by the Institute of Agricultural Information, Chinese Academy of Agricultural Sciences (CAAS). Due to the lack of statistical data, the study area did not include Hong Kong, Macao, and Taiwan, and when a county unit lacked a continuous dataset, the county was designated as a no data area.
The IWDs of different crops were calculated using long-term climatic observation data and crop phenological parameters. We collected 30 year daily climate data (1987–2016) from 839 national weather stations in the China Meteorological Data Sharing Service System (http://data.cma.cn), and the dataset included daily average temperature, maximum temperature, minimum temperature, precipitation, average relative humidity, average wind speed, and sunshine hours.
2.2. Irrigation water demand
IWD was calculated for each of the eight crops from values of reference crop evapotranspiration, crop water demand coefficients, and effective precipitation during the crop growing seasons.
2.2.1. Reference crop evapotranspiration
The FAO Penman–Monteith equation (www.fao.org/3/X0490E/x0490e08.htm) was used to calculate the daily evapotranspiration of reference crops (Allen et al 1998):
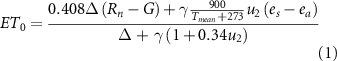
where Rn is the net radiation at the crop surface (MJ · m−2 · d−1); G is the soil heat flux density (MJ · m−2 · d−1); Tmean is the daily average temperature (°C); u2 is the wind speed at 2 meters height (m/s); es is the saturation vapour pressure (kPa); ea is the actual vapour pressure (kPa); Δ is the slope vapour pressure-temperature curve (kPa ·°C−1), and γ is the psychrometric constant (kPa ·°C−1).
2.2.2. Crop water requirement
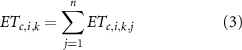
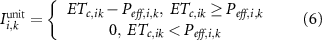
Daily water requirement for each crop was calculated from reference crop evapotranspiration (ET0) multiplied by the crop water demand coefficients (Kc) for each day. We followed the methods provided by FAO to calibrate Kc for different growth stages of each crop. The calibrated Kc was then used to construct the Kc curve in order to determine daily Kc. Finally, the ETc for crop i on day j of growth stage k was calculated as (Allen et al 1998):

where ETc,i,k,j, Kc,i,k,j, ET0,i,k,j are, respectively, the crop water requirement, crop water demand coefficients, and reference evapotranspiration for crop i on day j of growth stage k. The water requirement in the kth stage was given as:
where ETc,i,k is the crop water requirement during growth stage k; j (1, 2,...,n) indicates the jth day of stage k; ETc,i,k,j is the water requirement on day j of growth stage k for crop i.
2.2.3. Effective precipitation
Effective precipitation is defined as the fraction of the total precipitation that is available to the crop and does not run off (Petra and Stefan 2002). In this study, we calculated the effective precipitation during the growth stages of each crop at different sites. The growth stages of different crops were divided according to regional agricultural phenology. By matching crop growth stages with the weather stations in this region, we could obtain a data set of weather stations with corresponding crop growth stages. Equation (4) gives a commonly used method for measuring effective precipitation (Petra and Stefan 2002):
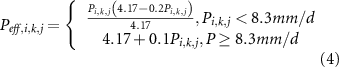
where Peff,i,k,j, αi,k,j, Pi,k,j are, respectively, the effective precipitation, utilization coefficient, and precipitation for crop i on day j of growth stage k.
The effective precipitation for growth stage k was given as:
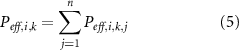
where Peff,i,k is the effective precipitation during growth stage k, j (1, 2,...,n) is the jth day in this stage, and Peff,i,k,j is the effective precipitation on day j of growth stage k.
2.2.4. Irrigation water demand
We calculated IWD for each crop (Ii) as (Moseki et al 2019):
where  and
and  are the IWDs for growth stage k and for the entire growing season of crop I per unit area, respectively.
2.2.5. County-level IWD
By using the 'inverse distance weighted interpolation method' and 'zonal statistics as table' tools in ArcGIS software (www.esri.com/en-us/arcgis/about-arcgis/overview), we obtained the IWD per unit area for each crop in each county. To avoid the unrepresentative impact of extreme weather in a single year on the inter-annual climate change effect, we used five-year average values of climate data rather than single-year values to quantify climate impacts and to calculate the IWD per unit area for each crop. For example, the climate effect or IWD per unit area in 1990 was the average value over the 1988–1992 period, the average value of 1993–1997 was used for 1995, and the same was done for the other years of 2000, 2005, 2010, and 2015. County-level IWD (I) was calculated from the average IWD per unit area and total planted area of each crop in each county of China:
where I is the regional total IWD and Pi is planted area of crop i.
2.3. Decomposition analysis of variations in IWD
In order to quantify the contributions of various factors to IWD and water scarcity in China, we used LMDI to quantitatively distinguish the different effects of climate change, changes in planted area, and changes in crop mix on IWD. This method originated from Divisia index decomposition, a form of index decomposition analysis (IDA) (Ang 2004). In the 1980s, IDA was used to distinguish the impacts of product structure and energy intensity on electricity consumption of industrial sectors. In recent years, new versions of IDA and the LMDI method have been widely used in the fields of energy and environment (Timilsina and Shrestha 2009, Xu et al 2014, Ang 2015), as well as in agricultural water resource analysis (Zhao and Chen 2014, Zhao et al 2017, Zhang et al 2018, Zou et al 2018). Moreover, due to its simplicity and ability to completely decompose the factors influencing IWD, LMDI can be combined with geographic information systems to identify the contributions of multiple factors at different space-time scales (Fatima et al 2019, Yao et al 2019, Wen and Li 2020).
The LMDI approach was used to analyze the driving factors of changes in IWD across China. The decomposition model of IWD was developed based on published research studies (Xie and Su 2017, Zhang et al 2018, Zou et al 2018):
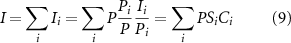
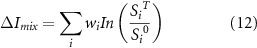
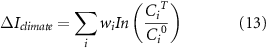
where I is the regional total IWD; Ii is the IWD of crop i; P is the planted area, which refers to the planting scale or crop spatial extent; Si= (Pi/P) is the proportion of the total planted area that is planted to crop i, and represents the crop mix. Crop mix is defined and measured as the proportion of each of the eight crops to the total planted area, which reflects the difference in regional IWD caused by different crop types and combinations; Ci = (Ii/Pi) is the IWD per unit area for crop i, which is determined by the water requirement and effective precipitation at different crop growth stages, thus mainly representing the climate change effect (including precipitation, temperature, and other climatic factors).
The LMDI approach includes two kinds of models (i.e. additive decomposition and multiplicative decomposition). We used additive decomposition because of its simplicity and consistency of results (Ang 2015):

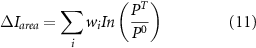
where IT and I0 are the IWD for periods T and 0; ΔItot is the change in IWD; ΔIarea, ΔImix, and ΔIclimate represent the effects of planted area, crop mix, and climate change, respectively. Finally, the effect of each driving factor on the change in IWD was calculated as (Ang 2015):
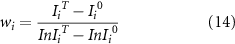
where the superscripts 0 and T denote year 0 and year T.
3. Results
3.1. Changes in IWD and their driving factors during different periods
As shown in figure 1(a), cotton had the largest IWD per unit area, followed by rice, wheat, and maize. Total crop planted area in China increased during the past 25 years, especially from 2005 to 2015 (figure 1(b)). The total planted area increased from 1.02 × 10⁸ ha in 2005 to 1.17 × 10⁸ ha in 2015, with a mean growth of 1.49 × 10⁶ ha per year. There was a notable change in the composition of the planted area. Maize comprised a greater share of total planted area compared with other crops as time went on, increasing from 19.79% in 1990 to 34% in 2015. Moreover, the planted area of maize peaked at 3.98 × 10⁷ ha in 2015, followed by rice (2.9 × 10⁷ ha). Rice also comprised a large share of the total planted area, but its planted area has changed ony slightly in the past 25 years. In contrast, the planted area of wheat declined from 2.96 × 10⁷ ha in 1990 to 2.22 × 10⁷ ha in 2005. Planted area of both potato and rapeseed increased from 1990 to 2015, although the planted areas of both were much small than seen for other crops.
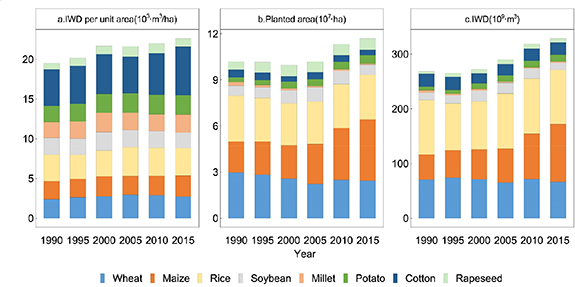
Figure 1. Changes in irrigation water demand per unit area (a), planted area (b), and irrigation water demand (c) for eight crops in China.
Download figure:
Standard image High-resolution imageFrom 1990 to 2015, China's total IWD increased by 60.4 × 10⁹ m3, with different trends in different periods (figure 1(c)). Based on the variation pattern for national IWD, we found that the IWD has increased considerably between 2000–2005, 2005–2010 and 2010–2015. These three periods exhibited IWD increases of 18.4 × 10⁹ m3, 28.3 × 10⁹ m3, and 9.7 × 10⁹ m3, respectively. Maize, rice, and wheat accounted for more than 75% of total IWD. Rice used the most irrigation water (averaging 95.7 × 10⁹ m3), followed by wheat (averaging 69.7 × 10⁹ m3). The proportion of IWD attributed to maize increased greatly from 17.3% in 1990 to 32.1% in 2015.
The additive decomposition results for different time periods are shown in figure 2. From 1990 to 2015, changes in planted area, crop mix, and climate change increased IWD by 45.4 × 10⁹ m3, 0.8 × 10⁹ m3, and 10.8 × 10⁹ m3, respectively. The change in planted area had the most important effect, followed by the effect of climate change. However, the effects of different driving factors in different periods were varied. Climate change had negative effects in the periods of 2005–2010 and 2010–2015 (figure 2), with a decrease in IWD of 4.9 × 10⁹ m3, and 4.3 × 10⁹ m3 respectively. In contrast, planted area increased IWD in both periods of 2000–2005, 2005–2010, and 2010–2015, especially in period 2005–2010 (+34.8 × 10⁹ m3). At the national scale, crop mix was a relatively weak driving factor, and exerted different effects in different time periods.
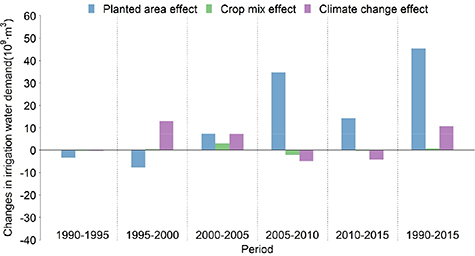
Figure 2. Driving factors for changes in IWD across China.
Download figure:
Standard image High-resolution image3.2. The effects of different crops on changes in IWD
The total effect (the combination of changes in planted area and changes in IWD per unit area) of each crop on changes in IWD across China varied greatly (table 1). The effect of maize on the increase in IWD from 1990–2015 was much larger than observed for any other crop, and was followed by wheat and potato. Rice showed large, opposite effects for 1990–1995 (−13.59 × 10⁹ m3) and 2000–2005 (12.77 × 10⁹ m3). During 2000–2005, most crops contributed to an increase in IWD except for wheat and millet. During 2005–2010 and 2010–2015, the most influential crop was maize, which increased IWD in China by 21.20 × 10⁹ m3 and 22.32 × 10⁹ m3, respectively.
Table 1. The total effect of each crop on changes in IWD (109 m3) across China.
| Time | Wheat | Maize | Rice | Soybean | Millet | Potato | Cotton | Rapeseed |
|---|---|---|---|---|---|---|---|---|
| 1990–1995 | 3.66 | 3.41 | −13.59 | 0.44 | −1.27 | 1.08 | 0.17 | 2.15 |
| 1995–2000 | −3.15 | 4.65 | 1.04 | 5.06 | −0.14 | 3.17 | −6.04 | 1.12 |
| 2000–2005 | −5.80 | 6.64 | 12.77 | 0.29 | −1.09 | 0.33 | 3.01 | 1.45 |
| 2005–2010 | 6.39 | 21.20 | −0.26 | −1.65 | 0.06 | 1.04 | 0.88 | 0.13 |
| 2010–2015 | −5.14 | 22.32 | −0.88 | −5.42 | 0.05 | 0.60 | −0.18 | −1.57 |
| 1990–2015 | −4.04 | 58.22 | −0.93 | −1.28 | −2.38 | 6.22 | −2.16 | 3.28 |
As shown in the figure 3, maize cultivation dominated the increased IWD in Northeast China (NEC) and central Northwest China (NWC). Other crops (except for wheat, maize, and rice) contributed greatly to the increased IWD in western NWC and the Tibet Region (TR). In most regions of North China (NC), wheat and other crops contributed to the decreased IWD. Most regions of South China (SC) were dominated by the cultivation of rice, which decreased IWD. The effects of different crop types compensated for each other across different regions, and it was one of the reasons that the shift in crop mix was the least influential of the factors nationally.

Figure 3. Spatial patterns of changes in IWD from 1990 to 2015 due to specific crops. A prefix '+' prior to the crop indicates a dominant positive effect of this crop on the increase in regional IWD compared with the other crops, whereas '−' indicates a negative effect of this crop on the decrease in regional IWD compared with other crops. The 'others' category in the figure includes soybean, millet, potato, cotton, and rapeseed.
Download figure:
Standard image High-resolution image3.3. Spatiotemporal patterns of IWD changes and their driving factors
The spatial distribution of changes in IWD showed a significant difference between northern and southern China from 1990–2015 (figure 4). The IWD increased in the north and decreased in the south. Northern China largely suffered from an intense increase in IWD, while reduction in IWD occurred in large portions of the three southern regions (the Yangtze River Region (YRR), South China (SC), and the eastern part of Southwest China (SWC).
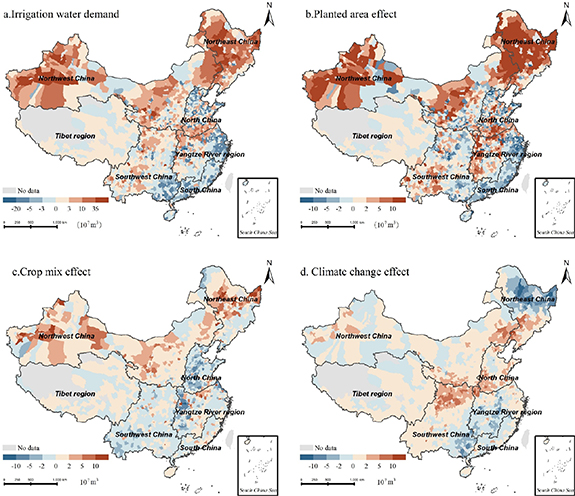
Figure 4. Spatial distributions of changes in IWD (a), planted area effect (b), crop mix effect (c), and climate change effect (d) during 1990–2015.
Download figure:
Standard image High-resolution imageGenerally, these spatial patterns reflected the dominant effect of changes in planted area, and the secondary effect of climate change and crop mix on the historical changes in regional IWD. Particularly in northern China, planted area effect contributed the most to the increase in IWD in most parts of NEC and NWC (figure 4(b)). Also in the western part of YRR, the negative effect of crop mix was notably offset by the positive effect of planted area. While in the northern part of SWC, it reflected a relatively significant impact of climate change on changes in regional IWD (figure 4(d)). Overall, planted area had the largest effect in most regions of China, and climate change and crop mix played a complementary role in IWD changes.
More detailed information regarding the effect of the three driving factors on interannual changes in IWD is shown in figure 5. In NEC and NWC, the changes in regional IWD were mostly affected by planted area during the periods of 2005–2015 and 1990–2015. The climate change effect in NC resulted in overall increases in regional IWD for all periods except 2000–2005. In contrast, the climate change effect decreased IWD in YRR for almost all periods except during 2000–2005. The IWD was essentially not changed by any of the three driving factors in SC and TR as compared with other regions.

Figure 5. Driving factors of IWD changes during different time periods in different regions. (NEC-Northeast China; NWC-Northwest China; NC-North China; YRR-Yangtze River Region; SWC-Southwest China; SC-South China; TR-Tibet Region).
Download figure:
Standard image High-resolution image
4. Discussion
China's agricultural production has experienced tremendous development over the past recent decades. That development has induced many ecological and environmental problems, especially those of water shortage and over-exploitation of groundwater in northern China. Therefore, there is an urgent need for assessing the IWD of current cropping systems in order to determine whether the current food production systems in China are capable of sustainably utilizing water resources. Compared with previous research studies that largely focused on the impacts of climate change on water scarcity, this study considered both environmental changes and land use changes in cropping systems. Our findings may provide valuable insights for adapting agricultural production to future climate change while ensuring food security and agricultural water sustainability in China and the world.
4.1. Increased irrigation water demand coincides with cropping expansion in China
This study demonstrated that the planted area expansion of some water-intensive crops, particularly the rapid increase in planted area of maize in northern China, was the main contributor to increased IWD and water scarcity across China. From 1990 to 2015, the planted area of eight main crops increased by 14.7%, which not only contributed to gains in grain production, but also imposed heavy pressures on the environment (Lu and Tian 2013, Huang et al 2017). With continued climatic warming, the planted areas of some warm-season crops may further expand. Prior studies reported that the planting boundaries for paddy rice have tended to move northward (Ye et al 2014), and the northern limits of maize production in NEC have also shifted to the north (Liu et al 2013, Yang et al 2015). Rapid cropping expansion and intensification can increase regional IWD. For example, maize water demand in the West Liaohe Plain of NEC increased by 0.32 billion m3 from 2000 to 2010 due to the increase in maize acreage (Yang et al 2016). In order to mitigate water scarcity, policy makers should properly control planted area and make it match availability of regional water resources.
4.2. Sustainable use of agricultural water resources under a changing climate
Our quantitative analysis of the changes in IWD and its driving factors demonstrated that planted area was a major factor that caused unsustainable use of water resources from 1990 to 2015. In the past, there has been a spatial mismatch between food production and water resources in China, i.e. water resources in northern China are scarce, but in the south they are abundant. However, this study found that over the past recent decades, changes in total planted area and crop mix have made the north-south mismatch more serious, thereby undermining China's long-term food and water security. A related study also showed that over the past decades most of the increase in irrigation water consumption in China was concentrated in NC and NWC, and was largely driven by maize expansion (Zuo et al 2018). Similarly, a region-specific study in China showed that the expansion of the total cultivated areas also increased agriculture water consumption (Wang et al 2020). It is strongly suggested that China must mitigate its water shortage problems by properly controlling the scale of some water-intensive crops. These strategies will be essential for promoting adaptation to climate change while ensuring China's food and water security.
Although climate change was secondary to total planted area in affecting IWD, the effects of climate change were regionally important. Additionally, climate change is likely to become more important as potential area for crop expansion will diminish due to finite land area. Besides, large-scale agricultural expansion could also influence the near-surface climate (He et al 2020). In recent decades, the impact of climate change on crop water demand has been investigated from many aspects. As the crop water demand is mainly determined by potential evapotranspiration and the physiological characteristics of crops, the observed climate warming and the various trends of solar radiation, relative humidity, and precipitation have posed great impacts on crop water demand and regional agricultural water resources (Dai et al 2015, Um et al 2020). In addition, there are great spatial and temporal differences in the trends of crop water demand (Xing et al 2016, Wang et al 2017). Therefore, considering the spatiotemporal complexity and uncertainty of the future climate, it is essential for decision makers to develop strategies to mitigate climate-induced water shortages while maintaining food production.
4.3. Study limitations
Due to the difficulty of obtaining the actual amounts of irrigation water applied to each crop across China over the study period, this study assumed that the crop water demand was fully met by supplementary irrigation, which may slightly overestimate or underestimate the actual IWD (Ahmadi et al 2019, Elhani et al 2019, Fullana-Pericas et al 2019). The rapid economic growth and urbanization associated with an increasing population will demand greater crop production and IWD (Dalin et al 2015, Xu et al 2015). Improving water use efficiency may help to reduce regional agricultural water consumption (Zhao and Chen 2014). Because the driving factors of changes in IWD were determined based on historical data in this study, further studies may consider possible climate change scenarios in the future, which could provide a more comprehensive reference for agricultural water management.
Due to data availability and research design limitations, some important factors were not accounted for in the current study. For example, interactions between climate, planting area, and crop type; separating the climate change factors into temperature and precipitation; and considering the contribution to ETc of soil water storage from a previous growth stage when calculating IWD. We expect to address these problems in future research. In particular, accounting for soil water storage may be accomplished by using some process-based crop models such as Apsim, DSSAT, etc.
5. Conclusions
This study quantitatively distinguished the effects of climate change, changes in planted area, and crop mix on IWD across China, and we analyzed their spatial and temporal variations. The results indicated that historical variations in planted area, crop mix, and climatic factors all led to an increase in national IWD in China. Changes in planted area had the greatest effect, followed by the climate change effect. In particular, the rapid expansion of water-intensive crops including maize and cotton in northern China in the most recent decade greatly increased agricultural irrigation water consumption and aggravated China's water scarcity problem. We suggest that in addition to mitigating the adverse effects of climate change, China must address its water scarcity problems by appropriately controlling the planted areas of water-intensive crops and by optimizing cropping systems. These strategies will be essential for adapting agricultural production to future climate change while ensuring food security and agricultural water sustainability.
Large spatial and temporal variations in the changes in IWD and its driving factors were evident across China. The dominant factor affecting the national IWD from 1990 to 2015 was planted area, especially during 2005–2015. The IWD in northern China increased greatly, but IWD exhibited large decreases in southern China. In addition to the effects of planted area and crop mix on IWD, climate change increased IWD in the southern part of NC and the northern part of SWC, while decreasing IWD in the YRR. This result indicated that cropping expansion and climate change over the past recent decades has aggravated the irrigation water consumption in most regions of the arid northern China. Therefore, future policies aimed at mitigating water scarcity should be region-specific. In addition to properly controlling planted areas of water-intensive crops in arid and semiarid regions, policy makers and farmers need to take full advantage of the benefits of climate change while avoiding its negative effects so as to facilitate the sustainable use of agricultural water resources.
Acknowledgments
This work was supported by the National Key Research and Development Program of China (2016YFD0300201), the National Natural Science Foundation of China (31801315; 31871581), and the Major Projects of the National Social Science Foundation of China (18ZDA074).
Data availability statement
All data that support the findings of this study are included within the article (and any supplementary information files).