

Abstract
Knowledge of both irrigation-water withdrawal (IWW) and consumption (IWC, i.e. the evapotranspiration loss of applied irrigation water) is critical to sustainable water use and management. However, IWW and IWC are not well differentiated and an integrated analysis of their changes and causes is still lacking. Here we aim to close this gap and investigate the trends and drivers of IWW and IWC over mainland China using the logarithmic mean Divisia index approach and multivariate regression and fixed-effects panel regression models. We find that IWW decreased at a rate of −1.3 km3yr−1 (or −0.4% yr−1) while IWC increased at a rate of 2.9 km3 yr−1 (or 2.4% yr−1) from 1999 to 2013, albeit both showed upward trends from 1982 to 1999. The reduction in IWW was due to the decreased water-withdrawal intensity (WWI) (i.e. IWW per unit area), while the increase in IWC was mainly due to the irrigated area expansion. We find opposite trends in IWW and IWC in about half of the Chinese provinces, with IWW decreasing and IWC increasing in most cases. Changes in irrigation efficiency (IE, defined as the ratio of IWC to IWW) and climatic factors explain a large proportion of the variance in WWI and water-consumption intensity (i.e. IWC per unit area). IE presents a strong negative correlation with WWI but a positive correlation with water-consumption intensity. The improved IE makes a nonnegligible contribution (∼20%) to the irrigated area expansion, especially in water-scarce regions. The strong positive linkage between IE and IWC together with the significant rise in IWC with increasing IE suggest that the paradox of IE (i.e. higher IE tends to increase water consumption) has manifested in mainland China. Our findings highlight the importance of considering both IWW and IWC changes as well as farmer's behavior adjustments in water resource management.
Export citation and abstract BibTeX RIS

Original content from this work may be used under the terms of the Creative Commons Attribution 4.0 license. Any further distribution of this work must maintain attribution to the author(s) and the title of the work, journal citation and DOI.
1. Introduction
Irrigation accounts for ∼70% of the global freshwater withdrawals while sustaining ∼40% of the world's food production (Siebert and Döll 2010). Hence, irrigation plays a critical role in safeguarding food security for the growing population (Ward and Pulido-Velazquez 2008) and has great implications for attaining the sustainable development goals set forth by the United Nations (Xu et al 2020). Nevertheless, in recent decades, irrigation water use increases significantly due to climate change and rapid socioeconomic growth, which places unprecedented pressure on our planet's freshwater resources (Fishman et al 2015, Rosa et al 2020), leading to groundwater depletion, wetland and lake shrinkage, and ecosystem degradation (Liu et al 2013, Cheng et al 2014, Khazaei et al 2019, Li et al 2021a). A great challenge facing politicians and scientists in the 21st century is to increase productivity to meet the growing food demand while reducing the environmental impact of agricultural system (Foley et al 2011, Jägermeyr et al 2017, Rosa et al 2020).
Despite its importance, our knowledge of irrigation remains limited (Koch et al 2020, Nie et al 2020) because irrigation is not monitored adequately due to the technical, economic, and political challenges such as low coverage of metering facilities, scattered diversion points, high equipment maintenance costs, farmer resistance to meter installation (Foster et al 2020). Irrigation-water withdrawal (IWW) and consumption (IWC) are two important terms closely related to irrigation water use, but they are not well differentiated in the literature (Bretreger et al 2019, Zhang et al 2019a, Chen et al 2020, Foster et al 2020). In fact, as shown in figure 1, IWW and IWC have very different definitions and connotations. IWW refers to the total amount of irrigation water withdrawn from rivers and aquifers, and it ends up as: (a) evaporation loss of conveyed water, (b) return flow to water sources through groundwater recharge or lateral and surface runoff, and (c) field application (i.e. irrigation water application). Applied irrigation water is further ended as return flow (Ra), crop transpiration (Tc) and soil water evaporation (Es). IWC refers to the evapotranspiration (ET) loss of applied irrigation water (Koch et al 2020), i.e. IWC = Tc + Es. Researchers and managers seem to prefer IWW to IWC because IWW can be measured directly (Pereira et al 2012, Batchelor et al 2014). However, IWW alone may provide misleading information about water availability (Perry et al 2009, Marston and Lamsal 2020), as a proportion of IWW can return to the hydrological system (Simons et al 2015) and be reused locally or downstream (Grogan et al 2017). IWC, on the other hand, shows how much irrigation water is fully consumed through ET and can provide more realistic information on water use than the IWW on a basin or regional scale (Wu et al 2021). Hence, IWC has been widely adopted in newly proposed water resource management concepts such as the water footprint (Mekonnen and Hoekstra 2020), water planetary boundary (Gleeson et al 2020), and ET-based irrigation management (Lei et al 2020).

Figure 1. Schematic diagram of the water balance for IWW.
Download figure:
Standard image High-resolution imageKnowledge of both IWW and IWC is critical to sustainable water use and management (Berbel et al 2018, Simons et al 2020). However, an integrated analysis of the changes and drivers of IWW and IWC is still lacking. To our knowledge, IWW and IWC are studied separately in most cases, focusing solely on IWW (Brocca et al 2018, Jalilvand et al 2019, Zhang et al 2022) or IWC (Romaguera et al 2014, Koch et al 2020, Vogels et al 2020). In some exceptions, researchers have attempted to convert IWW to IWC or vice versa using a predefined static irrigation efficiency (IE) (Döll and Siebert 2002, Hunink et al 2015, Van Eekelen et al 2015, Huang et al 2018, Zhou et al 2021), i.e. IWC = IWW × IE or IWW = IWC/IE. In these studies, IWW and IWC have the same spatiotemporal variability characteristics, which is at odds with reality (Malek et al 2018) and may yield misleading conclusions.
In this study, we aim to address the above gaps and investigate the trends and drivers of IWW and IWC at multiple spatial scales of mainland China. Our intent is to enhance the understanding of changes in irrigation water use and to answer three key questions: (a) What are the commonalities and dissimilarities between the trends of IWW and IWC over the period 1982–2013? (b) What has driven the changes in IWW and IWC? (c) What is the linkage between the changes in IE and IWC?
2. Methods and materials
The workflow of this study is summarized in figure 2. We first detect the turning points within the IWW and IWC time series using the Pettitt's test (Pettitt 1979) and accumulated anomaly algorithm (Zhang et al 2019b), and estimate the trends of IWW, IWC, and IE using the linear regression model (supplementary, texts). The trend is defined as the slope of the regression line fitted to the time series data using the least squares method. The estimated trend is also expressed in units of percent change per year relative to the initial year of the analysis period (supplementary, texts). According to the definition of the Food and Agriculture Organization (FAO 2011), IE is calculated as the ratio of IWC to IWW (i.e. IE = IWC/IWW). The driving factors of IWW and IWC are then decomposed using the logarithmic mean Divisia index (LMDI) method (Ang and Liu 2001). Note that LMDI does not immediately provide insight into the mechanism behind the effects of various driving factors, as it is a decomposition of effects rather than a causal model (Zhou et al 2020). Therefore, we further conduct the contribution analyses to quantify the impacts of climatic factors, crop growth, and IE on water-withdrawal and water-consumption intensity (WCI) (i.e. IWW and IWC per unit area of irrigated cropland), and to isolate the contribution of IE improvements to irrigated area expansions.
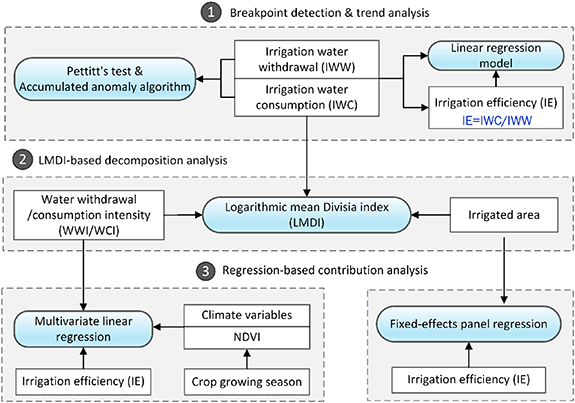
Figure 2. Workflow of this study. Number and gray boxes indicate the major steps involved in this study. White boxes are the input data sets or variables and the blue boxes are the analysis tools.
Download figure:
Standard image High-resolution image2.1. IWWl and IWC datasets
The recently released long-term IWW data (Zhou et al 2020) and IWC data (Yin et al 2020) were used in the study. The IWW data was reconstructed from the first and second National Water Resources Assessment Programs and water resource bulletins. The data is provided at the prefecture scale and covers the period from 1956 to 2013. The IWC data was estimated from an upscaled ET product (Li et al 2018) using an irrigation cropland water model that incorporates irrigated cropland mapping and phenology (supplementary, texts). The IWC data has an 8 × 8 km spatial resolution and a monthly temporal resolution, covering the period from 1982 to 2016. The IWC data of Yin et al (2020) is the first high-resolution and long-term IWC dataset for China that has considered the irrigated area changes consistent with the IWW data (supplementary, figure S2) and allows a reasonable estimation of IE.
2.2. LMDI-based decomposition analysis
The LMDI method proposed by Ang and Liu (2001) is used to decompose the driving factors of IWW and IWC. The additive forms of the LMDI decomposition of IWW and IWC can be expressed as equations (1) and (2), respectively:


where ΔIWW and ΔIWC are the changes in IWW and IWC, respectively; ΔIWWIrrArea and ΔIWWWWI represent the irrigated area effect and water-withdrawal intensity (WWI) effect, respectively, and are calculated using equations (3) and (4); ΔIWCIrrArea and ΔIWCWCI represent the irrigated area effect and WCI effect, respectively, and are calculated using equations (5) and (6):
where the subscripts T and 0 denote the status at the beginning and end of the study period, respectively, and they are expressed as a 6 year average to ameliorate the effects of extreme values, following the approach of Zhang et al (2020a).
2.3. Regression-based contribution analysis
2.3.1. Quantifying the impact on water-withdrawal and consumption intensity
This study applies a multivariate linear regression model to evaluate the effects of changes in climatic factors, IE, and crop growth on WWI and WCI:
where WWIs
and WCIs
are the standardized WWI and WCI, respectively; αi
is the regression coefficient; b is the intercept; and  is the error term. P, T, H, R are the climatic variables representing the growing season precipitation (mm), air temperature (°C), specific humidity (kg kg−1), and solar irradiance (W m−2), respectively. Normalized differene vegetation index (NDVI) is the growing season normalized difference vegetation index (as a proxy of crop growth) of the irrigated cropland. These factors are estimated using the China Meteorological Forcing Dataset (He and Yang 2016, He et al
2020), the third-generation NDVI product created by the Global Inventory Monitoring and Modeling System (NDVI3g) (https://ecocast.arc.nasa.gov/data/pub/gimms/3g.v1/), and the distribution and growth data of irrigated crops (Yin et al
2020) (supplementary, texts). Following García-Palacios et al (2018) and Wu et al (2020), we estimate the ratio between the parameter estimates of the predictor and the sum of all parameter estimates, as shown in equations (8)–(10), to quantify the relative effects of different driving factors on the WWI or WCI variations. Further, we tested the sensitivity of the relative effects to different time frames (i.e. 1982–2013, 1983–2013, ..., 1994–2013) by repeating the analysis using data starting in 1982–1994:
is the error term. P, T, H, R are the climatic variables representing the growing season precipitation (mm), air temperature (°C), specific humidity (kg kg−1), and solar irradiance (W m−2), respectively. Normalized differene vegetation index (NDVI) is the growing season normalized difference vegetation index (as a proxy of crop growth) of the irrigated cropland. These factors are estimated using the China Meteorological Forcing Dataset (He and Yang 2016, He et al
2020), the third-generation NDVI product created by the Global Inventory Monitoring and Modeling System (NDVI3g) (https://ecocast.arc.nasa.gov/data/pub/gimms/3g.v1/), and the distribution and growth data of irrigated crops (Yin et al
2020) (supplementary, texts). Following García-Palacios et al (2018) and Wu et al (2020), we estimate the ratio between the parameter estimates of the predictor and the sum of all parameter estimates, as shown in equations (8)–(10), to quantify the relative effects of different driving factors on the WWI or WCI variations. Further, we tested the sensitivity of the relative effects to different time frames (i.e. 1982–2013, 1983–2013, ..., 1994–2013) by repeating the analysis using data starting in 1982–1994:


where αi is the standardized regression coefficient of the ith variable shown in equation (7); and the subscripts CC, NDVI, and IE represent the relative effects of climatic factors, crop growth, and irrigation efficiency, respectively.
2.3.2. Isolating the contribution of IE improvements to irrigated area expansion
The expansion of irrigated areas is driven by many factors including the development of irrigation facilities, growth in food demand, and improvements of IE (Ward and Pulido-Velazquez 2008, Pfeiffer and Lin 2014, Perry 2017, Sese-Minguez et al 2017). Here, we focus on the impact of IE improvements on the irrigated area expansion to better understand the linkage between IE and IWC. To this end, a fixed-effects panel regression approach is used (Diffenbaugh and Burke 2019, Davenport et al 2021). A linear regression model (equation (11)) and two nonlinear regression models (equations (12) and (13)) are adopted to represent the relationship between IE and irrigated area and to account for model selection uncertainty:


where  and
and  represent the irrigated area and irrigation efficiency, respectively, in province t and year t;
  is the province fixed effects;
  is the time fixed effects; and
  is the error term. The province-time fixed effects subtract out interannual variations in the average irrigated area caused by many other unobservable time-invariant and time-varying factors such as the growth of irrigation infrastructures, government support, farmers' pursuit of economic returns, allowing us to isolate the effects of IE improvements. We first estimate the ensemble mean of the 'counterfactual' irrigated area that would have occurred without IE change based on the regression models and the detrended IE. Then, the contribution of IE improvements to the irrigation area expansion is quantified as the relative difference between the trends of the measured and 'counterfactual' irrigated areas (supplementary, texts and table S1).
3. Results
3.1. Trends of IWW and IWC
The turning points of the time-series IWW and IWC are detected as 2001 and 1999, respectively, by the Pettitt's test and accumulated anomaly algorithm (supplementary, table S2). Based on the turning points, we divide the entire study period (P3: 1982–2013) into two subperiods, i.e. P1: 1982–1999 and P2: 1999–2013. Figure 3 shows the trends of IWW, IWC and IE estimated using the linear regression model. IWW and IWC exhibit statistically significant increasing trends during P1, with values of 1.27 and 1.13 km3yr−1, respectively. However, the IWW and IWC trends are opposite during P2, i.e. IWW decreases significantly at a rate of −1.3 km3yr−1 (or −0.4% yr−1), while IWC increases at a rate of 2.9 km3 yr−1 (or 2.4% yr−1). IE presents a nonsignificant increasing trend during P1 but shows a significant upward trend (0.01 yr−1 or 2.4% yr−1) during P2.
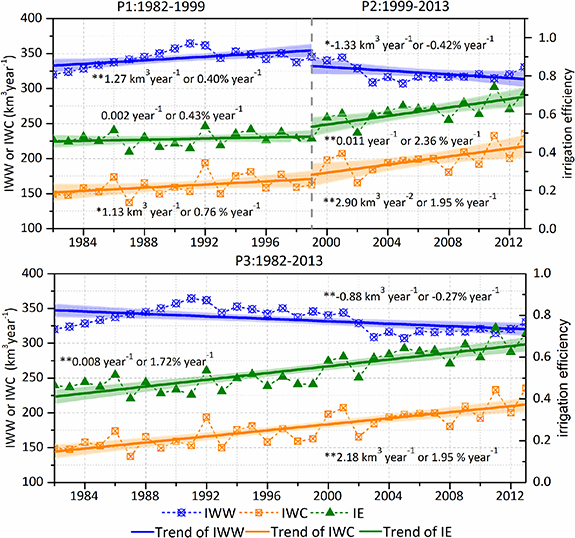
Figure 3. Variations of IWW, IWC and IE in mainland China along with their linear trends (solid lines, *P < 0.05, *P < 0.10) and 95% confidence intervals (shaded areas) during 1982–1999 (P1), 1999–2013 (P2), and 1982–2013 (P3).
Download figure:
Standard image High-resolution imageFor the agricultural zones (supplementary, texts), as shown in figure 4, both IWW and IWC show increasing trends in the Northeastern China Plain and Yunan–Guizhou Plateau during P1, P2 and P3. The variations of IWW and IWC in the northern arid and semiarid regions are similar to the entire mainland China. In the Huang-Huai-Hai Plain, IWW and IWC show upward trends during P1 but downward trends during P2, while the opposite is true in the middle-lower Yangtze Plain. In the Sichuan basin and surrounding regions, IWW consistently exhibits a decreasing trend, while IWC shows an upward trend. At the provincial scale, about 30% of the provinces have opposite trends in IWW and IWC during P1, while about 50% show opposite trends during P2 and P3, with IWW decreasing and IWC increasing in most cases. Over the period P3, the provinces with divergent trends of IWW and IWC are mainly located in eastern and northwestern China. The northeastern provinces show consistent upward trends in IWW and IWC during P1, P2, and P3.
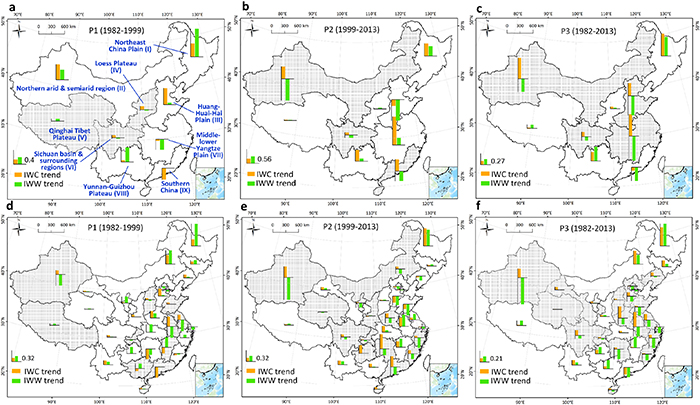
Figure 4. Trends of IWW and IWC in different agricultural zones (a)–(c) and provinces (d)–(f) of mainland China during 1982–1999 (P1), 1999–2013 (P2) and 1999–2013 (P3). Provinces or agricultural zones with gray background have opposite trends in IWW and IWC.
Download figure:
Standard image High-resolution image3.2. Driving factors of IWW and IWC
Figure 5 shows the effects of irrigated area and water-withdrawal/consumption intensity on changes in IWW and IWC, which were decomposed using the LMDI method (section 2.2). The irrigated area and WWI have opposite effects on the IWW change in mainland China. The irrigated area expansion induces an increase in IWW, while the reduced WWI causes a decrease in IWW. The irrigated area effect is higher than the WWI effect during P1 but the opposite is true during P2 and P3. Similar results can be seen in most agricultural zones, with the exceptions of the Northeastern China Plain (I) and Yunan–Guizhou Plateau (VII), where the irrigated area effect is greater than the WWI effect. Regarding the changes in IWC, the effect of irrigated area expansion is significantly higher than the WCI effect. The reduced WCI exhibits appreciable effects on the IWC change in the Huang-Huai-Hai Plain (III), Middle-lower Yangtze Plain (VII) and Yunnan-Guizhou Plateau (VIII). WCI exerts both negative and positive effects on the IWC change in different agricultural zones. At the provincial scale, the irrigated area expansion contributes positively to the increase in IWW and IWC in most cases (supplementary, figure S3). WWI poses negative effects on the IWW change while WCI exhibits both positive and negative effects on the IWC change.
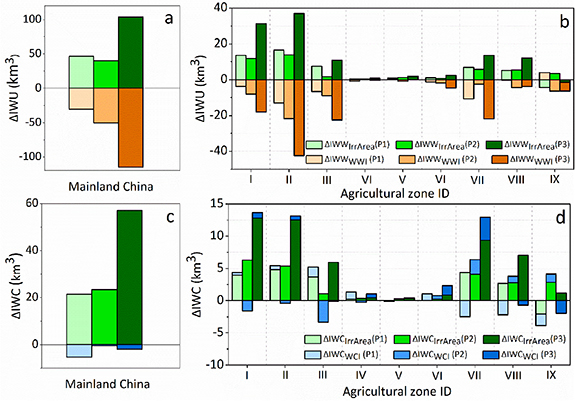
Figure 5. Driving factors of IWW and IWC in mainland China and the nine agricultural zones (see figure 4(a)) during 1982–1999 (P1), 1999–2013 (P2) and 1982–2013 (P3). Panels (a) and (b) show the irrigated area and WWI effects on IWW change (i.e. ΔIWWIrrArea and ΔIWWWWI), and panels (c) and (d) show the irrigated area and WCI effects on IWC change (i.e. ΔIWCIrrArea and ΔIWCWCI).
Download figure:
Standard image High-resolution image3.3. Impacts of climatic factors, crop growth and IE on water-withdrawal and consumption intensity
Figure 6 shows that IE, climatic factors, and crop growth (approximately represented by NDVI) are, on average, responsible for 38% (44%), 54% (46%), and 8% (10%) of the explained variance (>80%) in water-consumption (water-withdrawal) intensity across the 31 provinces of mainland China. The relative effects remain stable over the different time frames (figures 6(c) and (d)), indicating the results are robust to analysis using different data lengths. Precipitation shows a negative relationship with water-withdrawal and consumption intensity, while solar irradiance shows a positive relationship with them. Air temperature, humility and NDVI do not seem to have consistent relationships with water-withdrawal and consumption intensity (Nie et al 2020). In more than 90% of the provinces, IE is significantly and negatively correlated with WWI but positively correlated with water-consumption intensity. Higher IE can decrease WWI due to reduced return flow and soil water evaporation, but it can also increase WCI due to changes in planting structure or better satisfactions of crop water requirements (Batchelor et al 2014, Zhang et al 2020b). The IE effect on WCI might be partially captured by the satellite-based IWC data that incorporates NDVI, crop phenology and root depth information (Yin et al 2020).
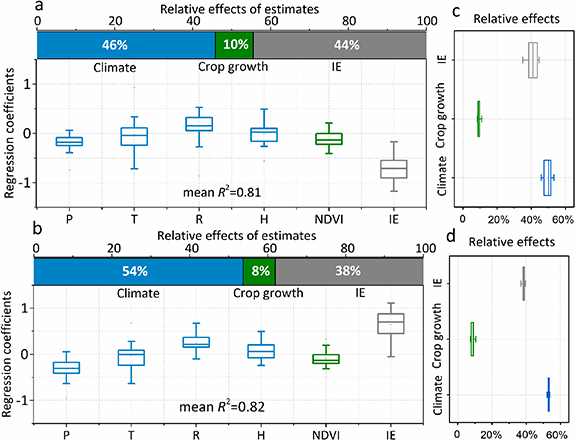
Figure 6. Relative effects of climatic factors, crop growth and IE on the WWI (a) and WCI (b). Panels (c) and (d) show the sensitivity of the relative effects to different time frames that started in the years ranging from 1982–1994. The climatic factors include precipitation (P), air temperature (T), solar irradiance (R), and specific humidity (H).
Download figure:
Standard image High-resolution image3.4. Contribution of IE improvements to irrigated area expansion
Removing the IE trend and estimating the 'counterfactual' irrigation area that would have occurred without IE trends allow us to isolate the contribution of IE improvements to the irrigation area expansion (supplementary, texts). The trend of the measured irrigated area is 6353 km2yr−1 (or 1.4% yr−1) in mainland China, while the trend of the 'counterfactual' irrigated area is 4942 km2yr−1 (or 1.1% yr−1) (figure 7). The contribution of the improved IE to the irrigated area expansion is estimated to be 22.2%, and it is more prominent in water-scarce regions (31.5%) than in water-abundant regions (19.7%). This is reasonable because in water-scarce regions (e.g. the Xinjiang province), land is relatively plentiful, but water resources are limited; the water-withdrawal savings obtained from higher IE are more likely to be used to expand irrigated areas than in water-abundant regions. Our results show a low sensitivity to model selection and are robust to the use of different regression models (supplementary, figure S4).
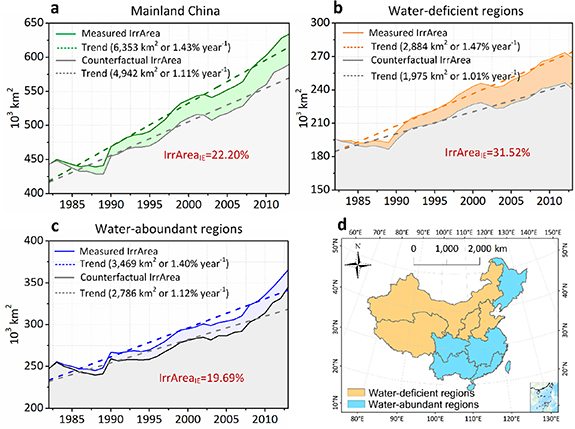
Figure 7. Trends of the measured and 'counterfactual' irrigated areas along with the contribution of IE improvements to the irrigated area expansion (i.e. IrrAreaIE). Panels (a), (b), and (c) show the results for the mainland China and for water-scarce and water-abundant regions (d), respectively. The 'counterfactual' irrigated area is the ensemble mean of the estimates of the linear, quadratic, and exponential regression models.
Download figure:
Standard image High-resolution image4. Discussion
4.1. Implications for water resource management
This study highlights the necessity of considering both IWW and IWC in designing and evaluating water policies because they include complementary information on irrigation water use and may exhibit divergent trends. If managers focus solely on IWW, it would be easy to mistakenly believe that as IWW decreases, water availability increases and therefore their water conservation measures are successful. Meanwhile, our findings show that climatic factors can explain a large of the variance (∼40%) in water-withdrawal and consumption intensity. Climate change may lead to greater irrigation water demands that can further exacerbate climate-induced water shortages and threaten ecological water security (Russo and Lall 2017, Nie et al 2020), thus requiring the attention of managers and policy makers.
Since irrigation is the largest global freshwater user (Hoekstra and Mekonnen 2012, Jägermeyr et al 2015), it is a widely-held belief that higher IE has great potential to conserve water and address water scarcity. However, a growing number of voices are questioning this viewpoint (Ward and Pulido-Velazquez 2008, Pfeiffer and Lin 2014), arguing that higher IE tends to increase water consumption, a phenomenon known as the paradox of IE (Grafton and Abadía 2018). This study shows that IWC increases significantly along with the improved IE from 1982 to 2013 in mainland China; and simultaneous increases in IE and IWC are observed in more than 80% of the provinces (figure 8). The improved IE makes a nonnegligible contribution (∼20%) to the irrigated area expansion. Meanwhile, in most provinces, the regression coefficients of IE to WCI are statistically positive and the explained variance in WCI by IE is greater than 25% (supplementary, figures S5 and S6), indicating that the improved IE has a strong positive effect on water-consumption intensity. The significant rise in IWC with increasing IE together with their strong positive linkages provide empirical evidence for the paradox of IE in mainland China.

Figure 8. Comparison of the trends in IWC and IE over the 31 provinces of mainland China (*P < 0.05) during the 1982–2013 period.
Download figure:
Standard image High-resolution image
The paradox of IE is an example of a Jevons' paradox rooted in the field of environmental economics (Sears et al 2018), and therefore it is currently explained mostly from a microeconomic perspective, assuming that farmers are rational economic agents with the goal of maximizing revenues. As shown in supplementary figure S7, modernization of irrigation systems can lead to lower production costs through reduced water, labor, and chemical inputs, as well as government subsidies for water-efficient irrigation. Lower costs combined with upgraded irrigation systems enable farmers to increase yields and economic returns through the extensification and intensification of irrigated crops. This is one possible mechanism behind the paradox of IE in mainland China, since the government plays a leading role in promoting water-conserving irrigation (Central Government of the People's Republic of China 2014). For example, the central and local governments subsidize almost all investments in water-saving irrigation in large and medium-sized irrigation districts (The State Concile Information Office of the People's Public of China 2014). Meanwhile, upgrades in irrigation systems (e.g. from flood to drip irrigation) may increase crop yields because of more reliable and flexible water supply and more efficient water distribution, which is associated with increases in crop water consumption (Perry 2017). This can also explain the paradox of irrigation efficiency, since water-saving irrigation measures were reported to increase grain yield by 10%–40% per mu in mainland China (The State Concile Information Office of the People's Public of China 2014). There are other possible mechanisms that may generate the paradox of IE (supplementary, figure S7), but given the various socioeconomic, climatic, hydrological, agronomic, policy and institutional influences, they are difficult to determine in our study and deserve further investigation in the future. Anyway, the paradox of IE is essentially a coupled socio-hydrology problem involving bidirectional human-water feedbacks (Sivapalan et al 2014). If our goal is to alleviate water crisis by improving IE, farmer's behaviors should be treated as an endogenous rather than exogenous factor when designing and implementing water conservation programs (Li et al 2021b); and meanwhile, it is necessary to impose strict limits on the extent of irrigated cropland or total IWW (Zhang et al 2019a).
4.2. Uncertainties, limitations and future perspectives
We acknowledge this study has some limitations and uncertainties. First, only one recently released IWC dataset was used in our study and we cannot evaluate the robustness of our results to the use of different IWC data. This is due to the fact that among the publicly available IWC datasets, only that of Yin et al (2020) has a long time frame and high spatial resolution and explicitly considers the expansion of irrigated area, and has been verified against the official statistics. Other available IWC datasets, including those of Zhuo et al (2016), Van Dijk et al (2018), and Huang et al (2018), have obvious deficiencies (supplementary, texts). We expect to address the limitation of IWC data in the future by developing new IWC products with higher resolution and accuracy using reliable satellite-based ET products and spatio-temporally continuous maps of irrigated cropland. Second, our study was limited to the 1982–2013 period due to the constraint of the IWW data. This may raise the question of whether our findings remain valid for the period beyond 2013. Recently, Han et al (2020) reported that IWW showed a downward trend while irrigated area exhibited an upward trend from 2013 to 2017 in China. We can infer that the decreasing IWW trend and increasing IWC trend would continue after 2013, suggesting the reliability of our findings over a longer time horizon. Lastly, shifts in irrigated crop mix may influence the IWW and IWC trends; however, this was not incorporated into our driving force analysis due to data limitations. We further examined the changes in China's cropping structure during 1982–2013 based on official statistics and remote sensing-based land use/cover products (supplementary, texts). As shown in supplementary figure S10, rice and paddy field show very slight variations in acreage (<2% of the average total planted area), unlikely affecting the trends of IWW and IWC. Regarding the non-rice crops, the acreage and proportion of corn and vegetables show notable increases, their growth rates are relatively small (<0.4% yr−1) compared to the average total planted area. Other non-rice crops, including wheat, oil crops, soybeans, tubers, and cotton, did not experience substantial changes during the study period. The crops can be both rain-fed and irrigated, but they are not distinguished in the statistics. It is therefore difficult to determine their impacts on the IWW and IWC trends, which may bring some uncertainties to our findings. Previous study indicated that crop structure shift is a relatively weak driver of changes in irrigation water demand in China (Zhang et al 2020a), but they did not distinguish between rainfed and irrigated crops and excluded some crops (e.g. vegetable) from their analysis. To quantitatively estimate the contribution of irrigated crop conversion to changes in IWW and IWC, it will be necessary to develop time-continuous data on irrigated crop types in the future by leveraging advances in both crop distribution and irrigated cropland products.
5. Conclusions
This study differentiated two important variables closely related to irrigation water use, i.e. IWW and IWC, and examined their trends and drivers over mainland China. IWW and IWC showed statistically significant increasing trends from 1982 to 1999, while they exhibited opposite trends from 1999 to 2013. IWW decreased at a rate of −1.3 km3yr−1 (or −0.4% yr−1), while IWC increased at a rate of 2.9 km3yr−1 (or 2.4% yr−1) during 1999–2013. The decrease in IWW was due to the reduced water-withdrawal intensity, while the increase in IWC was mainly due to the irrigated area expansion. The opposite trends in IWW and IWC are observed in about half of the provinces, mostly located in eastern and northwestern China.
Changes in climatic factors, IE and irrigated area, on average, accounts for 54% (46%), 38% (44%), and 8% (10%) of the explained variance in water-consumption (water-withdrawal) intensity across the 31 provinces of mainland China. Unsurprisingly, precipitation shows a negative relationship with the water-withdrawal and consumption intensity. IE is significantly and negatively correlated with the WWI but positively correlated with water-consumption intensity. The contribution of IE improvement to the irrigated area expansion is estimated to be 22% in mainland China and it is more prominent in water-scarce regions (32%) than in water-abundant regions (20%). Further analysis implies that the paradox of IE (i.e. higher IE tends to increase water consumption) has manifested in parts of mainland China. This study enhances the understanding of changes in irrigation water use and highlights the importance of considering both IWW and IWC changes as well as farmer's behavior adjustments in water resource management.
Acknowledgments
This study is supported by the National Natural Science Foundation of China (41901045), the Strategic Priority Research Program of Chinese Academy of Sciences (XDA20100104), and the Opening Research Foundation of Key Laboratory of Land Surface Process and Climate Change in Cold and Arid Regions, Chinese Academy of Sciences (LPCC2020004). We greatly appreciate Professor Feng Zhou, Professor Xiaoming Feng, and Dr Lichang Yin for their data supports.
Data availability statement
All data that support the findings of this study are included within the article (and any supplementary files).
Code availability
Code from this study can be accessed via https://github.com/HydroRS/IrrTrendChina.
Supplementary data (4.6 MB DOCX)