

Abstract
A growing number of researchers and stakeholders have started to address climate change from the bottom up: by devising scientific models, climate plans, low-carbon strategies and development policies with climate co-benefits. Little is known about the comparative characteristics of these interventions, including their relative efficacy, potentials and emissions reductions. A more systematic understanding is required to delineate the urban mitigation space and inform decision-making. Here, we utilize bibliometric methods and machine learning to meta-analyze 5635 urban case studies of climate change mitigation. We identify 867 studies that explicitly consider technological or policy instruments, and categorize these studies according to policy type, sector, abatement potential, and socio-technological composition to obtain a first heuristic of what is their pattern. Overall, we find 41 different urban solutions with an average GHG abatement potential ranging from 5.2% to 105%, most of them clustering in the building and transport sectors. More than three-fourth of the solutions are on demand side. Less than 10% of all studies were ex-post policy evaluations. Our results demonstrate that technology-oriented interventions in urban waste, transport and energy sectors have the highest marginal abatement potential, while system-wide interventions, e.g. urban form related measures have lower marginal abatement potential but wider scope. We also demonstrate that integrating measures across urban sectors realizes synergies in GHG emission reductions. Our results reveal a rich evidence of techno-policy choices that together enlarge the urban solutions space and augment actions currently considered in global assessments of climate mitigation.
Export citation and abstract BibTeX RIS

Original content from this work may be used under the terms of the Creative Commons Attribution 4.0 license. Any further distribution of this work must maintain attribution to the author(s) and the title of the work, journal citation and DOI.
1. Introduction: summary of evidence gap and research question

Download figure:
Standard image High-resolution imageThe role of urban areas in contributing to climate mitigation and adaptation, global sustainable development goals (SDG) and the New Urban Agenda (NUA) is undisputed (UN Habitat 2011, IPCC 2014, 2018, UN-United Nations 2015, 2016). In the last few decades, a growing number of cities and local governments have teamed-up to combat climate change from the bottom up: hundreds have developed and are implementing local climate action plans (UN Habitat 2015, Deetjen et al 2018, Reckien et al 2018, C40 Cities 2019, WRI 2019). Yet, the contribution of urban climate solutions to climate change mitigation remains poorly understood: we still have very little understanding of how well urban policy interventions work, under what conditions and why (Grubler et al 2012, Revi et al 2014, Seto et al 2014, Rosenzweig et al 2015, Minx et al 2017, Bai et al 2018). The urban climate change literature is paved with individual case studies challenging our ability to maintain an oversight of new developments (Lamb et al 2019). Case-study evidence is used primarily in an anecdotal fashion leaving a large, untapped potential for systematic learning on urban climate solutions. There are at least two paths to upscale and systematize the study of urban-scale climate solutions (Creutzig et al 2019). One is data driven starting with city-scale datasets being combined with harmonized remote sensing or other land-use information to develop data-based typologies of cities and climate change (e.g. Creutzig et al 2015, Baiocchi et al 2015, Ahmed et al 2019, Nangini et al 2019, Solecki et al 2015). The other is evidence-driven synthesis starting with case studies to systematically compare and aggregate policy insights (Broto and Bulkeley 2013, Kivimaa et al 2015, Reckien et al 2018). Both can be eventually combined to match experience from case studies to urban drivers of energy use and climate change (Lamb et al 2019, Creutzig et al 2019).
What useful information can one derive from urban case studies? A systematic scoping of these studies can reveal a spectrum of urban solutions available to policy makers—instruments, targeted sectors, expected (or documented) mitigation potentials, and social outcomes. This information could support fast learning among peer-cities particularly those responsible for large segments of global greenhouse gas (GHG) emissions (Creutzig et al 2015, Baiocchi et al 2015, Lamb et al 2018). In particular, there is a pressing need to identify solutions for smaller and medium sized cities, that too in developing countries. These cities will host the majority of future population growth, energy consumption and GHG emissions yet are most underequipped in financial and human resources to study and implement local climate action (GEA 2012, Seto et al 2014, Sethi and Puppim de Oliveira 2015).
A growing number of studies model climate mitigation potential in cities. Emission inventory exercises identify key priority areas for urban mitigation across multiple sectors—particularly when carried out in a comparative context (e.g. ICLEI 2009, Kennedy et al 2009, Chavez and Ramaswami 2013). For mid- and large- n samples of city inventories, parametric and non-parametric statistical approaches explain variations in urban CO2/GHG emissions due to socio-demographics, industrial structure, urban form, local geography and climatic conditions (Brown et al 2008, Glaeser and Kahn 2010, Minx et al 2013, Baiocchi et al 2015). Further refining such analysis, Creutzig et al (2015) use hierarchical regression-tree to endogenously cluster cities according to their GHG emission drivers and to estimate a global urban mitigation wedge. These studies are assimilative explorations into key drivers and thus potential areas to focus mitigation initiatives on, but they do not identify city-specific policy options that are directly available to urban policymakers.
Other studies have studied the ambition, focus, and regional distribution of urban climate actions (Broto and Bulkeley 2013, Reckien et al 2014, 2018). Yet, these studies abstract away from specific options and fall short of evaluating actual policy performance. As such, policy learning remains limited and insights are not actionable. This contrasts with a wealth of urban mitigation case studies available in the scientific literature (Lamb et al 2019) that offers the opportunity to systematically review this more granular evidence base and learn from experiences in pursuing technological solutions and urban policy instruments. We acknowledge the difficulties of such an undertaking, with inherent inconsistencies in methods, system boundaries, available data and desired outputs (Seto et al 2014, Sethi 2017). Yet, in the absence of comprehensive and consistent evidence, working towards an initial heuristic for the urban climate solution space is a justifiable goal.
In this research, we apply a systematic scoping review methodology. A scoping review is guided by principles of transparency and reproducibility that follow a clear methodological protocol to analyse quantitative, qualitative or mixed evidence found in the scientific literature (Arksey and O'Malley 2005). As in other systematic evidence-synthesis approaches, it involves the following steps: (a) clearly defining the research question; (b) systematically searching defined literature databases for a defined time period; (c) justifying and making a transparent selection of the literature; (d) assessing the quality of the selected evidence; and (e) synthesizing the evidence based on a clear and transparent method (Berrang-Ford et al 2015, Minx et al 2017). In this scoping review, we assess the urban case study literature pursuing four distinct, but inter-related research objectives: (1) to map global urban interventions, capturing the contributions across different mitigation sub-sectors, (2) to survey key urban mitigation solutions being practiced along with their GHG abatement potential, (3) to examine ex-post policy studies for specificity of opted policies and their governing mode, and (4) to capture trends and focus of the latest research and innovations in urban climate mitigation. In section 2, we outline our review methodology, and in section 3 we describe analytical findings. In section 4, we conclude with recommendations for future research.
2. Methodology
Climate change assessments, such as those by the Intergovernmental Panel on Climate Change (IPCC), gained status for evidence-based scientific policy advice. The progress in international climate governance would have not been possible without systematic learning in the scientific community. However, there has been little systematic learning on climate solutions from ex-post evidence. Systematic review methods as developed in health and educational sciences provide an adequate methodological toolkit for such learning, but have generally been neglected in climate and energy research. Only recently, a growing number of researchers have started applying systematic review methods in climate studies more widely (Berrang-Ford et al 2015, Fuss et al 2018, Minx et al 2018, Nemet et al 2018). Such systematic reviews are challenging in that they deal with the vast and fast-growing evidence base. We call this new phenomenon 'big literature': resource-intensive systematic review methods are pushed to the brinks of feasibility (Minx et al 2017). Employing data science methods to assist during the systematic review process by lifting the burden of some of the most repetitive and resource-intensive tasks from human reviewers is a promising and crucial development in the field of evidence synthesis (Minx et al 2017, Westgate et al 2018, Nakagawa et al 2019).
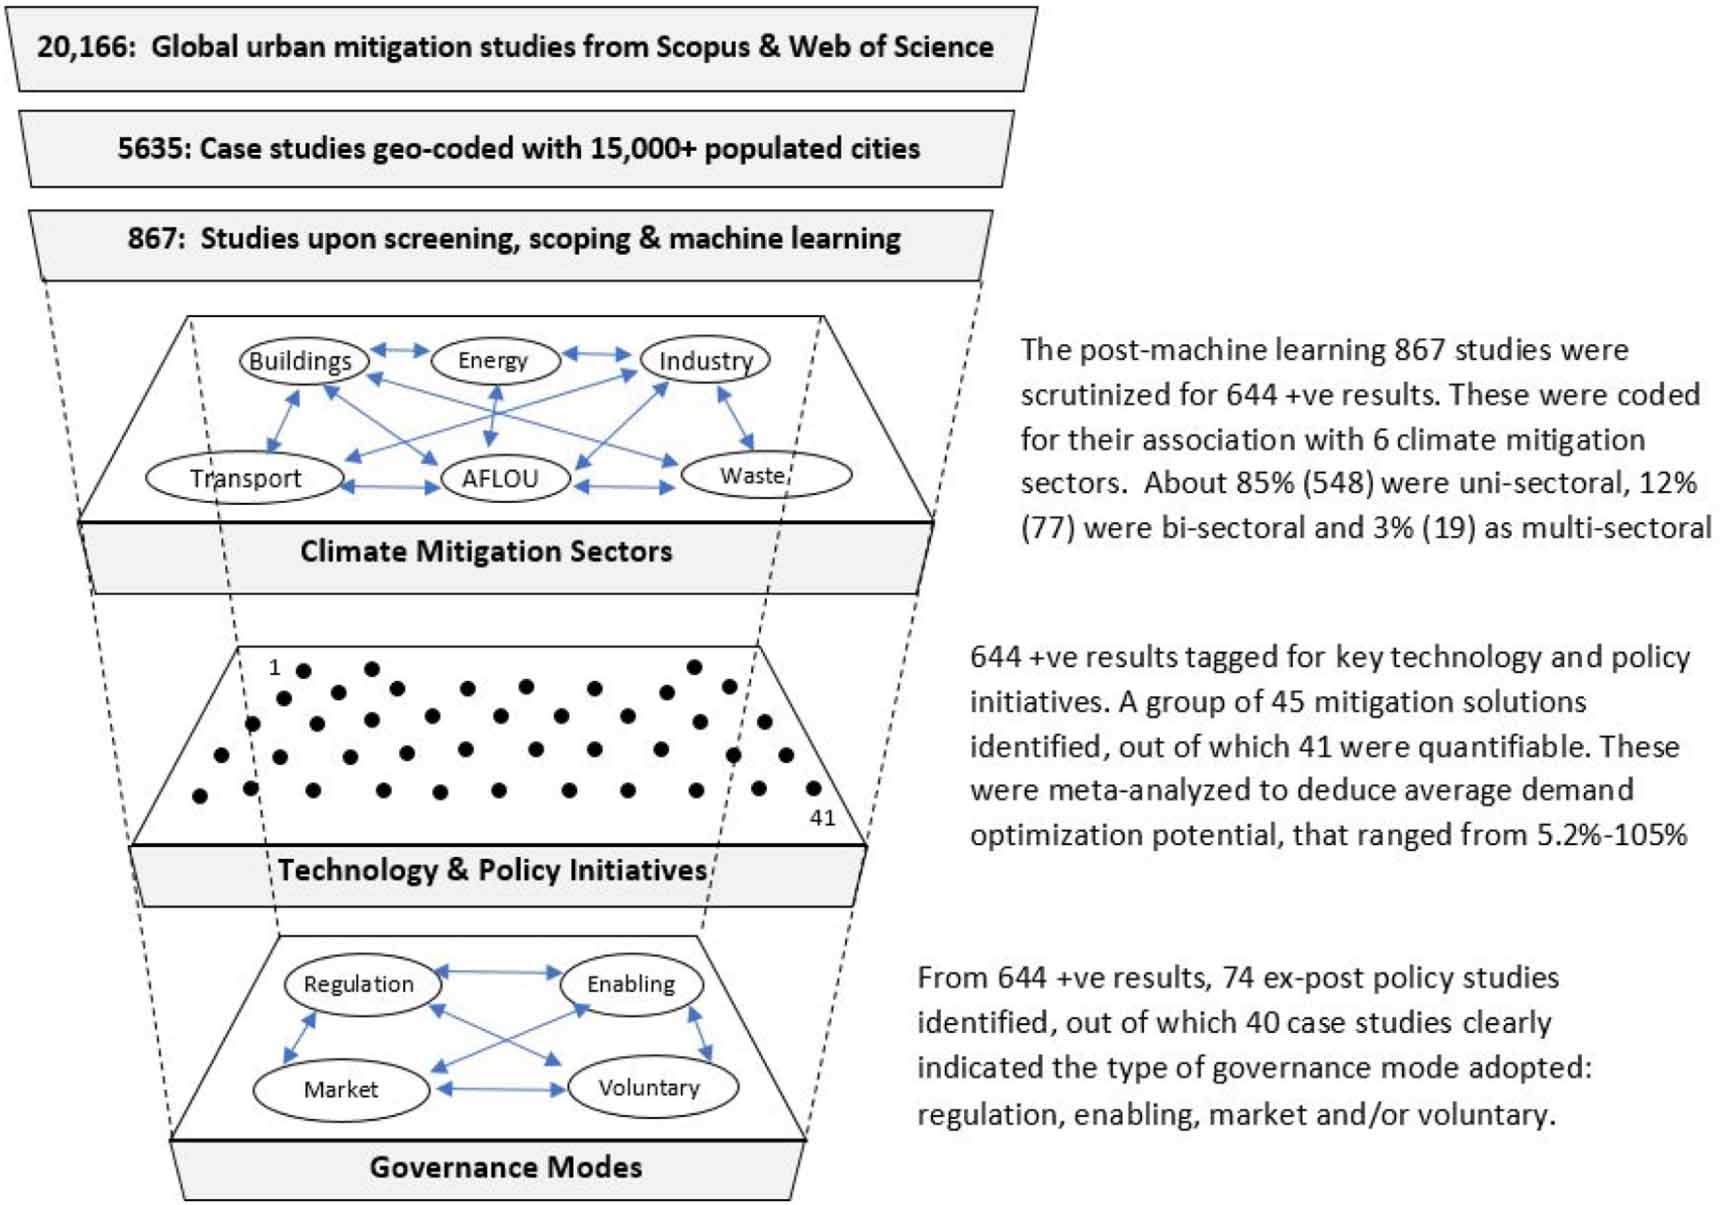
In a recent experiment, Lamb et al (2019) apply data science and unsupervised machine learning (ML) methods to automatically map out the case study landscape on urban climate change mitigation. Rather than dozens or hundreds of case studies as analysed by urban climate change assessments (Seto et al 2014), it identifies more than 4000 cases, covering a broad range of topics from emission accounting to technology studies to scenario analysis to policy impact evaluations. We update this with an expanded database of 20 166 studies for our systematic review of technology and policy options in urban climate change mitigation. The detailed methodology for the review process is explained in annex 1 (available online at stacks.iop.org/ERL/15/094067/mmedia) and summarized as a flowchart in figure 1. As a first step, we search the Web of Science and Scopus with a broad query comprising synonyms for climate mitigation and urban policies (annex 1.1, table A1). We filter the resulting documents using a data bank of worldwide city names, resulting into 5635 case studies that mention cities in their title and abstracts. Next, we read a random sample of 250 papers to develop inclusion and exclusion criteria for our scoping review (annex 1.2, table A2). With the developed exclusion and inclusion criteria we then tested inclusion/exclusion for a further set of 200 papers (annex 1.2, table A3). We then used the coded papers as input for a supervised machine learning algorithm that calculates relevance rates for the remaining 5635 case studies. For the final review, we include all studies with a relevance rate of 0.6 or higher, resulting in 867 papers (annex 1.3). In the final stage, post-ML analysis and synthesis involves systematic coding and tagging of the content (annex 1.4) finding that 644 out of the 867 studies matched our inclusion criteria followed by an array of results. Section 3 reports our analytical findings sequentially for each research objective.

Figure 1. The research methodology, scoping of case studies (in numbers) and results reporting for each objective.
Download figure:
Standard image High-resolution image3. Results discussion
The systematic review of case study literature leads to the following major outcomes: (3.1) Mapping of urban interventions globally, capturing the contribution of different mitigation sectors; (3.2) Exploring key urban mitigation solutions being practiced along with their GHG abatement potential; (3.3) Examining ex-post policy studies for specificity of policy mode opted in different urban mitigation solutions; (3.4) Identifying the focus of recent trends and innovations in urban climate mitigation.
3.1. Mapping of literature for GHG mitigation sectors
We map case study articles to the following sectors: buildings, energy, transport, waste; agriculture, forestry and other land uses (AFOLU) and industry. In the paper set, we find 548 studies focusing on a single sector, with buildings (249) and transport (148) most frequently investigated. There are 77 studies scrutinizing two sectors simulteneously, most often building and energy (21). A total of 19 studies cover 3 or more sectors (figure 1, details in annex 2). Visualizing the intensity pattern of sectoral-interactions using a chord diagram (figure 2- left) reveals a notable paucity of evidence observed between buildings–waste, industry- AFOLU/land, industry-waste and transport-industry sectors. Systematic reviews can be prone to inaccuracy in reporting if left unchecked for consistency of results. We hence hand-checked the relevance of post-ML results and validated these against the tested precision level (annex 3).

Figure 2. Distribution of urban climate solutions- all (left) & ex-post policy (right), across different sectors. Source: Authors. The graphic demonstrates that volume and cross-connectivity between sectors for ex-post policy studies is significantly less in proportion to the entire urban climate solutions literature.
Download figure:
Standard image High-resolution image3.2. Key urban mitigation solutions and their mitigation potential
An in-depth analysis of 644 studies reveals several urban mitigation solutions evident across the six GHG mitigation sectors (figure 1). The most frequently identified interventions are demand-side management solutions that includes peak shaving or shifting (65 evidences), followed by energy efficiency (EE) measures (52), retrofitting a building completely (43), installing solar PV and PVT (43), integrated planning (41), fuel or technology shift (33), car free city (33), electric mobility (31), travel demand management (TDM) measures (26), biomass, bio-diesel, biomass gasification, ethanol production (26), waste to energy solutions (25), thermal insulation (23), public transport (22), urban form, design and planning (21), cool roofs (19), life-cycle assessments (19) and transit oriented development (18). Intrestingly, relatively ordinary, inexpensive and low-tech solutions e.g. water system efficiencies (12), mixed landuse (9), composting (7), walkability (5), non-motorised transport (4), greening/afforestation (4), parking management (3), and urban agriculture (2) find little evidence in case study literature.
Only 88 case studies across 46 solution typolgies provide quantitative data to estimate GHG abatement potential. Some cities like Vancouver, New York, Toronto, San Fransciso, London, Barcelona, Turin, Beijing, Tokyo, etc provide multiple studies in urban mitigation. These report results either as GHG mitigation, energy reduction or cost savings (essentially GHG abatement potential), all in percentage-points and ennumerated in annex 4. This enables us to evaluate relative opportunities offerred by these solutions. Out of 46 urban mitigation solutions, quantifiable data was available for only 41. We rank demand-side potential for climate change mitigation (figure 3), benchmarked against business-as-usual scenario (BAU) as defined in each individual study. Different studies can have a range of baselines and end-points for reporting percentage GHG reductions (Erickson and Broekhoff 2017). In this analysis, we consider studies with baseline ranging from 1979 to 2019 and report results on the basis of project vs non-project percentage variation, drawing inter-sectoral comparisons as has been the method in the recent AR5 (IPCC 2014, p 92). Several variables contextualize the results:
- (a)Geographical origin: Many studies originated in Europe and China (annex 5). The most notable heterogeneity is evident in cool-roof performance because of location. Cool roofs are less often deployed in higher latitudes (13%) and more frequently in lower latitudes (28%). Other climate policies are deployed similarly across geographic regions.
- (b)Sector contributions: On an average, the highest mitigation values are observed in three chief sectors: buildings with net-zero emission buildings (NZEB) 105% (Wilkinson and Boehm 2005), transportation with E-mobility 94% (Van Duin, et al 2013, Prata et al 2015) & Waste with waste to energy 87% (Mustafa et al 2013). While a combination of certain sectors may give relatively moderate to low GHG abatement, in certain urban contexts these can potentially offer low-hanging fruits for decision makers and local bodies to deliberate on, especially if the scope and scale are controlled (explained below #5).
- (c)Heterogeneity within an urban solution: The 41 urban solutions are categorized based on their techno-policy distinctiveness to be implemented as practical solutions within an urban setting. A particular solution could invariably include multiple sub-variants of technology. For example, 'electric mobility' includes studies examining full replacement of cars by e-bikes, replacement of individual conventional cars with light duty electric vehicles (EVs), and adoption of EVs in freight—all of which are different in terms of technology and their efficacy. To reflect policy relevance, we have segregated their use in public and private modes. For details see annex 4.
- (d)Technological and social initiatives: Technology based interventions are more prevalent. Out of 41 urban climate solutions, 33 (80.5%) are technologically driven, 3 (7.31%) are society oriented and the remaining 5 interventions are technological and social. More than two thirds of solutions are on the demand-side, and less than one third on the supply side (figure 3).
- (e)Scope (system boundaries) & Scalar effect: The scale of intervention controls mitigation potential at two levels. The first is at the systems level- with all things being equal, interventions with smaller absolute scope demonstrate greater marginal mitigation potential than more system-wide interventions. For instance, NZEB (105%) against retrofitting a precinct (50%) or sustainable urban form (23%) in the city. Similarly, waste to energy in a plant (87%) against integrated waste management (58%) in the city, or mitigation opportunities in public transportation system (51%) against complete TDM (27%) in the city. This information is crucial for local authorities and stakeholders to initiate policy action with small-scale manageable projects having high marginal impact, while simultaneously pursuing more system-wide approaches.

Figure 3. Rank Diagram of average GHG abatement potential from BAU (in %) and categorization into technological and social-oriented solutions, and demand vs supply categories.
Download figure:
Standard image High-resolution imageA further disaggregation of sectors for quantifiable solutions, in decreasing order of their average mitigation potential, indicates the following-
Waste (50%): The GHG abatement potential of 5 climate solutions in waste sector range from biomass, biomass gasification (21%) to waste to energy (87%) in project versus non-project scenario. The surge in climate mitigation potential with rising up the technology ladder are evident. On an average, the waste sector offers the maximum demand side GHG mitigation potential in cities with the most concentrated yet least number of measures, thus offering a low-hanging fruit to urban local bodies.
Transport (43%): The mitigation potential of 8 climate solutions in energy sector range from intelligent transportation system (ITS) (20%) to EV and hybrid EV (HEV) in public & private vehicles (94%), with the average being 43%. The results indicate that GHG savings from travel demand management, fuel shift and ITS plateau at 28%, beyond which deep mitigation can be attained only through pan-city expansion of public transportation system, particularly by introducing EV/HEVs. Most of these interventions are supply-driven and controlled by urban transport authorities and local governments.
Energy (38%): The mitigation potential of 14 climate solutions in energy sector range from expanding district heating/cooling (12%) to PV thermal and solar tri-generation (CPVT) solution (73%), with the average being 38%. The energy sector demonstrates a range of solutions, a lot of which are associated with the supply-side than in any other sector. These are district heating/cooling, PV thermal, solar tri-generation CPVT, etc though few demand side energy measure to reduce GHGs are also observed, like EE & conservation measures, consumer demand response models, optimization models in modulating energy consumption at local (community) level, in water systems, heat pumps, street-lighting optimizing energy demand with solar substitution and/or energy storage, demand adjustment for district heating, etc.
Buildings (35%): The relative mitigation potential of 13 climate solutions in building sector ranges from cool roof/facade, roof garden in higher latitudes (13%) to NZEB, carbon neutral building (105%), averaging 35% with all other variables being the same. Excluding NZEB, the mitigation potential in this subsector limits at 50% with building retrofit. The double savings in NZEB against retrofit signifies substantial untapped mitigation potential in creating new infrastructure or redeveloping old precincts to NZEB district than pursuing incremental retrofits.
Conventional insulation and thermal comfort solutions incorporated into the building during construction are twice more effective in reducing energy demand than operational/performance measures like automated building information system (BIS), intelligent controls, smart meters, etc or user driven EE measures. At the same time, urban bodies need to utilize these results with prudence. They should keep in view that the gross mitigation potential of NZEB versus retrofits would depend on multiple local factors, for instance (a) the relative prevalence of new buildings vs. old building stock; (b) how you locally define or interpret 'retrofitting'; and (c) relative cost-effectiveness of each solution, amongst others.
AFOLU (5.2%): There is only one urban solution- afforestation/greening with a mitigation potential of around 5%.
3.3. Review of ex-post policy studies
One of the key aims of this research is to examine ex-post policy studies for specificity of policy-governance instruments opted in different urban mitigation solutions. Firstly, only 73 (8.5%) out of 867 cases are ex-post policy studies, the most abundant in the buildings sector (26), followed by transport (16), energy (7), waste (5) and AFOLU/land (2). As the chord diagram of these evidences show (figure 2- right), there are few cases observed in the nexus of buildings-energy (5), buildings and AFOLU/land (4), transport and AFOLU/land (2) while only seven urban solutions span through multiple sectors. The results suggest that the industry and waste sectors are most isolated and need integration with the rest of urban functions through innovations and policy convergence, to accrue greater GHG mitigation and climate co-benefits. Upon tagging these cases in accordance to four normative policy-governance modes, including overlapping (annex 6), we find that most of the urban solutions conform to enabling measures (46), regulatory instruments (45), voluntary, behavioural, awareness & education measures (37), followed by market/economic interventions (35). The following key observations emerge:
- (a)There is a pre-occupancy of regulatory instruments that rely on legislations, standards/codes, certifications, etc across almost all GHG mitigation sectors, frequently observed in buildings and transport sector.
- (b)Enabling and voluntary measures are not at all observed in waste sector, substantiating its isolation in urban GHG mitigation.
- (c)There are only two evidences where all policy instruments are simultaneously employed in urban climate solutions. The case of Toronto highlights a mix-methods approach combining infrastructure provision, public acceptance, industry participation, regulating gasoline prices, tax incentives, subsidies for expanding EVs (Ing 2011). Also, local authorities like Leicester demonstrate different stakeholders can use multiple benefits approach with energy savings, job creation and community engagement to proactively meet national carbon reduction targets (Lemon et al 2015).
Surprisingly, initiatives such as car free cities, Fridays for future, odd–even car days, and congestion charges that capture active public interest, participation and media attention are missing in peer-reviewed scientific literature that we sampled. That contrasts with the high potential of transport-related lifestyle solutions to reduce individual carbon footprints (Ivanova et al 2020). A key reason might be that many urban-scale transport policies are primarily motivated by local concerns, such as congestion, air pollution, and quality of life, and thus may not occur in our literature data base. Secondly, policies need to be evaluated in terms of their relative effectiveness. For instance, in building projects, total renovation may not be optimal in all cases, while zero-cost measures like information campaigns could produce significant performance improvement (Pombo et al 2019, Calero et al 2018). Similarly, a better knowledge & propagation of energy codes, especially during early planning stage can have positive implications (Andrews et al 2016). Other effective intervention in the building sector include cap and trade for building energy emissions on lines of Tokyo (Nishida et al 2016), provision of incentives & subsidies, sustainable business models, focusing on thermal envelope system (than merely lighting); capacity building efforts and education campaigns, using of land-use planning and development approvals to expand green building market (Hou et al 2016, Mellross and Fraser 2012).
For urban energy solutions, supply-side policies can be more effective if accompanied by participatory measures, as in Leicester, UK that simultaneously created jobs and engage communities in demand optimization (Lemon et al 2015). While technological solutions like solar PV accrue 30% cost savings (VanGeet et al 2008), yet complementary smart tariffication measures provide monetary incentives to households and motivate them to change their energy habits too (Kendel and Lazaric 2015). This certainly necessitates a greater role for enabling and voluntary modes of governance in supporting regulatory measures in urban mitigation.
Ex-post policies in the transportation sector further validate that demand-side interventions are indispensable for urban climate mitigation. For e.g. despite provisioning EV fleet in public transport in Jinhua, there is still an energy saving potential of 6.21% by optimizing departure time interval in line 1, with the same level of service (Wang et al 2017). Area traffic and parking restrictions with fuel taxation have substantial benefits in Athens (Goulas et al 2001), despite prevailing supply-side fuel efficiency norms. For significant outcomes, municipal plans should provide facilities that encourage increased use of transportation alternatives (walking, cycling, transit, etc.), that promote efficient vehicles and fuels (City of Vancouver 2005), enable enhanced involvement of people towards sustainable travel behaviour change as evident through holding the Big Green Commuter Challenge in Portsmouth City (Wall et al 2017), greater public transit use as in the case of Halifax, Moncton and Saint John in Canada (Gordon 2004), and adoption of smart parking system in London (Peng et al 2017b).
Ex-post policy evaluation in AFOLU/land demonstrates that expanding of park area was the most appropriate initiative when considering both its effectiveness in reducing emissions, and its implementation cost in Bangkok (Kiewchaum et al 2017). In case of waste sector, different local conditions and waste composition were known to influence the choice of solution- landfill, incineration and composting (Assamoi and Lawryshyn 2012, Hutton et al 2013). Urban mitigation across multiple sectors is scarce and spans across buildings, energy & transport. It involves technologies used for demand-side management that include natural-gas-based residential and commercial building heat pumps and chillers, cooking and water heating appliances developed for restaurant applications, and automobiles, buses, and trucks that use natural gas instead of gasoline (Wang et al 1995). These predominantly hinge on fuel-shift based rapid efforts or building-retrofit related sustained efforts, yet with significant health impacts (Tuomisto et al 2015).
In addition to the above cited evidence, there are certain plausible cross-cutting mitigation interventions viz. (a) Municipal waste-industry: demonstration of circular economy, biogas digestion, biomethanation & CO2e certificates, (b) AFOLU/land and waste: landfill site restoration to expand green cover and GHG mitigation, (c) Energy-transport: Instruments for bulk-purchase of green energy by transport companies, (d) Building-energy: Power purchase agreements between renewable energy plants, regional power grid, local electricity distribution companies on one end and townships, special zones, municipal councils, residential communities including prosumers on the other, and last but not the least (e) Ecocity/smart city developments: Integrated planned solutions encompassing solar PV, building EE measures, E-mobility, WTE and/or other combinations of the above interventions.
3.4. Recent trends, focus and innovations in urban mitigation
The past few years have witnessed advances in models, technologies and policies for climate urban mitigation, spanning all major GHG sectors except industry and AFOLU/land (table 1). Innovations advanced in the building sector (real time BIS, smart controls, roof-integrated solar technologies, efficient cooling & heating), albeit there is little evidence in their policy application. There is considerable use of technology in urban energy through heat pumps, solar PV, energy storage solutions, biomass gasification and energy-recovery demonstrator in district-heating. Meanwhile, policy innovations utilize community energy plans for utility-scale wind turbines, hybrid renewables and measures to re-evaluate national and local energy-efficiency design standards. There is fair mix of research, technological solutions and policy application evident in the transportation too. Complex computational models are built into apps, storage devices, breaking energy, and hybrid-fuel platforms supported by policy studies that optimize travel demand, improve street design, and strategize integrated and low-carbon transport planning. Other than EV/HEV, most of these measures enable incremental changes with no significant breakthrough from the status quo. The urban waste sector is well posited with research on life cycle assessment (LCA) of waste materials, analyzing optimal mix of different treatment and disposal technologies as well WTE applications. In addition, cross-sectoral interventions are experimenting with modelling & technologies in building-energy sectors (smart cities, green districts), land-transport related emissions as well as mechanisms to integrate climate goals with city master plans and setting up of demonstration projects. However, the cross-sectoral projects are few and need up-scaling to include non-contributing sectors. Also, policy innovations in unique sectors require expansion to apply models and technologies showing positive results for GHG mitigation.
Table 1. Recent research in urban innovative models, technologies & policy solutions. For abbreviations, see notes at the bottom.
| Research oriented (Model/Tool, Impact Studies) | Technology centric | Policy oriented | |
|---|---|---|---|
| Buildings |
|
|
|
| Energy |
|
| |
| Industry |
|
||
| Transport |
|
| |
| AFOLU/Land |
| ||
| Waste |
|
|
|
| Integrated |
|
|
|
Notes: CO2: Carbon dioxide, DH: District heating, EV: Electric vehicles, GIS: Geographic information system, ITS: Intelligent transportation system, LU: landuse, RE: Renewable energy, SWM: Solid waste management, WTE: Waste to energy. For detailed tabulation see annex 7
4. Conclusion and recommendations
4.1. Urban mitigation overwhelmingly presents demand-side solutions, yet it is still unsaturated
Out of 41 quantifiable urban solutions, 33 (80.5%) exhibit demand-side interventions. Our findings support the prevailing literature (Lamb et al 2018, Creutzig et al 2019) that topics like TDM, BEE, urban form, waste management dominate urban climate landscape, with irrefutably measureable evidence on the available mitigation choices and their relative efficacy. Our research pin-points technological and policy options and their GHG potential. For instance, most ex-post policy studies and current experiments are concentrated in the buildings and transport sectors, followed by energy and waste. The dearth of evidence in carbon sequestration initiatives indicates that (a) this topic is understudied in the urban literature, and/or that (b) cities designate insufficient importance to urban greening. However, most 'forward looking' studies (with futuristic scenarios) primarily deal with supply-side technologies in energy, CO2 emission accounting, transportation and air-pollution (Lamb et al 2018). Thus advancing research should focus more on unexplored demand optimizing technologies and policies in urban industries, land and other cross-sectoral activities.
4.2. In urban climate literature, mitigation options that are frequency studied are not necessarily those with highest potential
The study of how literature is organized is important but the first step in any systematic review process. An earlier study, Lamb et al (2018) uses frequency mapping, topical modelling, clustering and bibliographic coupling networks to check representation of topics across sectors, time and geographical space. Yet, the meta-analysis of empirical and quantifiable data from global case studies is imperative for an informed decision-making. Comparing the results of both highlights some vital differences in representation and efficacy of urban climate solutions worldwide (figure 4). This bears vital inputs to agencies like IPCC, IEA/OECD that are now heavily relying on methodical reviews of case study literature for Assessment Report (AR6), Global Energy Outlooks, etc that (a) urban climate literature is still inadequately represented by technological and policy interventions that can effectively reduce or offset GHGs, and (b) climate solutions less frequently investigated in urban case studies (such as EVs that are typically addressed at national level transport policy) may nonetheless help cities to effectively address the 1.5 °C climate challenge.

Figure 4. Comparison of key urban interventions for their marginal topic distribution results against their GHG abatement potential, in global case study literature. It is notable that solutions with high topical modelling (4.5%–9.7%) in literature like planning and governance, energy efficiency in buildings, travel demand management, urban form show a relatively lower demand-sensitivity (23%–27%) towards climate mitigation. Contrarily, solutions with lower topical representation (2.7%–4.4%) like integrated waste management, public transport, thermally insulated buildings, electric vehicles, transport provisioning show relatively higher climate mitigation potentials in the range of 47%–62%.
Download figure:
Standard image High-resolution image4.3. Technology coupling and synergistic interventions can upscale urban mitigation
Disruptive and synergetic technologies demonstrate that when it comes to GHG mitigation potential, the whole is greater than the sum of its parts (see figure 5). Out of 41 urban climate solutions, 33 (80.5%) are technologically driven, 3 (7.31%) are social oriented and the remaining 5 are both technology and social interventions. The results are in line with a previous study (Broto and Bulkeley 2013), wherein 76% of all experiments were technological, while only 50% were social innovation. The small proportion of social initiatives in our study partially reflect our exclusion of adaptation measures (Broto and Bulkeley 2013 observed that social innovations are more common in adaptation, carbon sequestration and urban form initiatives). Nevertheless, the significance of combining technological and social experiments to expand and upscale mitigation efforts in urban systems cannot be ruled out.

Figure 5. The resultant mitigation potential (in %) of combining two urban interventions is greater than the net sum of individual interventions. District heating/cooling expansion provides 12% mitigation potential and PV Solar technology yields 14%, their coupling has steeper mitigation cut (37%). Similarly, buildings energy efficiency measures (23%) and PV Solar (14%) in tandem yield 65% mitigation potential. In transportation, expanding of existing technologies in public transport (62%) & electric mobility in private vehicles (39%) if combined, multiply benefits to 94%.
Download figure:
Standard image High-resolution image
4.4. Expanding extra-regulatory and non-governmental actions is imperative in local climate governance
Technology is necessary but not a sufficient element to deepen urban mitigation. The overview of policy-governance measures corroborates an active role of local governments in leading urban climate solutions, through regulations (60.8%) or through partnerships between private or non-governmental actors (62%). A comparison with Broto and Bulkeley (Broto and Bulkeley 2013) shows that there is a slight shift observed in these last few years, when local governments' self-regulatory actions (66%) significantly outscored enabling measures (47%). This highlights an expanding form of horizontal partnerships by city governments with local agencies during 2013–19. The review of ex-post studies underscores that a mix of market mechanisms, user incentives, subsidies, voluntary measures, etc in cooperation with non-governmental actors is crucial for local climate mitigation.
Our scoping review is limited in certain ways. For example, it encounters a lot of heterogeneity and variabilities in cases. The unavailability of consistent data makes it hard to account for costs of mitigation options. We expect costs to vary with situations, depending on availability and price of the concerned resources & technologies, their in-direct costs, socio-economic costs, trade-offs, etc. The above nuances need further exploration through a full-systematic review and ought to be reasonably assessed while applying results to develop concerted urban policies and projects in different country & local contexts. Nevertheless, the research findings bear significant implication in analysing the efficacy of diverse demand-side climate solutions that will have a special reporting in the next IPCC report (AR6). In addition, the following insights or takeaways would help evolve a scientific and evidence based sustainable urbanism envisioned under the global SDGs & NUA, particularly for societies with rapidly developing infrastructures:
- (a)Epistemological: Urban climate research requires a fusion of disciplinary knowledge in order to better utilize quantitative and qualitative data on how cities could respond to global warming. This investigation demonstrates how systematic learning from ongoing research and ex-post studies is still underutilized. With growing urban data collection across the globe (for more see Creutzig et al 2019), our study further affirms the significance of investing and learning through systematic review of case study and ex-post evidence by exploiting big literature and machine learning.
- (b)Innovating technologies: Equipped with the above theoretical advances, urban innovation labs need to focus towards fostering ideas and technologies that not only enhance EE, fuel shift, etc (incremental solutions), in addition to innovating decarbonisation solutions exhibiting high effectiveness (like NZEB, EV, TDM) fully recognizing the obvious and the most infrequent linkages in urban systems. This aligns with the resilient urban systems discourse where all interventions (incremental, transitional and transformational) are considered equally applicable (Pearson et al 2014, Chelleri et al 2015, Meerow et al 2016). Our research underscores that energy-transport (e-mobility by prosumers and energy savings from breaking), transport-waste (route planning etc.), industry-waste (waste minimization, recycling), industry-AFOLU (mandatory sequestration, cap & trade, carbon capture) are inter-linkages that future innovations and research funding should explore.
- (c)Policy design: Our review demonstrates significant GHG mitigation from cross-sectoral policy initiatives. For example, projects generating rooftop solar energy for consumption in green homes as well as both public and private EVs (Sugar and Kennedy 2012, Litjens et al 2018). Similarly, integrated waste management demonstrates both GHG mitigation from households and industries, as well as lowered local air-pollution at the city scale (Liamsanguan and Gheewala 2008). Urban strategies need to develop NZEB and retrofits in mix-land use districts where non-motorised mobility can generate multiple benefits of climate mitigation, ordered urban-planning, improved local environment and jobs. The good news is that most of these portfolios are a mandate of urban local governments. The mainstreaming of climate change into national policies (UN Habitat and UNESCAP 2018), particularly national-urban frameworks (Sethi and de Oliveira 2018) present a good opportunity for systematic analysis of sustainability and local development issues in developing context. It can guide urban agencies for the necessary capacity building, financial support, performance targets, peer-competition and opportunities to be seen as acting decisively on environmental challenges.
- (d)Societal applications: Soft infrastructures, such as habits and norms, shape behavior and consequently offer potential to reduce energy demand and GHGs (Hammer et al 2011, Boyd and Juhola 2015, Creutzig et al 2016). Global energy optimization models show that advanced technologies, behavioural changes and shared socioeconomic pathways, enable rapid and deep decarbonisation to limit global warming to below 2 °C whilst at the same time reducing reliance on negative emissions technologies (NETs) by up to ∼18% compared standard set of technologies (Riahi et al 2017, Napp et al 2019). Grubler et al (2018) find that low-energy demand scenarios can further obliviate NETs within the 1.5 °C target. Our research demonstrates that multi-pronged policy solutions like incentives, subsidies, voluntary and behavioural measures, conscious choice of selecting low-energy consumption solutions and greener lifestyles like purchasing e-vehicles, travelling by public transport, garden composting, EE measures at home and office can play a pivotal role at urban scale supporting the realization of such scenarios. Cities can thus make socio-technical transitions required for climate stabilization.
Acknowledgments
The views presented by authors are independent without any influence or conflict of interest. The first author acknowledges the Alexander von Humboldt Foundation for the research fellowship. The internal review platform- APSIS scoping software is provisioned by Mercator Research Institute on Global Commons and Climate Change, Germany. Thanks is due to Max Callaghan for orientation to and troubleshooting in APSIS operations. Chord diagrams are prepared using open access tool on https://sites.google.com/site/e90e50fx/home/talent-traffic-chart-with-chord-diagram-in-excel.
Data availability statement
All data that support the findings of this study are included within the article (and any supplementary information files).