

Abstract
Madden–Julian oscillation (MJO), the dominant mode of intraseasonal variability in the tropical troposphere, has recently been shown to have a great impact on Northern Hemisphere (NH) extratropical stratosphere. But the influence of the variability in the extratropical stratosphere on MJO is seldom reported. In this study, the influence of major, mid–winter NH stratospheric sudden warmings (SSWs) on the MJO is investigated using meteorological reanalysis datasets. Our analysis reveals that SSWs also exert considerable influence on tropical intraseasonal convection. The occurrences of MJO phases 6 and 7 significantly increase during around 20 d after the onset of SSWs, corresponding to enhanced convective activity over the equatorial Central and Western Pacific. Then in the following days, the coherent eastward propagation of tropical intraseasonal convection resembles the periodic variation in a typical MJO. These results suggest that the extratropical stratosphere affects the organized tropical intraseasonal convection, and variability of the tropical intraseasonal convection related to MJO can be better grasped by taking extratropical stratospheric variability into account. Considering the complex interaction between MJO and extratropical stratosphere, further work on comprehensive understanding of the relationship between SSWs and MJO is required in future studies.
Export citation and abstract BibTeX RIS

Original content from this work may be used under the terms of the Creative Commons Attribution 4.0 license. Any further distribution of this work must maintain attribution to the author(s) and the title of the work, journal citation and DOI.
1. Introduction
Stratospheric sudden warming (SSW) is one of the most remarkable phenomena in the winter polar region. An SSW event features a distorted or completely reversed stratospheric polar vortex, as well as tens of degrees of warming within several days (e.g. Quiroz 1975, Labitzke 1977, Schoeberl 1978, Labitzke and van Loon 1999). It is now well established that this fierce change in the wintertime stratospheric polar vortex can influence tropospheric weather and climate at mid- and high latitudes across a wide range of timescales (Thompson et al 2002, Kuroda 2008, Karpechko and Manzini 2012, Kretschmer et al 2018). An anomalously weak vortex related to SSW event can lead to the negative phase of the Northern Annular Mode (also known as the Arctic Oscillation) in the weeks or months following the event and thereby impact the surface climate (e.g. Thompson and Wallace 1998, Baldwin and Dunkerton, 2001, Polvani and Waugh 2004). Nevertheless, the effect of SSW events on tropical troposphere, especially convective activity in the tropics, has not yet been fully understood.
Weather forecasting in tropical regions is challenging due to not only the unstable nature of the atmosphere there but also its sensitivity to various extratropical disturbances. The influence from extratropical stratosphere is generally neglected, but under certain circumstances, such as during an SSW event, significant modification of the intensity and pattern of convective activity can be seen in the tropics. Kodera and Yamada (2004) first showed that a major warming of the Southern Hemisphere (SH) in September 2002 produced a north–south seesaw of tropical convection. Subsequently, Kodera (2006) showed more robust composite results that 12 SSWs in Arctic regions for the period of 1979–2001 lead to a seesaw pattern of convective activity, an enhancement of convective activity near the equatorial SH and a suppression in the tropics of the Northern Hemisphere (NH). Kuroda (2008) also suggested that tropical convection tends to be enhanced in the SH tropics after the occurrence of SSWs. Using a global non-hydrostatic model simulation, Eguchi et al (2015) found that increased tropical upwelling due to an SSW event reduces the static stability in the upper tropical tropopause layer (TTL), which leads to an increase in deep convective activity in the troposphere. Kodera et al (2015) reconfirmed that convective activity and precipitation increase in the equatorial SH after two large major SSW events due to the strengthening of the Brewer–Dobson circulation induced by enhanced stratospheric planetary wave activity. These studies illustrate that SSWs are able to influence the latitudinal structure of convective activity in the tropics. However, the detailed response of tropical intraseasonal convection, i.e. the Madden–Julian oscillation (MJO), to SSWs has received relatively little attention.
The MJO is the dominant mode of intraseasonal variability in the tropical atmosphere and a primary source of predictability for global sub-seasonal prediction; it consists of eastward propagating tropical convective anomalies in the Indian and Pacific Oceans during boreal winter (Madden and Julian 1971, 1972, 1994). The wave perturbations triggered by these convection anomalies propagate poleward, influencing weather patterns in the extratropical troposphere (e.g. Cassou 2008, Seo and Son 2012, Riddle et al 2013). In addition, many studies have demonstrated that the MJO affects wave activity in the extratropical stratosphere, polar stratospheric temperature and winds, hence leading to changes in the evolution feature of SSWs, such as the strength, type and occurrence frequency of SSWs (e.g. Garfinkel et al 2012, 2014, Liu et al 2014, Wang et al 2018). Garfinkel et al (2012) (hereafter G12) showed that during the 12–day period preceding SSWs, MJO phase 7 occurs more than twice as likely compared to its climatological boreal winter frequency. Liu et al (2014) (hereafter L14) found that both the propagation features and intensity of the MJO may affect the type of SSW events. Schwartz and Garfinkel (2017) noted that slightly more than half of SSW events follow MJO phase 6/7. Model simulations in Kang and Tziperman et al (2017) also suggested that stronger MJO forcing increases the SSW frequency in a warmer climate. More recently, Wang et al (2018) showed that the occurrence frequency of MJO phases 4 and 7 in winter have a significant influence on the interannual variability of wave activity in the northern extratropical stratosphere, implying variation in the intensity of polar vortex on interannual timescale. Thus, in consideration of the extensive connection between tropical convection and SSW, a question that naturally arises here is: Can the SSW, in turn, influence the spatial-temporal evolution of the MJO? Though the evolution of tropical convection related to MJO during two SSWs has been reported in the study of Kodera et al (2015), the detailed responses of the amplitude and occurrence of MJO phases to SSWs are still not known.
2. Data and methods
The central dates of the major, midwinter SSW events used in this study are taken from table 1 of Butler and Gerber (2018), who discussed the optimizing of the classification of major SSWs. A total number of 22 SSW events are considered, with first event recorded occurred on 22 January 1979 and the last occurred on 7 January 2013. The central date of an SSW event (referred to as day 0) is defined as the first day when the circumpolar easterly wind appears.
The MJO activity is assessed through the all-season real-time multivariate MJO index (RMM) that is described in Wheeler and Hendon (2004). Note that a 5-day running mean was performed on daily indices to exclude the high day-to-day variability in the propagation and intensity of the MJO (Lin et al 2009). Only days in which the MJO amplitude exceeds 1.0 are treated as 'active MJO days.' Sensitivity analysis suggests that our results are not dependent on the selections of the MJO amplitude threshold value (e.g. 1.25 or 1.5).
Interpolated OLR data were obtained from the Climate Diagnostic Center (CDC) of the National Oceanic and Atmospheric Administration (NOAA). The OLR is used as a proxy for the intensity of convection in the tropics. A low OLR indicates enhanced convection in the tropics. Meteorological reanalysis data were obtained from the National Centers for Environmental Prediction/Department of Energy (NCEP/DOE; Kanamitsu et al 2002). These data were used to examine the SSW-related atmospheric circulation changes. To examine the propagation and dissipation of the stationary Rossby waves, the quasi-geostrophic version of the Eliassen–Palm (E–P) flux and its divergence was calculated using the NCEP/DOE daily fields (Edmon et al 1980). The transformed Eulerian mean (TEM) residual circulation ( ) provides a useful proxy for the Brewer–Dobson circulation (e.g. Andrews and Mcintyre 1976). The formulation used to derive the static stability is from Bluestein (1992). The long–term daily climatology was removed from the daily means to derive the daily anomalies. No smoothing or bandpass filtering was applied to isolate the intraseasonal signal unless otherwise indicated, but when bandpass filtering was used, a 20–100–day band–pass digital filter was applied to derive the intraseasonal anomalies.
The following Monte Carlo test was used to determine the statistical significance of the interaction between the MJO and SSWs. All the extended boreal winters (November–April, 1979–2013) were divided into 12–day intervals (corresponding to the 12–day intervals displayed in figure 3). Sets containing 22 of these intervals were randomly selected (corresponding to the 22 SSWs) to calculate the number of occurrences of each MJO phase. Then, the 'climatological' distributions of each MJO phase are derived by performing the Monte Carlo procedure five thousand times. Finally, these five thousand similar sets of the 'climatological' distributions of the MJO phases were used to determine the 90% and 95% significance levels of the results shown in figure 3 based on the percentiles (e.g. 1%, 5%, 90%, and 95%) of each MJO phase. The 'climatological' mean amplitude of the MJO during the 12-day period shown in figure 2 can also be derived from this Monte Carlo procedure.
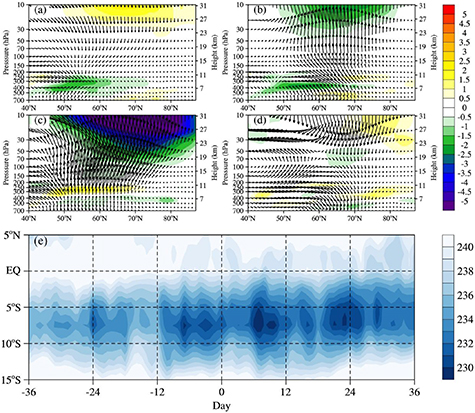
Figure 1. (a)–(d) Latitude–height cross sections of composite E–P flux (vectors; horizontal term: 107 m3 s−2 and vertical term: 105 Pa m2 s−2) and its divergence (shaded; ms−1 d−1) during −36 ∼ −25, −24 ∼ −13, −12 ∼ −1, and 1 ∼ 12 d, respectively. (e) The evolution of zonal-mean OLR (unit: W m−2) in the tropics before and after SSW central days. The negative (positive) days stand for the days before (after) SSW central dates.
Download figure:
Standard image High-resolution image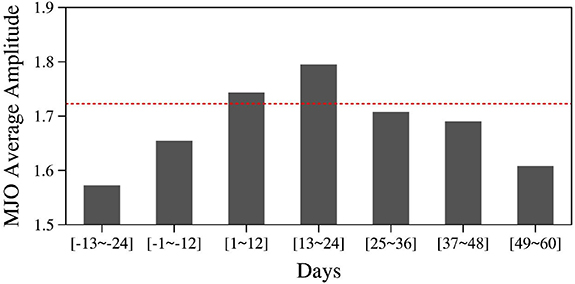
Figure 2. Bars show the average amplitude of the MJO during 12-day periods before and after SSW events (−24 ∼ 60 d). Only days with the amplitude of the MJO exceeding 1.0 are included. The red dashed line indicates the 'climatological' mean amplitude of the MJO during12-day period based on the Monte Carlo test. The negative (positive) days indicate that the MJO leads (lags) the SSWs.
Download figure:
Standard image High-resolution image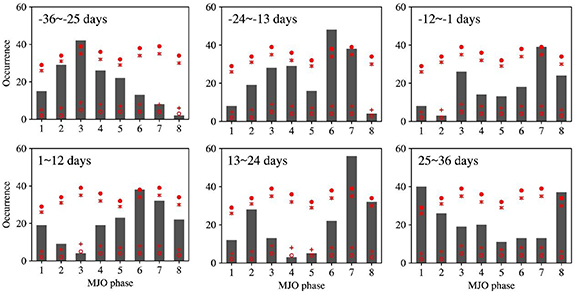
Figure 3. Bars show the number of occurrences of eight Madden–Julian Oscillation (MJO) phases during six 12-day periods before and after the central dates of stratospheric sudden warming (SSW) events. Only days with the amplitude of the Wheeler–Hendon's Real–time Multivariate MJO (RMM) index exceeding 1.0 are included. Based on a two–tailed Monte Carlo test (see text), the red circles, crosses, asterisks and dots mark the 1%, 5%, 90% and 95% percentiles respectively. The negative (positive) days indicate that the MJO leads (lags) the SSWs.
Download figure:
Standard image High-resolution image3. Results
The evolution of planetary waves in the northern extratropical stratosphere and the corresponding change in zonal-mean OLR in the tropics before and after SSWs are presented in figure 1. Top panels in figures 1(a)–(d) show the composite anomalies (only deseasonalized) of the E–P flux and its divergence in the extratropical stratosphere during −36 ∼ 12 d (negative days indicate the days before SSWs central dates), with a 12–day interval. As stratospheric warming is initiated by an enhanced upward propagation of planetary waves from the upper troposphere (Matsuno 1971), significantly enhanced upward wave fluxes and stronger E–P flux convergence in the extratropical stratosphere at mid- and high latitudes can be seen during days −12 ∼ −1. Corresponding to the increase in wave forcing in the extratropical stratosphere, the convective activity in the tropics represented by the zonal-mean OLR increases in the SH after SSWs, and the enhanced convective activity lasts for approximately one month (figure 1(e)). Similar responses of the zonal-mean OLR to SSWs have also been demonstrated in the study of Kodera (2006) and Kodera et al (2015).
To examine the changes in the intensity of tropical intraseasonal convection in response to SSWs, the average amplitude of the MJO during 12-day periods before and after SSW events (−24 ∼ 60 d) is depicted in figure 2. The 12-day average amplitude of the MJO shows a gradual increase from −24 to 12 d and reaches a maximum during days 13 ∼ 24. Then, the 12-day average amplitude of the MJO shows a general decrease until 60 d after SSWs central date. The average amplitude during days 1 ∼ 12 and 13 ∼ 24 exceeds the 'climatological' mean amplitude of the MJO during the 12-day period based on the Monte Carlo test. These results also suggest that SSWs lead to an enhancement in convective activity on the intraseasonal timescale in the tropics, which is generally consistent with the results of figure 1(e).
To demonstrate the influence of the MJO on SSWs, G12 and L14 examined the change in the occurrence of eight MJO phases for three different periods preceding SSWs with a 12–day interval (−25 ∼ −36, −13 ∼ −24, and −1 ∼ −12 d) (see figure 1 in these studies). In this study, a similar analysis is performed (top panels in figure 3) and then extend it to probe the following responses of the occurrence of MJO phases after SSWs (bottom panels in figure 3). As shown in the top panels in figure 3, the dominant MJO phase shifts from phase 3 to phase 6, and finally to phase 7 throughout the three 12–day periods before the central dates of SSWs, which is generally consistent with figure 1 of G12 and L14. Note that these three peaks of the occurrence of MJO phases are significant at the 95% confidence level based on the two–tailed Monte Carlo test. These results suggest that there is significant MJO activity (that is, with large intensity and coherent eastward propagation) throughout the 36 d prior to SSWs. Based on these results and the periodicity of the MJO, without other disturbances, one may speculate that the peak MJO phase should be phase 8 or 1 during the following 12–day period (1 ∼ 12 d) after the SSWs central dates.
However, when we apply a similar analysis to the following periods after the onset of SSWs (bottom panels in figure 3), it is interesting to find that MJO phase 6 is preferred during the days 1 ∼ 12 after the onset of SSWs. During days 13–24 after SSWs, MJO phase 7 is preferred. Then during days 25–36, MJO phases 8 and 1 are preferred. These four dominant MJO phases throughout these three periods after SSWs are significant at the 95% confidence level. These unexpected responses of the occurrence of MJO phases during 1 ∼ 24 d imply that SSW leads to an increase in tropical intraseasonal convection over the equatorial region that related to these peak MJO phases after SSWs. Note that the most significant increase in the occurrence of MJO phase 7 during days 13 ∼ 24 in these six periods corresponds to the maximum 12-day average amplitude of the MJO during the same period in figure 2.
Additionally, due to the patterns of convective activity during MJO phases 6 and 7 are approximately opposite to those associated with MJO phases 3 and 4, we also note that the occurrences of MJO phases 3 and 4 are markedly suppressed (less than 1% percentile) while the occurrences of MJO phases 6 and 7 are significantly increased during days 1 ∼ 12 and 13 ∼ 24, respectively. This negative correlation between the occurrence of MJO phases 7 and 4 in winter can also be found in figure 5 of Wang et al (2018). Moreover, different MJO amplitude threshold values (1.25 and 1.5) were also used to verify the robustness of the evolution features of the occurrence of the MJO before and after SSW events. As Quasi-biennial Oscillation (QBO) has an influence both on SSW and tropical convection, the evolution of occurrences of eight MJO phases during SSW events occurring during easterly and westerly QBO phase has been examined and the results were similar to figure 3 (figures not shown). Combining figures 2 and 3, we can expect strengthened convective activity in the region related to MJO phases 6 and 7 after onset of SSWs.
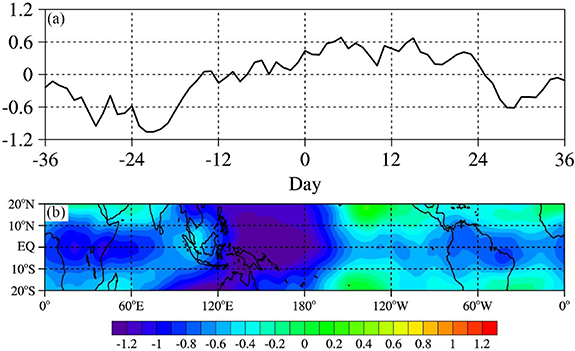
To obtain more cogent evidence on the potential impact of SSWs on equatorial convective activity, the spatial-temporal changes in tropical OLR after SSW events are shown in figure 4. Figure 4(a) illustrates the OLR anomalies averaged 1 ∼ 24 d after the central dates of the SSWs. A 20–100-day band-pass filter was applied to the daily time series to retain the variations in the intraseasonal timescale related to the MJO. Note that pronounced negative OLR anomalies are seen over the Central and Western Pacific in the south of Equator (15°S–0°, 160°E–120°W) during days 1 ∼ 24, approximately corresponding to the region of enhanced convective activity associated with the dominant MJO phases 6 and 7 during the two 12-day periods after SSWs central dates shown in figure 3.

Figure 4. (a) Outgoing longwave radiation (OLR) anomalies (unit: W m−2) averaged during 1 ∼ 24 d after the central dates of SSWs. The OLR anomalies were calculated by removing the seasonal cycle and then applying a 20–100-day band-pass digital filter to the daily time series. (b) Time series of OLR anomalies (units: W m−2) spatially averaged over the equatorial central and western pacific (15°S–0°, 160°E–120°W). The dashed line indicates the band–pass–filtered (20–100 d) OLR anomalies. The solid line indicates the deseasonalized OLR anomalies.
Download figure:
Standard image High-resolution image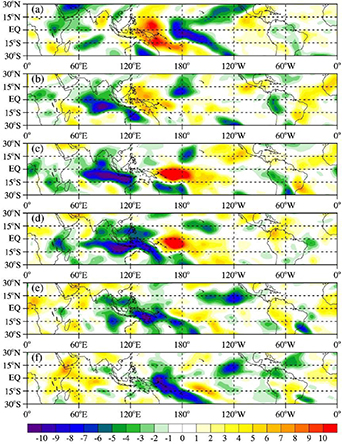
Figure 5. Band–pass–filtered (20–100 d) OLR anomalies (unit: W m−2) during 25 ∼ 60 d after SSWs with 6–day intervals. (a) 25 ∼ 30, (b) 31 ∼ 36, (c) 37 ∼ 42, (d) 43 ∼ 48, (e) 49 ∼ 54, (f) 55 ∼ 60 d.
Download figure:
Standard image High-resolution imageFigure 4(b) shows the time series of OLR anomalies spatially averaged over the equatorial Central and Western Pacific (15°S–0°, 160°E–120°W). The dashed and solid lines indicate the filtered (20–100–day band–pass filtered) and unfiltered (only deseasonalized) OLR anomalies, respectively. The time series of the filtered and unfiltered OLR anomalies generally coincide with each other, in addition to a noticeable daily variation in the unfiltered OLR anomalies. This suggests that the responses of tropical convective activity over the equatorial Central and Western Pacific to SSWs are mainly caused by the variations in the intraseasonal timescale, i.e. the MJO.
Furthermore, the change in the filtered OLR anomalies over the equatorial Central and Western Pacific during days 1 ∼ 36 prior to SSWs is consistent with the periodicity of the MJO. Then, the filtered OLR anomalies show a generally decrease after the onset of SSWs, and the notable enhancement of convective activity (negative OLR anomalies) occurs approximately 20 d after SSWs before a rapid increase in the filtered OLR anomalies can be seen. These responses of convective activity over the equatorial Central and Western Pacific to SSWs are in agreement with the change in the occurrence of MJO phases and the average amplitude of the MJO shown in figures 2 and 3. Previous studies showed that there is 10 ∼ 20 d delay in the response of tropical convection to SSW events (Kodera 2006, Kodera et al 2015). This difference in the lag-time may be caused by the different definition of SSW event and different scale of the convection considered by these studies. Kodera (2006) and Kodera et al (2015) focused on the responses zonal-mean OLR in the tropics to SSW events, whereas this study investigates the evolution of tropical intraseasonal convection after onset of SSW events. Furthermore, the detailed processes in the connection between SSW events and tropical intraseaonal convection need to be clarified in future study.
At this stage, the subsequent behavior of tropical intraseasonal convection needs to be examined. Figure 5 shows the band–pass–filtered (20–100 d) OLR anomalies during days 25 ∼ 60 after SSWs, with 6–day interval. Enhanced convection over equatorial the central Pacific and western Indian Ocean in figures 5(a) and (b) coincides with the dominant occurrence of MJO phases 8 and 1, as shown in figure 3. Then, coherent eastward propagation of the pronounced negative OLR anomalies, similar to typical MJO event, can be seen in following days. These results not only suggest that SSWs have little impact on MJO during 25 ∼ 60 d, but also imply that the significant increases in the occurrence of MJO phase 6 and 7 during 1 ∼ 24 d are indeed caused by SSW events.
It is unclear how the SSW affects the MJO. One of the possible mechanisms is the responses of static stability change in the tropics. Previous studies demonstrated that enhanced wave activity in the extratropical stratosphere induced upwelling in the tropical stratosphere during the SSW events. A stronger upwelling ( ; unit: 10–4 K kg−1 m s2) at tropical lower stratosphere (100 hPa) can be seen from figure 6(a) during 1 ∼ 24 d after onset of SSW events. Then, this upwelling leading to cooling in the lower stratosphere and these temperature anomalies can extend to the upper troposphere (Kodera 2006). The decrease of static stability, which are proportional to the vertical gradient of temperature profiles, provide a favorable environment for organized deep convection (Eguchi et al 2015). Figure 6(b) illustrates static stability anomalies in the tropical stratosphere during 1 ∼ 24 d after onset of SSW events. It should be note that significant decrease in the static stability is over the Central and Western Pacific, which provide a favorable environment for organized deep convection over this region. Cirrus clouds would also form more frequently near the tropical tropopause due to the decrease in the temperature and static stability, this may destabilize the tropical upper troposphere, especially near the tropopause, helping a development of the organized deep convection (Kodera et al 2015). Moreover, the standard deviations of
  among 22 SSW events are in the range of 1.15 ∼ 2.39, implying that different SSW event may have different influence on tropical lower stratosphere and subsequent effect on the intraseasonal convection.
Figure 6. (a) Time series of  (10–4 m s−1) anomalies at 100 hPa in the tropics (15°S–5°N). To reduce day-to-day variation, a 5-day running mean average is also applied. (b) Composite static stability anomalies (unit: 10–4 K kg−1 m s2) averaged through the 100–150 hPa in the tropics during days 1 ∼ 24.
Download figure:
Standard image High-resolution image
4. Conclusions
The intraseasonal variability in tropical heating related to the MJO can exert an impact on the stratospheric polar vortex (e.g. Garfinkel et al 2012, 2014). However, there has been little written about the propagation features and intensity of the MJO after SSW event occur. In the present study, it is expected that SSWs can affect the MJO based on the above findings. The dominant occurrence of MJO phases 6 and 7; the simultaneously enhanced convective activity over the equatorial Central and Western Pacific during 1 ∼ 24 d after onset of SSW events; and then the coherent eastward propagation of tropical intraseasonal convection in the following days all indicate that the influence of SSWs on tropical intraseasonal convection related to the MJO cannot be ignored. Although the dynamic and physical mechanism(s) are unclear, this SSW–MJO link is consistent with the thermal stratification change in the tropical upper troposphere.
Presumably, the SSW–MJO link is associated with multiple factors. The responses of static stability in the tropical upper troposphere and lower stratosphere (UTLS) to SSW event described above may not be the sole potential mechanism by which SSW affects the MJO. Other mechanisms, such as vertical wind shear (Ho et al 2009), absolute vorticity (Collimore et al 2003), and tropopause changes (Gray et al 1992), can also be adopted to explain the responses of tropical convection to the anomaly in the UTLS region. Thus, to identify the exact mechanism(s), further studies using both observations and numerical model simulations are necessary.
The impacts from SSWs could affect tropical intraseasonal convection related to MJO on time scales exceeding 20 d. More importantly, this work demonstrated the complex relationship between the MJO and SSW. Previous studies have shown a strong impact of the MJO on the NH wintertime stratospheric polar vortex. However, the results of this study allude to the reverse route, i.e. alteration of the tropical intraseasonal convection related to the MJO due to the abrupt change in the extratropical stratosphere. Although the results need to be further confirmed by numerical models that resolve stratospheric processes, this study suggests that SSW is indispensable for the subseasonal-to-seasonal prediction of the evolution of MJO. In this regard, it is also anticipated that the statistical prediction of MJO could be improved by taking variability in the extratropical stratosphere into consideration as a potential predictor especially in boreal winter.
Acknowledgments
This work was supported by the National Natural Science Foundation of China (41630421, 41905039), the National Key Research and Development Program of China (2018YFC1507200) and the Natural Science Basic Research Plan in Shaanxi Province of China (2019JQ-278). We thank the Australian Bureau of Meteorology for providing the MJO index, and NOAA for providing the OLR data. We would also thank the NCEP–DOE for providing the reanalysis data. We thank the two anonymous reviewers for their helpful comments, which significantly improved the quality of the paper.
Data Availability Statement
The data that support the findings of this study are available from the corresponding author upon reasonable request.