

Abstract
There is a need to understand the onset of monsoon dynamics as the date of onset of monsoon (DOM) is an important parameter in framing all the policy for the imminent season like crop choice, sowing schedule, disaster management, power distribution etc It is observed that the interannual variability of the DOM in India is about 7–8 days, making it more challenge to predict this at long lead. The MJO phases are linked with the different convection centres and hence, influences the global circulation process and the rainfall. In this paper the dynamical influence of the different phases of MJO are being quantified on DOM and its progress in continental India by using the multi-source atmospheric and oceanic parameters like wind structure, outgoing longwave radiation (OLR), sea surface temperature (SST). The linkage of the active and inactive phases of MJO along with the favourable conditions for DOM is obtained by using the pentad analysis of associated parameters in different clusters for both the wet and dry phases of MJO along with the strength for the period 1980–2018. Also the dynamics are studied for the early, normal and late onset years separately to understand the relation better. It is inferred that the wet (dry) phase leads to early (late) monsoon onset over Kerala (MOK) in India. To address the progress of monsoon the DOM in Rajasthan (MOR) is considered and the rainfall anomalies during MOK-MOR period are linked to the MJO phases. It is inferred that the wet MJO phase with negative OLR anomaly triggers the fast progress of monsoon over India. This understanding will surely help operational researchers and the NWP modellers for improving the methodologies for the advanced and accurate prediction of DOM.
Export citation and abstract BibTeX RIS

Original content from this work may be used under the terms of the Creative Commons Attribution 4.0 licence. Any further distribution of this work must maintain attribution to the author(s) and the title of the work, journal citation and DOI.
1. Introduction
One of the prominent features of the atmosphere-land-ocean coupled system in the tropics is the seasonal cycle of the Indian summer monsoon (ISM), which helps in the circulation of a good amount of moisture across the Indian Ocean and also over the Indian land mass during the boreal summer and brings the south-west monsoon season to India. Since Indian Agriculture and so the economy is completely dependent on monsoon rain, the early/delay of the date of onset of monsoon (DOM) results in serious concern with an adverse impact on these sectors. It's therefore, necessary to assess, understand and quantify the reasons for the monsoon onset variability. This understanding will be better guidance for the Numerical Weather Prediction (NWP) models for the accurate and advanced forecasting of the onset of rainfall, which in turn will surely help in mitigating the adverse effect of early/delay of ISM onset.
The most important phenomena of the Indian summer monsoon are its onset and demise, but at the same time, it's an arduous task to predict this transience in a long lead time, as it has a strong connection with the large scale oceanic and atmospheric processes such as El Niño-Southern Oscillation (ENSO), Indian Ocean Dipole (IOD) and Madden–Julian oscillation (MJO) in the Indo-Pacific region. In the present research era, characterization of variability in ISM, its onset/demise timing has been a topic of keen interest for all climate researchers as it has a significant effect on Indian agriculture as well as the economy of the country (Gadgil 2003, Giné et al 2008). The eastward movement of the band of rain clouds, over the Indian ocean and along the equator, is the basic property of equatorially trapped waves and it's due to the interaction between the monsoon circulation and equatorial modes. This tropical oscillation of 40–50 days while in the convection period drives the monsoon onset over India (Lau and Chan 1986). One of the important parameters, outgoing longwave radiation (OLR), is also used to determine the convection and intraseasonal variability in the tropical atmosphere over the Indian Ocean/Pacific during the northern summer/winter in earlier studies (Lau and Chan 1985, Lau and Chan 1986).
Some recent researchers have identified a clear connection of ENSO and IOD with ISM onset, demise, length of ISM and also with the monsoon seasonal rainfall (Yadav et al 2013, Gouda et al 2017, Ashok, TEJAVATH 2019, Hrudya et al 2020, 2021, Lenka et al 2022) but the clear connection with the impact of MJO is still missing. The interannual variability of the MJO on various time scale have association with the large-scale phenomena like ENSO (Slingo et al 1999, Tseng et al 2020, Dasgupta et al 2021,) and in turn to the monsoon system (Madden and Julian 1971). MJO is one of the most important impelling factors for certain tropical phenomena like the ISM onset and seasonal monsoon rainfall (Mishra et al 2017, Taraphdar et al 2018). The early and delay in the monsoon onset over Kerala (MOK) indicated the strong interannual variability (IAV) of the phenomenon (Goswami and Gouda 2010). This variability is a result of the dominant mode of tropical intraseasoanl variability (ISV) and associated phases (Pai et al 2011, Chi et al 2015, Bhatla et al 2017). The dipole nature of MJO with a wet(dry) phase over the Indian Ocean results in early (delay) onset over the Indian Ocean (Raju et al 2005, Taraphdar et al 2018).
MJO active phases are associated with the deep convection entities in the central Indian Ocean and the west Pacific Ocean, which leads to the onset of ISM (Barnes, HouzeJr 2013). A consistent convective activity is usually observed over the southeast Arabian sea due to the cross-equatorial flow, just before the MOK and this process helps in the transport of moisture containing air mass towards the Indian land mass resulting in the progress of monsoon (Joseph et al 1994). The most important parameters of monsoon onset i.e. monsoonal westerlies over the Arabian sea (AS) reinforce in magnitude in vertical extent during this period (Joseph et al 2006) which results in a gradual proliferation of kinetic energy (Ananthakrishnan et al 1983) and moisture flux (Soman and Kumar 1993) and eventually it develops into a strong convection over the Bay of Bengal (BOB) (Wang and Fan 1999). Concurrently, a low pressure region develops over the southeast Arabian Sea, known as the Monsoon onset vertex (Wang and Fan 1999) which helps in the northward propagation of the monsoon wind (Taraphdar et al 2009, Singh et al 2017). IMD follows a new definition of DOM by considering rainfall, OLR and wind circulation since 2009 (Pai and Nair 2009). A recent work has shown that there is a strong impact of MJO on the diurnal cycle of rainfall in the west coast of India (Prajwal et al 2022). The impact of MJO concurrently with the cyclogenesis during the summer also triggers the onset of the Indian monsoon (Baburaj et al 2022).
The effect of the dominant mode of intra-seasonal variability i.e., MJO on the tropical atmosphere should be examined better by knowing its complete life cycle and each individual phase of phase speed of 5 ms−1 with eastward motion (Hendon and Salby 1994, Zhang 2005). All 8 phases of MJO have significant effects on monsoon rainfall and its circulation, which are derived from the real-time multivariate MJO index (Wheeler and Hendon 2004). There is hardly any work which emphasizes on the relation of MJO with the onset and also the progress of monsoon dynamics in India. Due to the larger extent of the country, apart from the MOK, it is needed to understand the onset at other parts of the country, i.e. the progress of the monsoon which generally takes about 30–45 days. Keeping this in mind in this work, the linkage of MJO to the monsoon onset dynamics in terms of the rainfall distribution over Kerala followed by other parts in India is explored which is a unique part of this study. The dynamical impact of MJO phases on the rainfall during monsoon onset and also at state scale during its progress is quantified, which is important as agriculture practice is fully dependent on the local monsoon rainfall. The effect of important parameters like sea surface temperature (SST), (OLR), wind circulation structures in the analysis of the onset rainfall and monsoon progress and its complementary with MJO is also explored in this study. The phase analysis of MJO which triggers the MOK and subsequently the rate of progress (slow, fast or normal) of monsoon in the continental India is quantified.
2. Data and methodology
The data used for defining the geographical location of MJO along with various phases and its strength is the real time multivariate MJO indices i.e. RMM1 and RMM2 along with its amplitude are obtained from the Australian Bureau of Meteorology (Wheeler and Hendon 2004). The MOK indicates the date of onset of south west monsoon over Kerala and the date when the monsoon completely withdrawn from India is termed as demise date. The date of ISM onset (MOK) and the demise date is collected from the daily weather reports published by India Meteorological Department (IMD using the new criteria (Pai et al 2014). The IMD daily gridded rainfall data at spatial resolution of 0.25° × 0.25° over continental India is used for the monsoon rainfall analysis. The global SST and wind vector field for this analysis is collected from the National Centre for Environmental Prediction (NCEP) reanalysis product available at 1° × 1°. The daily mean Interpolated OLR are taken from the National Oceanic and Atmospheric Administration (NOAA) data which are available with a spatial coverage of 2.5° × 2.5°.
The MJO life cycle is visualized with the help of two-dimensional phase space diagram by using the RMM1 and RMM2 as its horizontal and vertical cartesian axes (Wheeler and Hendon 2004) represent 8 different phases of MJO along with its convective envelope around the global tropics. When MJO evolves, so does the convective phase present over the Indian Ocean, bringing in surplus amount of rainfall over the Indian subcontinent. The climatological features of the MJO studied earlier by different activity categories defined by researchers (Lafleur et al 2015, Taraphdar et al 2018).
All MJO phases and its strength are being computed using the formula given below.


If  then the phase is considered as active MJO and
  indicates the inactive MJO phase. Similarly, the MJO phases are termed as wet (dry) if the rainfall anomaly found to be positive (negative).
One of the main objective of the present work is to differentiate the wet and dry phases of MJO during MOK, analyse their effect on ISM onset and progress. All the years used in the study has been classified in four categories by considering the amplitude and phase of MJO during ISM onset in India and these are termed accordingly as presented in table 1. The pentad analysis in terms of three pentads (i.e. p-1, p0 and p1) composite average of different meteorological parameters over the years has been computed where p0 (onset pentad) includes the date of onset with 2 preceding and 2 following days, p-1 (pre-onset pentad) is with lag time of 5 days of p0 and p1 (post-onset pentad) is with lead time of 5 days of p0. The discussed parameters have been plotted over a domain area of 20° S to 30° N and 20° W to 150° E.
Table 1. Classification of years considering the amplitude and phases of MJO during onset of Monsoon in India.
| Years | Phase | Amplitude |
|---|---|---|
| Active Wet (AW) | Wet (Phase 3,4,5,6) | Active |
| Active Dry (AD) | Dry (Phase 1,2,7,8) | |
| Inactive Wet (IW) | Wet (Phase 3,4,5,6) | Inactive |
| Inactive Dry (ID) | Dry (Phase 1,2,7,8) |
For clear analysis to establish the linkage between MOK and MJO, all the years used in the study has been categorized in three classes by considering the climatological MOK date as 1st June with 8 days of standard deviation (Pai and Rajeevan 2009) as a sub branch of MJO phases. These are categorized as, the normal onset year (MOK within ± 5 days of the mean value i.e. 1st June), early onset year (MOK prior to May 25) and the late onset year (MOK after 6th June).
To compare the slow, fast and normal progress of monsoon over the sub-continent the average time to cover the monsoon (Mc) over the whole country is computed as follow

Where MOK = Date of onset of monsoon over Kerala
MOR = Date of arrival of monsoon in the farther west part of country i.e. over Rajasthan
To compare the slow, fast and normal progress of monsoon over the sub-continent the average time to cover the monsoon (Mc) over the whole country is considered to be 41 days with 5 days of standard deviation. In order to assess the progress of monsoon all the 39 years are being clustered into three categories i.e. slow progress (if the Mc > 46 days), fast progress year(Mc < 36 days) otherwise normal progress.
3. Result and discussion
3.1. Linkage between MJO and MOK
In an attempt to ascertain the MJO phases during the MOK for the period 1980–2018, the RMM indices (RMM1 and RMM2) are used. When the tropical MJO travels from African region towards the maritime continent via the western Indian Ocean, a convective phase over Indian Ocean occurs and triggers the MOK in India. The IAV of the phases of MJO during the MOK for the years are presented in figure 1 with indication of the phase types as active wet (AW), active dry (AD), Inactive wet (IW) and Inactive dry (ID) MJO in different colours. The IAV statistics shows that that 84.61% of MOK events (33 out of 39) transpire during the phases 1,2,3 and 4 regardless the MJO strength, whereas by taking MJO strength into consideration, it is observed that only 61.53% of events (24 out of 39) occurs during the active MJO period.

Figure 1. Interannual variability in the Phases of MJO during the onset of monsoon over Kerala (MOK) in India. All the phases of MJO are differentiated with different colours i.e. Blue (AW), light blue (AD), Purple (IW) & light purple (ID).
Download figure:
Standard image High-resolution imageThe effect of major atmospheric and oceanic parameters (wind, OLR and SST) on DOM are analysed for the years 1980–2018 before exploring the additional impact of the large-scale process i.e., MJO. The low-level (850hPa) south-westerly jet over the west Indian ocean known as the Somali jet gets stronger in accordance with time and supports the MOK (Taraphdar et al 2018). Table 2 classifies the years as different categories, by taking MOK and MJO strength and phases into consideration.
Table 2. Classification of monsoon onset years with corresponding MJO Phases. Black, blue and red indicates the years with normal, early and late date of MOK.
| MJO Phases | ||||||||
|---|---|---|---|---|---|---|---|---|
| MJO Phase Class | P1 | P2 | P3 | P4 | P5 | P6 | P7 | P8 |
| Active Wet | 1982 | 1990 | 2012 | |||||
| 1985 | 2018 | |||||||
| 1986 | ||||||||
| 1987 | ||||||||
| 1991 | ||||||||
| 1993 | ||||||||
| 1996 | ||||||||
| Active Dry | 1980 | 1983 | 2009 | 2001 | ||||
| 1997 | 1988 | |||||||
| 2002 | 1992 | |||||||
| 2003 | 2002 | |||||||
| 2007 | 2015 | |||||||
| 2008 | ||||||||
| 2010 | ||||||||
| 2013 | ||||||||
| Inactive Wet | 1989 | 1984 | 1981 | 2011 | ||||
| 1999 | 1998 | 2017 | ||||||
| 2006 | ||||||||
| Inactive Dry | 1994 | 1995 | ||||||
| 2016 | 2000 | |||||||
| 2004 | ||||||||
| 2005 | ||||||||
| 2014 | ||||||||
During the 39 years of study period (1980–2018), only 15.38% years received the early ISM onset during the MJO phases P3, P4, P7 and P8 but 66.66% of event occurs in the wet phases of MJO. On the other hand, 23.07% years recorded the late onset in the MJO phases P1,P2 and P3 and 88.88% of the event occurs in the dry MJO phases i.e. in P1 and P2. Also it is noted that, the announced MOK is the earliest during 1990 (18th May) in P4 (i.e. the wet) phase and out of 8 ISM onset delay years, the most delayed MOK is noticed in the year 2003 (13th June) in P1 (i.e. the dry) phase of MJO.
3.2. Relation of MJO and Rainfall over Kerala during MOK
The relation of MJO phase-rainfall over Kerala quantified by computing the composite pentad rainfall (5 day averaged centred on the date of MOK) anomaly with respect to the corresponding long term mean. The results (figure 2) shows that anomaly ranges about ± 4mm/day for 8 phases of MJO. The spatial distribution shows that during phases 2 and 7 of MJO, a weak negative rainfall anomaly is observed over Kerala along with the strong negative spatial spreading of rainfall anomaly over the southern part of India whereas Kerala witnesses weak negative anomaly in phase 1 and 8 of MJO. The MJO phase 4 and 6 composite analysis results a positive rainfall anomaly over Kerala whereas the other region experiences negative rainfall anomaly. During phases 3 and 5 of MJO the overall south peninsula receives very good rainfall with a very strong anomaly. From the above MJO-rainfall analysis, it is inferred that the composite pentad rainfall anomaly during MOK is positive if the MJO is in 3,4,5 and 6 phases and negative for other four (i.e. 1, 2, 7 and 8) phases, known as the dry phase of MJO and this finding is in perfect agreement with the earlier results (Pai et al 2011, Mishra et al 2017), which concludes the presence of MJO wet phases (P3, P4, P5 and P6) results in positive rainfall anomaly and opposite scenario for other four MJO phases over all India using IMD daily gridded rainfall data (Pai et al 2011) and TRMM rainfall data (Mishra et al 2017).

Figure 2. Analysis of pentad rainfall anomaly (mm) during MOK. The results are composited over different phases of MJO during 1980–2018.
Download figure:
Standard image High-resolution image3.3. Analysis of Major Parameters during MOK in different MJO classes
In this section the effects of major oceanic and atmospheric parameters like SST, OLR and wind circulation on the onset of monsoon in terms the strength and phases of MJO are clustered based on active/inactive and wet/dry conditions (AW, AD, IW and ID) and the corresponding pentad analysis are presented, which provides a clear relation of these parameters, MJO and their impact on the monsoon onset as well as progress in India.
3.3.1. Rainfall
The composite pentad rainfall anomaly along with the significant values are presented in figure 3. In the AWMJO years, positive rainfall anomaly observed in most of the parts of Kerala and its surrounding region, whereas in case of ADMJO year almost all part of the state witnesses dry condition. High intense rainfall with high (low) spatial spreading over Kerala observed in the case of inactive (IW/ID) MJO condition. This clearly quantifies the importance of MJO phases on the monsoon onset and associated rainfall, irrespective of its phase and strength. The convectively active or supress condition of MJO is not spatially homogeneous and due to this reason the presence of convectively active condition of MJO may not result positive rainfall anomaly over the region.

Figure 3. Composite pentad rainfall anomaly (mm) during monsoon onset over Kerala for the AW, AD, IW and ID years of MJO. Results are presented only over the regions with 95% significance values.
Download figure:
Standard image High-resolution image3.3.2. Outgoing Longwave Radiation (OLR)
The convective characteristics in the atmosphere are represented by using the normalised OLR anomaly (expressed as % of long term mean) during the classified wet and dry phases of MJO. The positive (negative) OLR anomaly is the indicative of suppressed(enhanced) convection and the cloud free(cloudy) atmosphere, resulting more outgoing radiation. The spatial distribution of composite pentad OLR anomaly during the pre-onset (p-1), onset (p0) and post onset (p1) as presented in figure 4, reveals the structures are completely different for all the four different MJO classes. During AWMJO, the wet phase of MJO covers over the Indian land mass and most of the region over equatorial Indian Ocean and AS witnesses the active convection and shows a negative OLR anomaly, whereas opposite the condition in ADMJO years. The pentad analysis clearly indicate the spatial movement of cloud coverage from pre-onset to onset time. During p1, almost all parts of equatorial Indian Ocean witnesses active convection. Significant cloud coverage has been observed over equatorial Indian Ocean and Indian landmass during the IWMJO condition in the onset pentad (p0) and also in the pre-onset pentad (p-1) but again the reverse condition is observed over Indian landmass during the IDMJO years. Due to the suppressed convective activity a positive OLR anomaly observed for the pentads p-1, p0 and p1, in Bay of Bengal (BOB) in IDMJO years. The presence of wet phases (P3, P4, P5 and P6) witnesses negative OLR anomaly and the dry MJO phases (P1, P2, P7 and P8) results a strong positive OLR anomaly confirming the strong relation of the MJO and OLR. The composite OLR anomaly also analysed during the period of p0, p1 and p-1for all 3 types (early, late and normal) of ISM onset years. Early MOK (both p-1 and p0) is associated with negative OLR anomaly with MJO mostly in the phases P3, P4 and occasionally P1 over the Indian landmass and also over the EIO as evident from the figure SF1.

Figure 4. Pentad (p-1, p0 and p1) average out going long wave radiation(OLR) anomaly (% of mean) during monsoon onset over Kerala composite over AW, AD, IW and ID years of MJO. Regions with 95% significance values are only presented in the plot.
Download figure:
Standard image High-resolution image3.3.3. Sea Surface Temperature (SST)
The positive (negative) SST anomaly illustrates more (less) heating in the lower boundary and this difference may have some effect on the land ocean thermal contrast. Figure 5 shows the spatial distribution of SST anomaly during the pre-onset, onset and post-onset pentads (p-1, p0 and p1) for the AW, AD, IW and ID MJO years. The boreal summer made the Indian landmass a hotter and the lower SST anomaly in AS during AWMJO indicates that, there is a presence of North Indian Ocean strong warm pool and the thermal contrast may trigger the ISM onset which is complemented by wet MJO phases. A development of warm SST is observed in case onset pentad of the dry MJO phases and ADMJO condition leads to extreme delay of monsoon onset over Kerala.

Figure 5. Pentad average (p-1, p0 and p1) SST anomaly (oC) during monsoon onset over Kerala composite over AW, AD, IW and ID years of MJO. Regions with 95% significance values are only presented in the plot.
Download figure:
Standard image High-resolution imageFrom the analysis of early, late and normal onset year it's clear that the spatial distribution of normal and late onset years show a mini warm pool over the central AS, unlike in early onset year and this result (presented in figure SF2) is broadly in agreement with findings of earlier work (Pal et al 2017). North AS develops warm SST in p-1 and the strength decreases over the time in normal and late onset years.
3.3.4. Wind structure
As the monsoon flow is directly associated with the large scale wind flow, in this analysis the NCEP wind at 850hpa anomaly during the pre-onset, onset and post-onset pentads (p-1, p0 and p1) over the AW, AD, IW and ID years of MJO are being quantified. The wind anomaly vectors presented in figure 6 are produced by considering the zonal and meridional wind anomalies. The wind anomaly field indicates the cross equatorial flow in terms of comparatively strong wind during the active wet phases of MJO which helps the moisture flow towards Indian land mass and monsoon onset prevails with good rainfall over the country. The wind fields indicated stronger wind during the early onset years and the two highs in AS and BoB creates a favourable condition for onset and progress of monsoon in the continental India (figure SF3). The absolute wind strength is quite low in the continental India during the late MOK years compared to early MOK years.

Figure 6. Pentad average (p-1, p0 and p1) 850hpa wind anomaly (m/s) during monsoon onset over Kerala composite over AW, AD, IW and ID years of MJO. The resultant wind speed is presented in shade and the vectors indicates the wind direction.
Download figure:
Standard image High-resolution image3.4. MJO and Monsoon progress (MOK-MOR)
There is direct linkage of the OLR and MJO as inferred from figure 4 that wet (dry) phase of MJO leads to negative (positive) OLR anomaly over continental India. In this section we have presented the impact of MJO on the monsoon progress by analysing the OLR. The normalised OLR anomaly (% of mean) during the onset pentad of slow, normal and fast monsoon progress year is presented in figure 7. The purple and blue(red and pink) shading area corresponds to presence of convectively wet(dry) phase of MJO which leads to a good (less) amount of rainfall. The composite pentad analysis of OLR in the slow progress year results weak positive OLR anomaly over the Indian subcontinent and the surrounding region (figure 7; left panel). However the OLR anomaly is strong negative over the EIO and strong positive over Western Pacific Ocean. This indicates the progress of monsoon is slow (fast) with the dry (wet) MJO condition. It is observed from the figure 7 (middle panel), a convective envelope develops over the Indian landmass and also over BOB. The presence of convectively active condition of eastward moving MJO helps in northward progress of monsoon. In case of fast progress year it is observed that the whole Indian landmass covered with negative OLR anomaly by making a strong convective envelope over the landmass as depicted in figure 7 (right panel). Similarly, a strong negative OLR anomaly observed over BOB and Pacific Ocean indicating the eastward movement of the MJO. So the presence of strong convective condition triggers monsoon onset and also helps the fast northward movement of monsoon.

Figure 7. Normalised OLR anomaly (% of mean) composite over the Slow (left), normal (middle) and fast (right) monsoon progress years in continental India for the period 1980–2018.
Download figure:
Standard image High-resolution imageIn order to assess the relation of MJO on the net progress of monsoon and the rainfall in the progress period (Mc), the rainfall anomaly composite over different years separately (slow, normal and fast) in the MOK-MOR duration is computed and the all India rainfall anomaly distribution as a function of phases of MJO is presented in figure 8. Similarly, the state wise Rainfall anomaly during Mc are presented in table 3. The analysis indicates that the MJO phases significantly affect the progress and associated monsoon rainfall in different parts (states) in India, because of the different associated convective conditions. The composite analysis shows maximum dry zones in the country if the MJO lies in phases 1, 2,5, 7. The anomaly of rainfall seems to be positive in most of the states during MJO phases 3,4,6 and 8 with maximum states receiving good rainfall (positive anomaly) during the MOK-MOR interval if the MJO phases are in phase 6 and 4 as presented in table 3. This clearly supports that the MJO active phases 3,4 and 6 drives the progress of good monsoon in the country.

Figure 8. Rainfall anomaly (mm) analysis for the period of MOK to MOR, composite over different phases (1–8) of MJO. The results represent the analysis over the years 1980–2018.
Download figure:
Standard image High-resolution image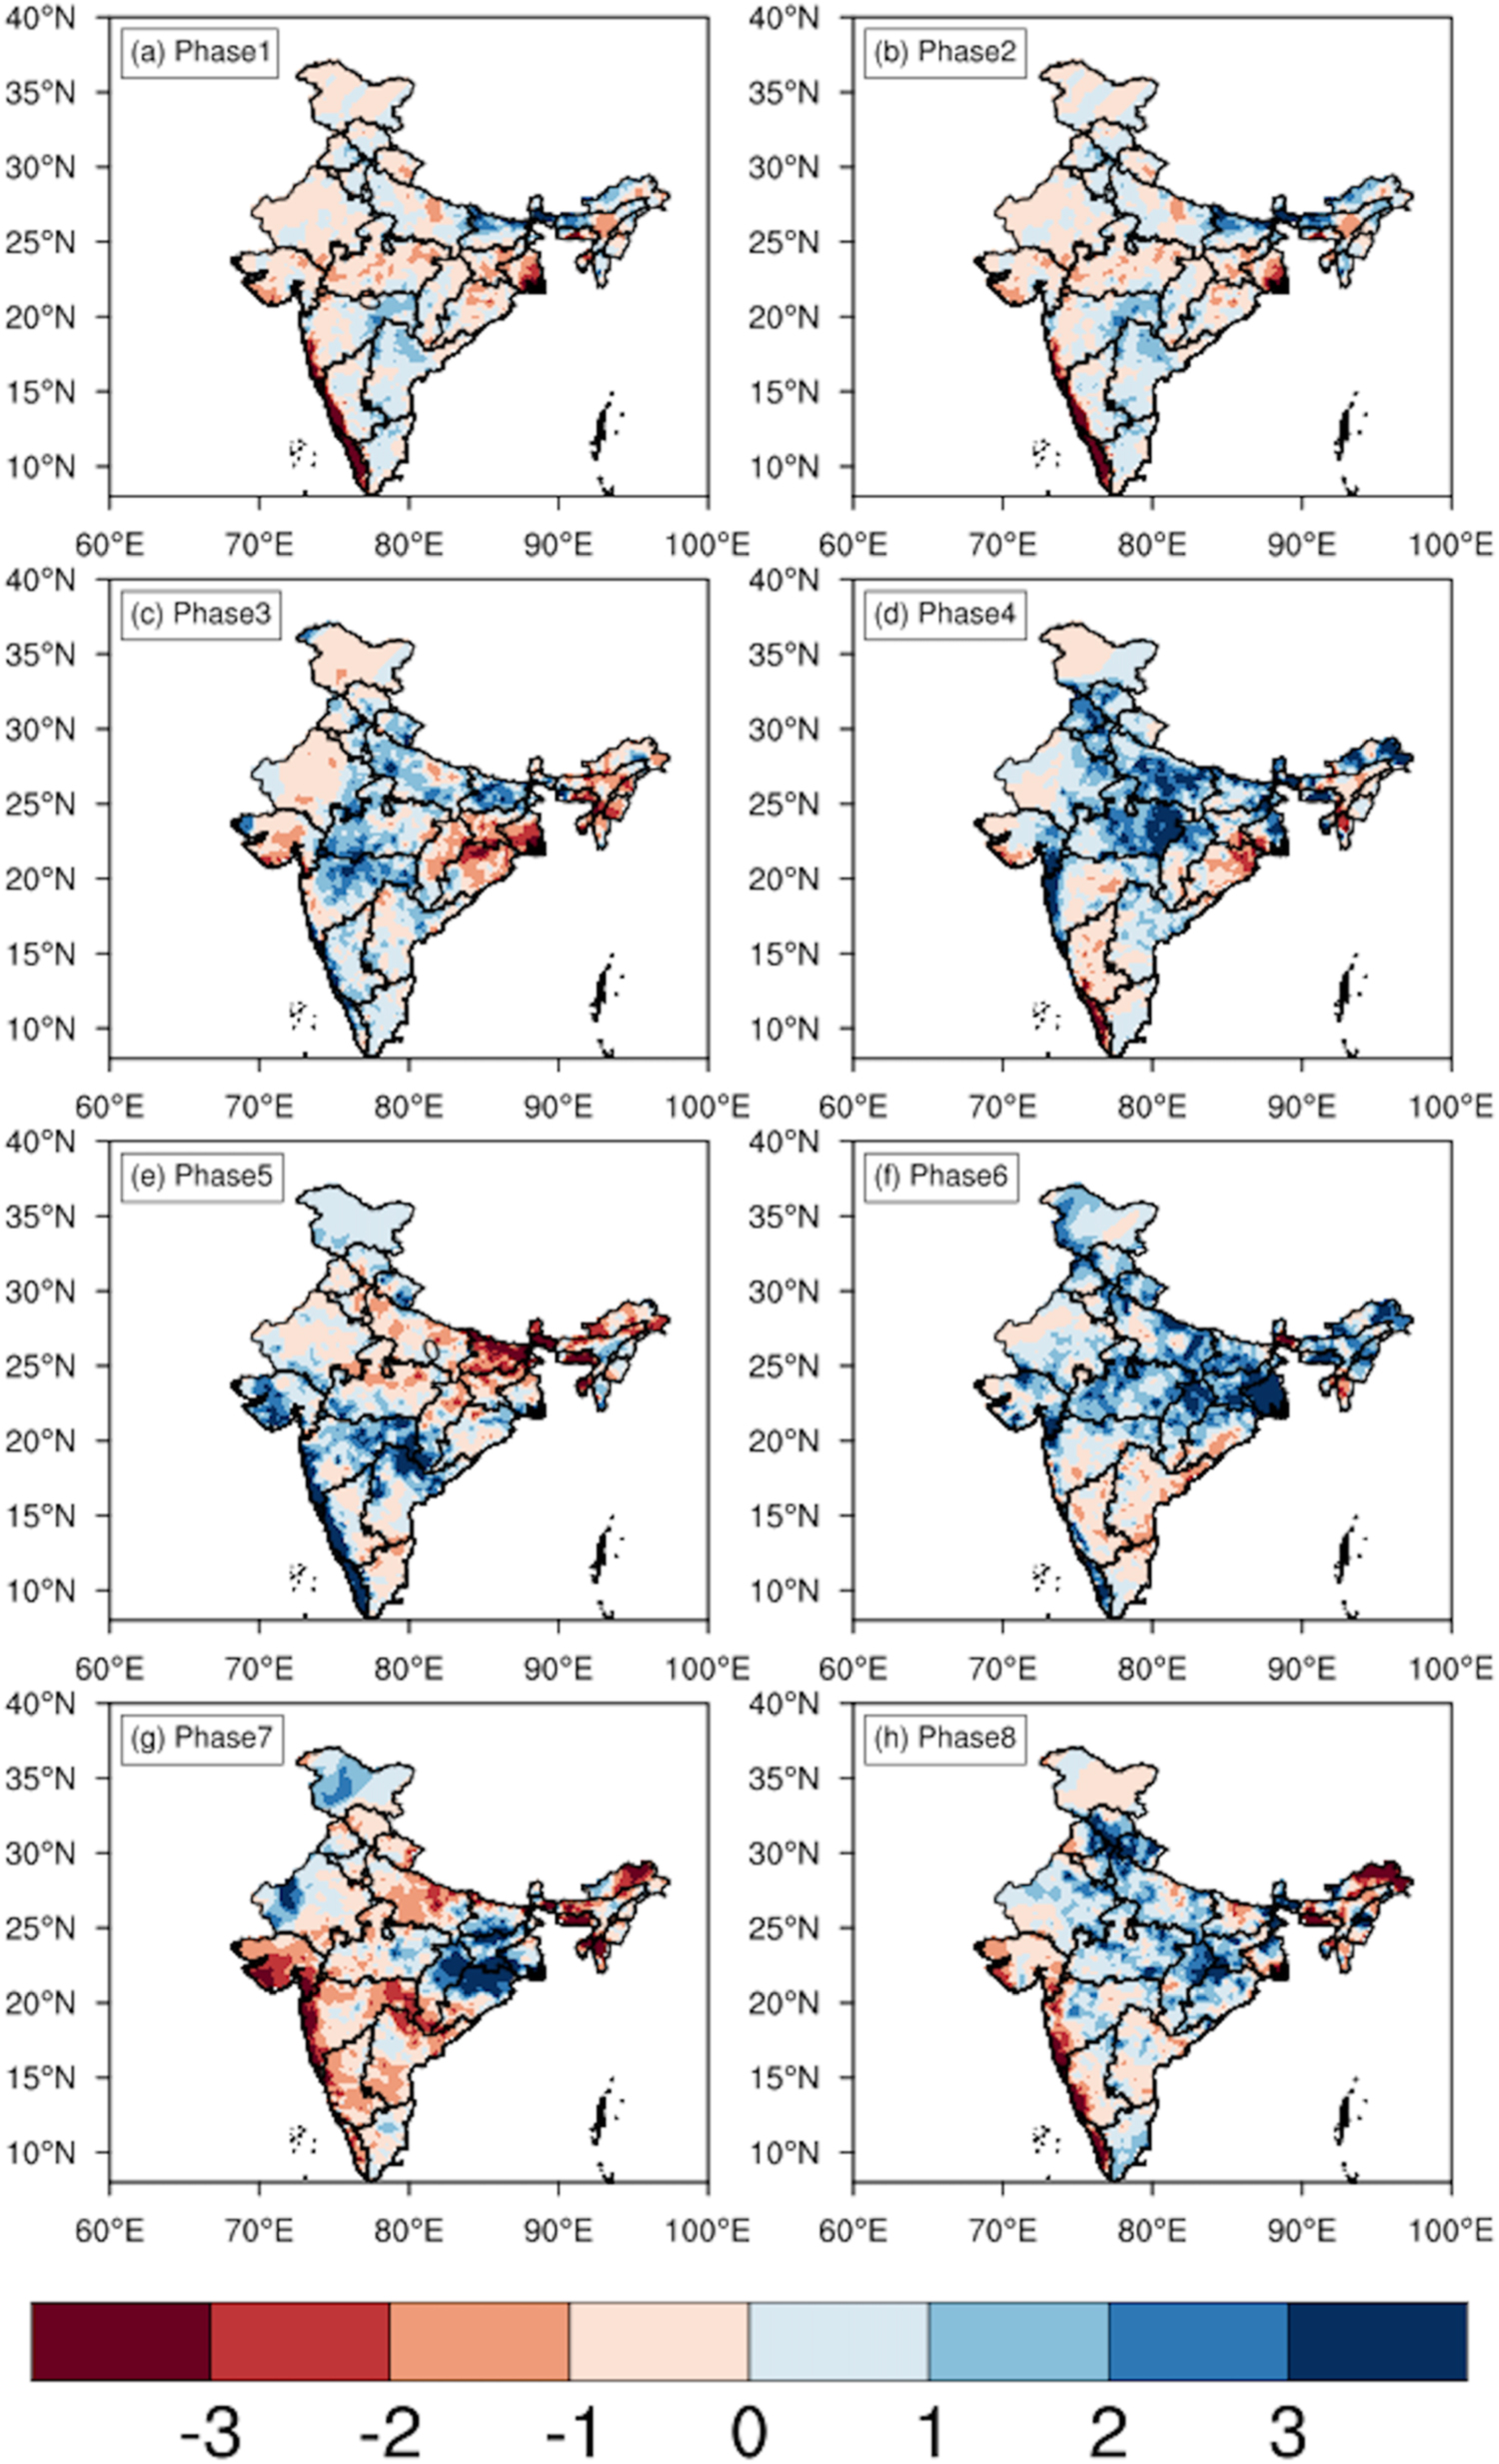
Table 3. Region (state) wise composite rainfall anomalies during MOK-MOR interval in different MJO Phases.
| MJO Phases | ||||||||
|---|---|---|---|---|---|---|---|---|
| States | P1 | P2 | P3 | P4 | P5 | P6 | P7 | P8 |
| KERALA | — | — | + | — | + | + | — | — |
| TAMIL NADU | + | + | + | + | — | — | — | + |
| KARNATAKA | — | — | + | — | + | — | — | — |
| ANDHRA PRADESH | + | + | + | + | + | — | — | — |
| MAHARASTRA | — | — | + | — | + | + | — | — |
| CHHATTISGARH | — | — | — | + | — | + | + | + |
| ODISHA | — | — | — | — | — | + | + | + |
| WEST BENGAL | — | — | — | + | — | + | + | + |
| JHARKHAND | — | — | — | + | — | + | + | + |
| BIHAR | + | + | + | + | — | + | + | — |
| MADHYA PRADESH | — | — | + | + | — | + | — | + |
| UTTAR PRADESH | — | — | + | + | — | + | — | + |
| RAJASTHAN | — | — | — | + | — | + | + | + |
| GUJURAT | — | — | — | + | + | + | — | — |
| HARYANA | + | + | + | + | — | + | — | + |
| PUNJAB | + | + | + | + | — | + | + | + |
| HIMACHAL PRADESH | — | + | + | + | + | + | — | + |
| NORTH EAST INDIA | + | + | — | — | — | + | — | — |
4. Conclusion
The eastward moving rain cloud in tropics (MJO), results in a large scale changes in its pathway and triggers the onset of ISM over Indian subcontinent. Unlike earlier studies depicting direct MJO-monsoon onset linkage only, the innovation of the present study is to assess the combined significant effect of MJO and multiple associated parameters on the onset of monsoon in terms of DOM as well as spread of rainfall. The relation of the MJO (phase and strength) and the monsoon flow (slow/normal/fast) in continental India is also a new finding. We demonstrated the combined significant effect of MJO mechanism on different atmospheric parameters (OLR, SST, Wind structure at 850hpa and rainfall) and so on the onset of Indian summer monsoon and its progress thereof. Also the inter annual variation in ISM onset over Indian subcontinent has been analysed and the dominance of the MJO phases is clearly reflected in controlling the DOM. When these prevailing atmospheric and oceanic conditions overlap with the propagating MJO, it favours the onset of ISM over Indian region along with persistence rainfall. Most of the ISM onset events (84.61% years) are associated with the MJO phases 1, 2, 3 and 4. i.e. the time period when the tropical MJO starts traveling from African region towards the western Indian ocean, this result is supported by the earlier findings (Taraphdar et al 2018, Baburaj et al 2022).
A significant changing pattern of the considered atmospheric parameters are analysed during the DOM for all the years 1980–2018. The rainfall associated with onset of MOK clearly shows the onset occurs mainly during the MJO phases 3, 4, 5 and 6 with good amount of pentad rainfall restricted over Kerala whereas, if onset comes with the active MJO phases 5 or 8, the spatial spread of rainfall is more over the south peninsular India. In relation to the amplitude of MJO, it is summarized that the spatial spreading is more in case of active and wet phase of MJO (AWMJO), unlike the inactive MJO dry phase (IDMJO), where the rainfall confined in a smaller region.
A negative OLR and SST anomaly along with strong wind circulation observed in case of AWMJO onset years and the pattern is similar in case of IWMJO but completely opposite for supressed (ADMJO and IDMJO) phases. Similar dynamics is also observed in the early onset years and it confirms that active MJO phase leads to an early onset of monsoon in India. Similarly, irrespective of MJO amplitude (active/inactive) with dry phases during onset pentad, it suppress the favourable conditions resulting in late DOM which emphasizes that the phases of MJO plays important role irrespective of the strength of MJO for supporting the conditions for monsoon onset.
Starting from the Indian Ocean, the convective system and so the monsoon rainfall keep propagating in northward direction i.e., towards the Indian monsoon zone known as the progress of ISM and it takes about 45 days to cover the whole country. The concept of MOK-MOR is applied to assess the progress of monsoon strength and the complete rainfall anomaly analysis during this period indicates that the active(inactive) MJO amplitude triggers (supress) the monsoon spread and out of all the active phases of MJO, only phases 3, 4, 6 and 8 supports for a positive rainfall anomaly over the country, resulting normal/excess monsoon year. Various phases and amplitude of MJO has notable effect on the monsoon system, so for better insights, it is important to investigate properly the physics behind this interaction processes and implement the associated dynamics in the numerical and modelling experiments which will provide guidance for accurate and advanced prediction of DOM at optimum leads.
Acknowledgments
The authors acknowledge the NMHS of MoEFCC, Govt. of India and ICPS mission of DST, Govt. of India for funding, IMD for the gridded data,NOAA, NCEP for the reanalysis data and Head, CSIR-4PI for support.
Data availability statement
All data that support the findings of this study are included within the article (and any supplementary files).
Conflict of interest
The authors declare that they have no known competing interests
Funding
This work is supported by the projects funded by the National Mission on Himalayan Studies (NMHS) of Ministry of Environment, forest and climate change(MoEFCC), Govt. of India for the project funding support (grant no: GBPNI/NMHS-2019–20/MG/315).
Supplementary data (2.9 MB PDF)