

Abstract
Decreases in terrestrial near-surface wind speed (NSWS) were documented in many regions over the past decades. Various drivers have been proposed for this terrestrial stilling, such as weakening of ocean-land pressure gradients related to climate change and increased surface roughness linked to vegetation growth; but none have been robustly established as the cause. A plausible reason for this quandary is that the local impact of urbanization on NSWS has been overlooked. Here, we used homogenized NSWS records from in situ weather stations and a satellite-based dynamic urban–rural classification scheme to quantitatively assess the contribution of urbanization to observed terrestrial stilling during 1980–2016 over the Beijing–Tianjin–Hebei region of China. Results suggested that urbanization contributed approximately 8% to the observed decrease in the regional NSWS in urban areas, implying that urbanization played a minor role in terrestrial stilling, even in this rapidly developing region. The largest NSWS changes related to urbanization occurred in winter, followed by spring, autumn, and summer. Urbanization reduced the days with relatively strong winds but increased the days with light and gentle winds. We found that except for the Japanese 55 year reanalysis (JRA-55) dataset, none of the common reanalysis products reproduced the observed NSWS trends in urban or rural areas. However, this could be because of JRA-55's intrinsic negative bias in NSWS trends over land. Thus, regional terrestrial NSWS trends derived from reanalysis products deserve careful examination.
Export citation and abstract BibTeX RIS

Original content from this work may be used under the terms of the Creative Commons Attribution 4.0 licence. Any further distribution of this work must maintain attribution to the author(s) and the title of the work, journal citation and DOI.
1. Introduction
Changes in wind have broad environmental and socioeconomic implications, affecting the air quality in economically developed regions (Cai et al 2017, Pei and Yan 2018), the surface evaporation (Rayner 2007, McVicar et al 2012) and the wind energy resource (Pryor and Barthelmie 2010, Rasmussen et al 2011). As the climate warms, near surface wind speed (NSWS) over land, commonly referred to the 10 m wind speed, has declined over the past decades (Tuller 2004, Smits et al 2005, Mahowald et al 2007, McVicar et al 2008, Pryor et al 2009, Vautard et al 2010, Jiang et al 2010b, Wu et al 2018). Roderick et al (2007) firstly referred to this widespread phenomenon as 'terrestrial stilling'. By synthesizing previous studies reporting NSWS changes around the world, McVicar et al (2012) indicated that the average trend in NSWS was −0.14 m s−1 decade−1 in areas (e.g. North America, Europe, East Asia, Oceania) having more than 30 sites with the length of data more than 30 years.
Observed changes in NSWS in China were consistent with many other mid-latitude regions, featuring a decline over recent decades (Xu et al 2006, Jiang et al 2010b, Niu et al 2010, Fu et al 2011, Guo et al 2011, Chen et al 2013, Lin et al 2013). Previous studies have proposed various large-scale drivers and physical mechanisms to explain the causes of terrestrial stilling in China. Xu et al (2006) and Niu et al (2010) suggested that the NSWS in China, associated with the East Asian monsoon, exhibited declines in either summer or winter, which was probably linked to regional radiative forcing induced by increases in greenhouse gas concentrations and air pollutants. Meanwhile, Fu et al (2011), Lin et al (2013) and Chen et al (2013) suggested that natural climate variability, such as the Pacific Decadal Oscillation and Arctic Oscillation, may be the primary driver for NSWS change in China. Recently, Zeng et al (2019) found a reversal in global terrestrial wind speed and attributed it to internal decadal atmosphere-ocean oscillations. Compared with the strong decline in NSWS observed at in situ weather stations, NSWS trends derived from reanalysis products and radiosonde records are much weaker (Vautard et al 2010, Chen et al 2013, Lin et al 2013). If anthropogenic forcings and natural climate variability are the main causes of NSWS change in China, then reanalysis and radiosonde data should produce similar NSWS changes to ground station observations. In addition, neither global nor regional climate models reproduce the historical NSWS changes over the past decades in China (Jiang et al 2010a, Bichet et al 2012), partly because these state-of-the-art models do not fully take into account the effects of changing surface characteristics in China (Chen et al 2012).
Several studies suggested that weakening NSWS over land can also be ascribed to an increase in surface roughness (Vautard et al 2010, Bichet et al 2012, Wu et al 2016, 2017, Zhang et al 2019b). Vautard et al (2010) suggested that surface roughness increases related to forest growth markedly reduced NSWS by 40%–60% in China during 1979–2008. Bichet et al (2012) also suggested that by only increasing surface roughness in climate models, the observed wind stilling in China could be reproduced. However, it should be noted that an increase in surface roughness may not be primarily or solely caused by vegetation. Using three atmospheric global climate models forced by historical sea surface temperature and sea ice records, Zeng et al (2018) found that the simulations with realistic vegetation changes could not reproduce the observed weakening of NSWS over land, including over China, implying that enhanced vegetation growth was not a primary driver for NSWS changes there. Recognizing the minor role of vegetation growth in the observed declines in NSWS in China, coupled with the knowledge that urbanization can also increase surface roughness, led us to assess the impact of urbanization on terrestrial stilling in rapidly urbanizing regions.
Urbanization modifies NSWS not only by changing surface aerodynamic characteristics, but also through enhancing urban heat island circulation (Bornstein and Johnson 1977). Given that a large proportion of NSWS observations are from meteorological stations located in urban areas, it is pertinent to consider whether the detected NSWS changes were affected by local urbanization. By applying the 'observation minus reanalysis' (OMR) method (Kalnay and Cai 2003), a recent study found that the underlying surface changes close to observing stations, mostly induced by urbanization, contributed mostly to the observed decline in NSWS over East China during 1992–2013 (Li et al 2018). The rationale of the OMR method is that reanalysis data are considered to include 'perfect' large-scale climate change signals but exclude local impacts of land use and cover changes (LUCC). Therefore, the difference between the observed and reanalysis climatic trends can be attributed to the effects of LUCC, such as urbanization. However, Jiang et al (2010b) estimated that the difference in the decline in NSWS between urban and rural stations in China was only −0.01 m s−1 decade−1. It is noted that Jiang et al (2010b) classified urban and rural stations roughly using administrative divisions and hypothesized that urbanization impacts on NSWS for stations in provincial cities and other large cities were more profound than those in small cities and rural areas. However, the local impact of urbanization on NSWS may not be directly related to the extent of whole city, and may be very sensitive to changes in local neighboring environments (Peng et al 2018). In addition, rapid urbanization in China has led to very fast transitions from rural to urban environments around in situ weather stations. These issues can be addressed by adopting a dynamic urban–rural classification scheme, based on high-resolution satellite observations that accurately capture regional spatiotemporal patterns of urbanization within China.
The aim of this study was to quantitatively assess the contribution of urbanization to regional terrestrial stilling in rapidly urbanizing regions. We used homogenized NSWS records from in situ meteorological stations within the Beijing–Tianjin–Hebei region of China and employed a dynamic urban–rural station classification scheme to examine urban–rural contrasts in trends in NSWS for 1980–2016. Specifically, we focused on the seasonality of impacts of urbanization on NSWS and compared frequency changes for different categories of winds. To determine the accuracy of reanalysis products in reproducing the historical NSWS changes, we quantified the uncertainty in long-term NSWS trends derived from different-generation reanalysis products. The rest of this paper is organized as follows. The data and method are described in section 2, and the results are presented in section 3, followed by the conclusions in section 4.
2. Methods
2.1. Observation and reanalysis datasets
Daily NSWS observations for 1980–2016 from 223 national stations in the Beijing–Tianjin–Hebei region (36°N–41°N; 114°E–119°E) were used in this study, compiled by the National Meteorological Information Center of China Meteorological Administration. The raw NSWS time series were quality-controlled and homogenized using the RH-tests version 3 software package (Wang and Feng 2010). The RH-test algorithm contains two change-point detection approaches: a penalized maximum t test and a penalized maximum F test. The former test is good for detecting non-climatic changes (e.g. station relocation, changes in the observing system), when a reference series reflecting the regional NSWS change is available; while the latter test is suitable for sparse observing stations, when a reference series is lacking or distant (Wan et al 2010). Given the high station density in the region, we used a penalized maximum t test that accounts for the first-order autocorrelation to detect the inhomogeneities in individual station NSWS time series, which was further validated by detailed metadata information. Then, quantile-matching adjustment method that takes into account high-order inhomogeneities was applied to adjust the abrupt shifts related to non-climatic changes in NSWS time series. We treated a station as missing, if it had more than 1% missing values (i.e. 365 × 37 × 0.01 ≈ 135 d), and it was discarded from the following analyses. A total of 186 stations were selected. Their individual missing values were replaced by their corresponding climatological means for other available values of this specific calendar day across the entire study period.
To consider the uncertainties in the reanalysis products and their potential capacity to reproduce the regional mean NSWS change, we compared observed NSWS time series with those derived from a variety of different-generation reanalysis products. Table S1 presents the details of these reanalysis products. The first- and second-generation reanalysis products used in this study were from the National Centers for Environmental Prediction (NCEP)/National Center for Atmospheric Research (NCAR) global reanalysis (NCEP-NCAR; Kalnay et al 1996), and the NCEP/Department of Energy (DOE) global reanalysis (NCPE-DOE; Kanamitsu et al 2002), respectively. The third-generation reanalysis datasets were from the European Reanalysis Interim reanalysis (ERA-Interim; Dee et al 2011), the Modern-Era Retrospective analysis for Research and Applications version 2 (MERRA2; Gelaro et al 2017), and the Japanese 55 year reanalysis (JRA-55; Kobayashi et al 2015). The newest generation reanalysis used was ERA-5. We also evaluated three versions of the Twentieth Century Reanalysis, generated by the US National Oceanic and Atmospheric Administration (NOAA; Compo et al 2011). To facilitate comparison, we used a bilinear interpolation algorithm to linearly interpolate the gridded reanalysis monthly mean NSWS time series to the geographical locations of in situ weather stations. The calculation procedure used for the regional mean NSWS time series based on reanalysis was the same as that based on observations.
2.2. Dynamic urban–rural classification scheme
We used satellite-based temporally varying LUCC observations for China to dynamically identify urban and rural stations; these were generated and provided by the Data Center for Resources and Environmental Sciences of Chinese Academy of Sciences (http://resdc.cn/). This dataset was produced, based on the Landsat Thematic Mapper/Enhanced Thematic Mapper satellite images, with high spatial resolutions of 100 m, for seven representative years: 1980, 1990, 1995, 2000, 2005, 2010 and 2015 (Liu et al 2014). Following the methods proposed by previous studies (Ren et al 2010, Ren and Zhou 2014, Liao et al 2018), we calculated the fraction of urban land cover (i.e. built-up areas in cities, counties and towns) for each year within a 2 km circular buffer region surrounding each station. When the urban land fraction of one station exceeded 33%, we treated it as an urban station. Several studies have used this procedure to select the reference stations in China (e.g. Ren and Zhou 2014, Liao et al 2018). Ren and Zhou (2014) suggested that this classification criterion could account for the different influences on station observations from local anthropogenic activities (e.g. urbanization). Temporally, we divided the whole analysis period into seven consecutive episodes: 1980–1989, 1990–1994, 1995–1999, 2000–2004, 2005–2009, 2010–2014 and 2015–2016. We used the urban land fraction in the starting year of each episode to determine the stations' categories (i.e. urban or rural) dynamically. Results of this dynamic urban–rural station classification are illustrated in figure 1.
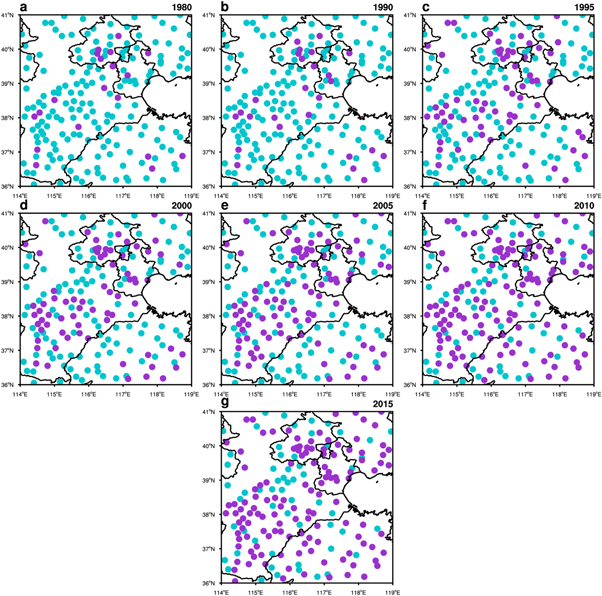
Figure 1. Geographical distributions of urban (purple dot) and rural (green dot) stations in (a) 1980, (b) 1990, (c) 1995, (d) 2000, (e) 2005, (f) 2010, and (g) 2015 within the Beijing–Tianjin–Hebei region of China. The black lines represent the land-sea boundary and the provincial boundaries in the Beijing–Tianjin–Hebei region.
Download figure:
Standard image High-resolution image2.3. Contribution of urbanization to the observed near-surface wind speed changes in urban areas
To eliminate the effect of the climatological mean on the construction of the regional mean NSWS time series, we calculated the daily NSWS anomalies relative to the climatological annual cycle (calculated based on the whole study period) for each station. To estimate the contribution of urbanization to the observed NSWS change in urban areas and eliminate statistical biases linked to the uneven distribution of stations, we divided the region into four 2.5° × 2.5° grids. For each grid, we computed the average NSWS time series separately for urban and rural stations for each episode. Then, according to previous studies (e.g. Mann et al 1998, Cohen et al 2014), we constructed regional mean urban and rural NSWS time series for the Beijing–Tianjin–Hebei region by weighting each grid's time series by the cosine of its latitude. We considered their differences in the long-term (i.e. the period with all the years) NSWS trends as the impact of urbanization in urban areas. To reveal the seasonality of NSWS trends and estimate any related urbanization impacts, we calculated both seasonal mean urban and rural NSWS anomalies time series, based on conventional practice, for winter: December–February; spring: March–May; summer: June–August; and autumn: September–November. A detailed description of this procedure can be found in supplementary note 1, which is available online at stacks.iop.org/ERL/15/034062/mmedia.
2.4. Definition of different categories of windy days
In addition, we estimated the frequency trends for different categories of windy days and quantified their urbanization impacts. We defined light, gentle, moderate, and strong windy days, as days with wind speeds lower than their historical 25th percentile, higher than their historical 25th percentile but lower than their historical 50th percentile, higher than their historical 50th percentile but lower than their historical 75th percentile, and higher than their historical 75th percentile, respectively. We determined these daily-based percentiles for a specific calendar day by sorting historical (1980–2016) 15 d NSWS samples around this day (7 d before and after; reflecting data for 15 × 37 = 555 d). We estimated trends in the regional mean annual frequencies of different categories of windy days for urban and rural stations separately and treated their differences as the impact of urbanization in urban areas.
2.5. Trend estimator and its significance test
We computed observed and reanalysis trends for the regional mean NSWS in urban and rural areas using the non-parametric Theil–Sen's robust linear trend estimator (Theil 1950, Sen 1968) and determined their corresponding 95% confidence intervals based on Hollander and Wolfe (1973). We conducted non-parametric Mann–Kendall tests of the null hypothesis of these trends of each station at the significance level of 0.05 (Mann 1945, Kendall 1975). We also tested the significance of a trend in each kind of regional mean time series and the time series of urban–rural differences at the significance levels of 0.01, 0.05 and 0.1 using the non-parametric Mann–Kendall tests.
3. Results and discussion
3.1. Contribution of urbanization to the observed near-surface wind speed changes in urban areas
An analysis of the long-term linear trends of NSWS indicated a widespread wind stilling over the Beijing–Tianjin–Hebei region over the period 1980–2016 (figure 2(a)). The largest declines exceeding 0.7 m s−1 decade−1 occurred at two stations located within the cities of Beijing and Tianjin. An increase in NSWS was found at a few stations, but of much smaller magnitude. The regional average urban and rural NSWS time series were constructed and their corresponding long-term linear trends were estimated. As figure 2(b) shows, the regional mean annual anomalies of NSWS during 1980–2016 over the urban areas of the Beijing–Tianjin–Hebei region have decreased by 0.93 m s−1. Urbanization should have contributed approximately 8% (0.07 m s−1) to the observed decrease in the regional mean NSWS in urban areas. Thus, the urbanization impact on the observed NSWS change was an order of magnitude less than the terrestrial stilling observed over the last four decades in urbanized areas of this region in China.

Figure 2. (a) Spatial distribution of the long-term linear trends in near-surface wind speed (NSWS) observed at meteorological stations. Crosses show the statistically significant trends at the significance level of 0.05. (b) Time series of regional mean annual anomalies of NSWS observed at urban (purple line) and rural (green line) areas in the Beijing–Tianjin–Hebei region during 1980–2016. Parameter 'b' indicates the linear trends of regional mean urban and rural NSWSs, with their corresponding 95% confidence interval (numbers given in parentheses) and p-values. Dashed line denotes the year of 1995. (c) Correlation between the changes in urban fraction (from 1980 to 2015) surrounding meteorological stations and the trends in annually averaged NSWS. Red line shows the linear regression line. Long and short dashed blue lines encompass the 95% confidence and prediction intervals of the regression, respectively. The linear regression model, the proportion of the variance of Y explained by X (R2), the Pearson correlation coefficient (corr), and its p-value (P) are also shown. The color of each point indicates the urban fraction in 2015 for each station.
Download figure:
Standard image High-resolution imageWe also analyzed the decadal-scale trends in urban and rural NSWSs and compared their differences. We found large differences in the impacts of urbanization on NSWS change between earlier (1980–1995) and later (1996–2016) periods. The contribution of urbanization to the NSWS trend in urban areas was close to zero (0.01 m s−1 decade−1) during the earlier period. However, urbanization-induced NSWS change in urban areas became profoundly negative (−0.11 m s−1 decade−1) during the later period. This implies that urbanization influences on NSWS change during the later period are primarily responsible for the urbanization-related terrestrial stilling in the urban areas of Beijing–Tianjin–Hebei region. This result is consistent with historical urbanization trends in China over the last four decades, in which earlier and later periods witnessed relatively slow and rapid urbanization processes, respectively (Wu et al 2015). As shown in figure S1(a), the later period also showed greater increases in stations' urban land cover ratios than during the earlier period. The consistent trend of observed NSWS in rural and urban areas during the earlier period could partly reflect increasing forest cover (including woodland, shrubland, sparse-forest and other forest lands) during this period in this region (figure S1(b)), which was linked to policy-driven afforestation, with a ban on deforestation and a return of cultivated lands to forests (Liu et al 2008). Related to rapid urban development, the ratio of forest land cover surrounding in situ weather stations decreased during the later period (figure S1(b)), reinforcing urbanization effects. Figure 2(c) shows the correlation between changes in urban land cover fraction surrounding meteorological stations from 1980 to 2015 and the observed trends in local NSWS over the whole study period. We found that there is only a weak correlation between the changes in urban fraction and the local NSWS trends with a small explained variance (only 4.5%), which further suggests that the impact of urbanization on the observed NSWS changes was minor over the last four decades in the Beijing–Tianjin–Hebei region of China.
3.2. Robustness tests
We conducted a series of sensitivity tests to validate the robustness of the estimated contribution of urbanization to the observed regional terrestrial stilling in urban areas (table S2). We first constructed the regional mean urban and rural NSWS time series using a static urban–rural classification scheme. We calculated the urban land-cover ratio within a 2 km circular buffer region surrounding each station for 2015, and considered any station having a fraction of urban land cover of more than 33% as urban during the entire study period. As shown in figure S2(a), the contribution of urbanization to the regional mean urban NSWS trend was estimated to be 20% (−0.20 versus −1.01 m s−1). We noted that the magnitude of the urbanization contribution based on the static urban–rural classification was double that based on the dynamic one. As shown in figure S1(b), this difference could be related to forest growth during the earlier period around stations that became urbanized during the later period. Thus, the effect of forest growth on NSWS at earlier rural stations may be incorrectly ascribed to an effect of urbanization by a static classification scheme.
To test whether the estimated influence of urbanization was sensitive to urban fraction thresholds used in our classification, we recalculated the regional average NSWS time series for urban and rural areas by identifying urban stations as those having an urban land-cover ratio of greater than 20% within a 2 km buffer region. As figure S2(b) shows, we found that urbanization now contributed 11% to the regional mean NSWS trend observed in urban areas (−0.11 versus −0.94 m s−1), which is closer to the initial estimate. In turn, we increased the urban fraction threshold to 40% and found that only 9% (−0.09 m s−1 versus −0.97 m s−1) of the observed wind stilling in urban areas could be ascribed to urbanization in this case (figure S2(c)).
Next, we checked the sensitivity of the estimated urbanization effect on the NSWS trend to changes in the geographical scope of the circular buffer region around each station. We calculated the fraction of urban land-cover within a 1 km circular buffer region surrounding each station and considered any station with an urban fraction of more than 33% as urban. In this case, we found that urbanization only explained a decrease of 0.05 m s−1 in NSWS in urban areas, which was an order of magnitude much smaller than the observed change (−0.92 m s−1; figure S2(d)). Then, we expanded the circular buffer region to a radius of 3-km and computed the urban fraction surrounding each station within this wider geographical scope. By increasing the screening standard around urban stations, we found that the contribution of urbanization to the observed wind stilling in urban areas was approximately 17%, which is slightly higher than the initial estimate (figure S2(e)).
Lastly, we explored the robustness of our results related to filling in missing values. We filled in missing values using a spatial biharmonic spline interpolation of the measurements from other stations. In this analysis, we found that only 8% of the observed NSWS trend could be attributed to the impact of urbanization (figure S2(f)). We also examined the temporal distribution of the missing values for each selected station and found that only three stations have the maximum length of continuous missing values more than or equal to one month (31 d). We removed these three stations in the analysis and found that the re-estimated impact of urbanization (without these stations) is close to that with these stations (−0.0214 versus −0.0189 m s−1 decade−1; figure not shown). We also found the estimated impact of urbanization weighting by the cosine is almost the same as those with equal weights (−0.0189 versus −0.0206 m s−1 decade−1; figure not shown), because the weights' difference between north and south grids is quite small (1.0174 versus 0.9826). Therefore, these robustness tests support the finding that the urbanization effect on the NSWS trend was an order of magnitude less than the terrestrial stilling observed in the urbanized areas of the Beijing–Tianjin–Hebei region over the past four decades.
3.3. The seasonality of urbanization impacts on the observed wind trends in urban areas
As for the annual mean NSWS, all four seasonal mean NSWSs over the Beijing–Tianjin–Hebei region also exhibited a decline during 1980–2016. The largest decreases in regional mean NSWS occurred in spring, followed by autumn, winter, and summer (figure 3). This result is consistent with the findings of Fu et al 2011 and Chen et al 2013, which also showed that spring witnessed the largest decreases in NSWS in China. Jiang et al (2010b) suggested that the NSWS decline in China was minimal in summer, and that winter experienced the most obvious terrestrial stilling, rather than spring. This may be associated with the difference in analysis periods. Jiang et al (2010b) focused on the period of 1956–2004, while this study concentrated on the last four decades. The recovery of the East Asian winter monsoon from the mid-2000s, as outlined by Wang and Chen (2014), may be responsible for the reduced decline in wintertime NSWSs over the past decade.

Figure 3. Linear trends in seasonal mean urban (purple bar) and rural (green bar) near-surface wind speed (NSWS) and their differences (Diff; gray bar) over the Beijing–Tianjin–Hebei region during 1980–2016. The vertical black bars indicate their corresponding 95% confidence intervals. The significances of trends are as follows: ***Significance at the 0.01 level; **Significance at the 0.05 level; *Significance at the 0.1 level. Blank indicates a trend is not significant.
Download figure:
Standard image High-resolution imageAn analysis of urban–rural differences in NSWS trends for each season indicated that the largest urbanization-induced NSWS change occurred in winter, followed by spring, autumn and summer. Here, we propose two hypotheses for the seasonality of urbanization impacts on regional NSWS trends. Given that the influence of large-scale circulation and synoptic systems is much less dominant in summer than in winter, our first hypothesis is that urban breezes, induced by the urban heat island, play a more prominent role in summer in urban areas, negating the barrier effect of urban buildings on NSWS to some extent. Previous analysis based on numerical simulations also found a stronger response of NSWS to urbanization in winter than in summer (Hou et al 2013). Our second hypothesis is that the effect of vegetation growth on NSWS in rural areas is more profound in summer than in winter, because boreal summer (winter) has the highest (lowest) vegetation productivity. A recent study has carried out a month-long simulation using the Weather Research and Forecast model and found that the westerly or northerly wind is decelerated by 0.3–1.5 m s−1 in the western and northwestern Beijing–Tianjin–Hebei region (mostly rural areas) due to the effects of afforestation (Long et al 2018). However, they did not assess the effects of afforestation for all the seasons. To explore the reasons for the seasonality of urbanization impacts on NSWS trends, high-resolution simulations incorporating information on urban developments and seasonal vegetation activities would be needed in further study.
3.4. Urbanization impacts on the frequencies of different kinds of windy days in urban areas
Given that the occurrence of different categories of winds has a great impact on air quality and the installation of wind energy facilities (Shi et al 2019), we analyzed the changes in frequencies of different kinds of windy days and quantified their relationship to urbanization. As shown in figure 4, the frequencies of the days with light and gentle winds have increased over the Beijing–Tianjin–Hebei region during 1980–2016, at the cost of a substantial decrease in the days with strong winds. This indicates that terrestrial stilling over the region was mainly linked to the huge reduction in strong windy days. By comparing the frequency trends for the four kinds of windy days between urban and rural areas, we found that urbanization increased the frequency of the days with light and gentle winds by about 2.0 and 2.6 d decade−1, but reduced the days with strong winds by 4.7 d decade−1 in urban areas. We infer that during strong windy days, the change in NSWS is most likely controlled by large-scale synoptic factors. In these cases, local breezes induced by the urban heat island have a relatively low probability of accelerating air flows within urban areas. In contrast, for days with gentle or light winds, local circulation induced by the urban heat island would play a greater role in NSWS change, increasing the frequency of weaker windy days in urban areas.
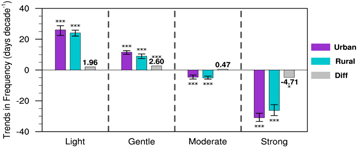
Figure 4. Linear trends in annual frequencies of different categories of winds (light, gentle, moderate and strong) observed in urban (purple bar) and rural (green bar) areas and their differences (Diff; gray bar) over the Beijing–Tianjin–Hebei region during 1980–2016. The vertical black bars indicate their corresponding 95% confidence intervals. The significances of trends are as follows: ***Significance at the 0.01 level; **Significance at the 0.05 level; *Significance at the 0.1 level. Blank indicates a trend is not significant.
Download figure:
Standard image High-resolution image3.5. Comparison of the observed and reanalysis wind trends
In addition to a comparison of urban and rural stations, some studies also used the OMR method to assess the urbanization impact on regional NSWS changes in China (Li et al 2018, 2019). Given that reanalysis products poorly represent many characteristics of historical NSWS changes in many regions (McVicar et al 2008, Pryor et al 2009, Chen et al 2013) as well as existing problems in the rationale of the OMR method (Trenberth 2004, Wang et al 2013, 2018), it is advisable to view the OMR-estimated urbanization contribution to the observed regional NSWS trend in urban areas with caution. To quantify uncertainties associated with reanalysis and assess the reliability of the OMR method in the estimation of the urbanization influence on urban NSWS change, we carried out a detailed comparison of observed NSWS trends with those derived from multiple reanalysis products.
Our results showed that except for JRA-55, none of the reanalysis products produced a similar NSWS trend to the station observations (figure 5). Comparatively, NSWS trends derived from third-generation reanalysis products (i.e. ERA-Interim, MERRA2, and JRA-55) appeared to be closer to the observations than first- and second-generation reanalysis products (i.e. NCEP-NCAR and NCEP-DOE). This difference is probably related to the continued improvements in the representation of critical physical processes in climate models, major advances in the data assimilation algorithms, and the greater number of observations used to produce third-generation reanalysis products (Dee et al 2011, Kobayashi et al 2015, Gelaro et al 2017). However, the regional mean NSWS trend derived from the newest generation reanalysis (ERA-5) was very small, despite its higher spatial resolution and more advanced assimilation system. Because the three versions of the Twentieth Century Reanalysis generated by NOAA assimilate only surface pressure observations and use monthly sea surface temperature and sea-ice distributions as boundary conditions within their climate models, coupled with an assimilation system comprising an ensemble Kalman Filter (Compo et al 2011), the NSWS trends derived from these reanalysis datasets were much weaker (20CRv3) and even positive (20CRv2, 20CRv2c). These results were valid for both urban and rural stations (figure S3).

Figure 5. Linear trends in regional mean near-surface wind speed (NSWS) over the Beijing–Tianjin–Hebei region for 1980–2016, based on station observations (gray bar) and multiple reanalysis products (colored bars). The vertical black bars indicate their corresponding 95% confidence intervals. OBS, observations; NCEP-NCAR, National Centers for Environmental Prediction-National Center for Atmospheric Research global reanalysis; NCEP-DOE, NCEP/Department of Energy (DOE) global reanalysis; ERA-Interim, European Reanalysis Interim dataset; MERRA2, Modern-Era Retrospective analysis for Research and Applications version 2; and JRA55, Japanese 55 year reanalysis; ERA-5, newest ERA dataset; 20CRV2, 20CRV2c, 20CRV3, three versions of the Twentieth Century Reanalysis, generated by the US National Oceanic and Atmospheric Administration. The significances of trends are as follows: ***Significance at the 0.01 level; **Significance at the 0.05 level; *Significance at the 0.1 level. Blank indicates a trend is not significant.
Download figure:
Standard image High-resolution imageAs shown in figure 6, the JRA-55 reanalysis produced a similar NSWS trend to the observations, but exhibited much stronger interannual variability than the observed regional mean NSWS. This could be linked to the JRA-55's intrinsic deficiencies in deriving wind speeds over land. Torralba et al (2017) indicated that the height of the lowest atmospheric level within the JRA-55 climate model and assimilation system tends to be set too high over regions with high vegetation (trees), leading to underestimates of NSWS when interpolating wind speed from the lowest atmospheric level to 10 m altitude.

Figure 6. Time series of observed (black line) and reanalysis-derived (colored lines) regional mean annual anomalies of NSWS over the Beijing–Tianjin–Hebei region over the last four decades.
Download figure:
Standard image High-resolution image
Comparisons of the observed and reanalysis NSWS trends suggested that the reanalysis-based estimates of NSWS trends involved much uncertainty, and that the climate models and assimilation systems used to generate these reanalysis data may have some deficiencies, such as the parameterization of surface layer processes. This implies that the OMR-estimated urbanization contribution to NSWS change was not only related to, but may have been irrelevant to, the impact of urbanization and other land-use changes on the NSWS. Thus, regional terrestrial NSWS trends derived from reanalysis and the OMR-estimated urbanization impacts deserve careful examination.
4. Conclusions
We used a dynamic urban–rural classification scheme to quantitatively assess the contribution of urbanization to the observed NSWS trend in urban areas of the Beijing–Tianjin–Hebei region in China for the period 1980–2016. We analyzed the urbanization impacts on seasonal mean NSWSs and the frequencies of different categories of windy days. Results suggested that urbanization influence only accounted for about 8% of the observed decrease in NSWS over the urban areas of this region. Clearly, the contribution of urbanization to regional terrestrial stilling was an order of magnitude smaller than the observed urban NSWS trend from in situ weather stations. This finding was validated by a variety of robustness tests. Hence, we concluded that urbanization played a minor role in terrestrial stilling, even in rapidly urbanizing regions. In addition, we found that the most profound urbanization effect on NSWS occurred in winter, followed by spring, autumn and summer. Urbanization increased the frequencies of the days with light and gentle winds, at the expense of markedly decreasing strong windy days. Comparisons of the observed and reanalysis NSWS trends indicated that there were large uncertainties in the estimates of regional NSWS trends based on reanalysis data and that the OMR-based assessments of the effects of urbanization on NSWS may have been affected by the intrinsic deficiencies in reanalysis.
The minor role of urbanization in NSWS changes is supported by the spatial incoherence between the rates of urban growth and wind stilling over China and other mid- to high-latitude regions in the Northern Hemisphere. For instance, the distribution of the observed NSWS trends in China (Zhang et al 2019a, 2019b) showed that terrestrial stilling was mainly concentrated in northern and northeastern China, while NSWS changes in the most rapidly urbanizing areas of eastern China (e.g. Beijing–Tianjin–Hebei, Yangtze River Delta, Pearl River Delta, and North China Plain) were relatively small. At the global scale, besides northern China, rapid declines in NSWS were also observed in eastern North America, northeastern Europe, Siberia and even over the Tibetan Plateau (You et al 2014, Zeng et al 2018, Zhang et al 2019b), where urbanization is very slow or negligible. A recent study indicated that decadal-scale variations of NSWS was dictated by internal decadal climate variabilities, rather than by the local impact of urbanization (Zeng et al 2019). This is consistent with our key finding that urbanization played a minor role in terrestrial stilling, even in this rapidly developing region.
There are at least two major limitations of this study. The first one relates to the issue of data accessibility. We only analyzed the NSWS trend in one representative metropolitan region of China. Thus, some findings may be region dependent. Over some highly urbanized regions, such as the city of Beijing, approximately 20% of the regional mean decline in NSWS was found to be caused by urbanization (Li et al 2011). At a larger scale, like the Northern Hemisphere land, the influence of urbanization on NSWS remains to be explored. The second one relates to a need for validation. Because all the analyses performed in this study were based on station observations and reanalysis data, a series of sensitivity experiments using high-resolution regional climate models could be used to confirm the findings of this study.
Despite these limitations, this study rejected the hypothesis that urbanization was a dominant driver of regional terrestrial stilling in the urban areas of the Beijing–Tianjin–Hebei region. Given the minor role of vegetation growth in NSWS change (Zeng et al 2018), it appears that the observed decrease in NSWS over this region was probably driven by the natural internal variability of the climate system and/or large-scale anthropogenic climate changes. In the case of JRA-55 reanalysis, we found that a clear understanding of the interactions and couplings among the surface layer, planetary boundary layer and free atmosphere was a prerequisite to accurately reproduce historical and future NSWS changes. Hence, further efforts should be focused on conventional climate model development to address their deficiencies in representing critical processes.
Acknowledgments
We thank the China National Meteorological Information Center and various global atmospheric reanalysis centers for making observational and reanalysis datasets publicly available. This study was supported by the National Natural Science Foundation of China (41705061) and the National Key R&D Program of China (2018YFC1507700). JF and ZY also acknowledge support from the National Key R&D Program of China (2016YFA0600400), while JF also was supported by the National Natural Science Foundation of China (41875134).
Data availability statement
The data that support the findings of this study are available from the corresponding author upon reasonable request.