

Abstract
Terrestrial ecosystem gross primary productivity (GPP) is the largest land-atmosphere carbon flux and the primary mechanism of photosynthetic fixation of atmospheric CO2 into plant biomass. Anomalous rainfall events have been shown to have a great impact on the global carbon cycle. However, less is known about the impact of these events on GPP, especially in Africa, where in situ observations are sparse. Here, we use a suite of satellite and other geospatial data to examine the responses of major ecosystems in Africa to anomalous rainfall events from 2003 to 2017. Our results reveal that higher-than-average groundwater storage in tropical ecosystems offsets the rainfall deficit during the dry years. While the inter-annual variations in GPP in semi-arid ecosystems are controlled by near surface soil water, deeper soil moisture and groundwater control the inter-annual variability of the GPP in dense tropical forests. Our study highlights the critical role of groundwater in buffering rainfall shortages and continued availability of near-surface water to plants through dry spells.
Export citation and abstract BibTeX RIS

Original content from this work may be used under the terms of the Creative Commons Attribution 4.0 licence. Any further distribution of this work must maintain attribution to the author(s) and the title of the work, journal citation and DOI.
1. Introduction
Plant response to climate variability and available water vary according to their hydraulic traits and life history strategies (McDowell et al 2008, Poorter et al 2010, Blackman et al 2019). In some tropical regions, plants have evolved mechanisms to cope with seasonal drought, such as deep roots and hydraulic redistribution, enabling access to groundwater (Nepstad et al 1994, Jipp et al 1998). The availability of water from deeper soil and groundwater sources enables plants in humid climates to maintain photosynthetic activity during the dry season characterized by lower rainfall intervals (Gou et al 2015, Barbeta and Peñuelas 2017, Koirala et al 2017, Pierret and Lacombe 2018), which directly affects net terrestrial carbon uptake (Humphrey et al 2018). However, plant productivity response to total available water (soil moisture (SM) to groundwater) and the way these pools regulate plant productivity remains uncertain.
It is estimated that shallow groundwater influences 22%–32% of the global land area (Fan et al 2013), and this ecologically available water has been shown to impact plant activity and vegetation structure (Orellana et al 2012, Rossatto et al 2012). While the effects of rainfall on plant productivity especially during El Niño–Southern Oscillation (ENSO) phases are well studied (Adams and Piovesan 2005, Raupach et al 2008, Phillips 2009, Phillips et al 2010, Zhao and Running 2010, Liu et al 2017), there is still lack of understanding regarding the influence of total plant-available water on ecosystem productivity during significant meteorological conditions in drier climates such as Africa, where seasonality in productivity is largely related to soil water content (Madani et al 2017a).
African ecosystems, including drylands that cover the majority of the land area (Bastin et al 2017), have received significant attention due to their influential role in affecting inter-annual variability in global productivity and the terrestrial carbon sink (Poulter et al 2014, Ahlström et al 2015), which has been attributed to inter-annual rainfall fluctuations. While the impact of rainfall anomalies on plant activity is well documented over South America, and to a lesser extent over Southeast Asia (Phillips et al 2009, Wooster et al 2012, Doughty et al 2015), much less is known about the response of African ecosystems, despite the important role of African forests in the global carbon cycle (Williams et al 2007, Williams et al 2008a, Ciais et al 2011).
In this research, we seek to investigate the response of African forest gross primary productivity (GPP) relative to variability in rainfall, with consideration of the effect of SM and groundwater storage. While SM influences canopy stomatal conductance and is essential for modelling plant responses to drought (Baldocchi et al 2010), it is currently poorly constrained in the majority of ecosystem models (Stocker et al 2018). One exception is the level 4 carbon product (L4C) generated by the NASA Soil Moisture Active Passive (SMAP) mission (Jones et al 2017). To clarify the influence of climate variability on the African ecosystem productivity, we used the L4C GPP algorithm (see methods) driven with model-based retrospective SM inputs to estimate ecosystem GPP from 2003 to 2017. Specifically, we examined the GPP response over three years (2005, 2010 and 2015) with below- or above-average annual rainfall across Africa and quantified the role of available water on GPP. These events characterized as ENSO, occurred at roughly five-year intervals and significantly affected rainfall patterns throughout the continent. In Africa, ENSO is not the only factor affecting annual rainfall fluctuations. The variability in sea surface temperature (SST) creates complex climatic conditions affecting monsoons, moisture convergence and convective activity (Williams et al 2008b, Ummenhofer et al 2009, Pomposi et al 2018), consequently impacting rainfall and GPP of terrestrial ecosystem across the continent. Rainfall patterns in Africa are also sensitive to other landscape factors such as vegetation cover, land surface albedo, and SM (Koster et al 2004, Paeth and Friederichs 2004). It is expected that the improved L4C model, which links GPP with SM availability and other environmental restrictions to growth, can help clarify the productivity response of ecosystems relative to changes in plant-available water.
The L4C framework uses a light use efficiency (LUE) model to derive daily GPP using the fraction of absorbed photosynthetically active radiation (FPAR) (Myneni et al 2015) observed by the moderate resolution imaging spectroradiometer (MODIS) instrument on NASA's Terra satellite. Other LUE model inputs include daily minimum air temperature, atmospheric vapor pressure deficit (VPD), and photosynthetically active radiation (PAR) from the MERRA-2 (Gelaro et al 2017) global reanalysis, and daily root zone (0–1 m depth) SM inputs from the SMAP Nature Run dataset (Reichle et al 2017). The VPD and SM inputs to the LUE model define respective atmospheric moisture demand and soil water supply restrictions on GPP, while the model environmental response characteristics are calibrated from global FLUXNET observations (Jones et al 2017).
We used a number of other observational datasets to analyze how water scarcity and availability at below surface and deeper soil and groundwater storage can affect inter-annual variability and seasonality of GPP in Africa. These data are independent from the L4C model and included monthly rainfall from the Climate Hazards Group Infrared Precipitation with Station (CHIRPS) product (Funk et al 2015), root zone SM from the Famine Early Warning Systems Network (FEWS NET) Land Data Assimilation System (FLDAS; McNally et al 2017), and terrestrial water storage (TWS) from the Gravity Recovery and Climate Experiment (GRACE) satellite record (Zhao et al 2017). We also used the ensemble mean GPP of five dynamic global vegetation models (DGVMs) from the TRENDY-v7 project (Sitch et al 2015, Quéré et al 2018), and satellite-observed solar-induced chlorophyll fluorescence (SIF; Köhler et al 2015) as an additional remote sensing indicator of ecosystem productivity to compare with the L4C GPP results.
2. Methods
We used the SMAP L4C algorithm to estimate daily ecosystem GPP from 2003 to 2017 at 9 km resolution (Jones et al 2017). The L4C GPP model uses an LUE model framework similar to NASA's MODIS MOD17 (Running et al 2004, Zhao et al 2005), while including an explicit water supply constraint on GPP derived from below-surface to root zone (0–1 m depth) SM information, and an improved model parameterization and calibration using historical tower C-flux measurements from global FLUXNET sites (Baldocchi et al 2001). L4C GPP (gC m−2 d−1) is modeled using the following LUE approach:

where PAR represents photosynthetic active radiation, FPAR (Myneni et al 2015) inputs are provided from MODIS (MOD15 C6) to define vegetation and canopy conditions, and  is a fixed maximum LUE parameter defined for different plant functional types (PFTs) under non-limiting environmental conditions. The
  parameter is a scalar multiplier (0–1) representing land cover specific responses to environmental limitations on plant growth that reduce the estimated photosynthetic LUE from its potential
  due to sub optimal VPD,
  and root zone SM, as well as frozen temperature (FT) constraints (2).
  is defined as the product of equally weighted scalar multiplier values for VPD,
  SM and FT:

To drive the L4C GPP algorithm, we used 2003–2017 daily meteorology inputs from the MERRA-2 global reanalysis (Gelaro et al 2017), SM inputs from the SMAP L4SM Nature Run (NRv4) records (Reichle et al 2017), and FPAR inputs from the MODIS (C6) observational record (Myneni et al 2015). The daily PAR data used for the L4C GPP calculations were obtained from MERRA-2 and used to calculate changes in incoming solar radiation forcing over the study period. We also used MODIS 8 d FPAR high-quality pixels to analyze the observed vegetation greenness changes during the study period. The L4C GPP data used in our analysis differs from NASA's SMAP L4C operational product by not incorporating the land surface model assimilation of SMAP brightness temperature retrievals, which are only available from early 2015 to the present.
Monthly rainfall data were obtained from the CHIRPS product (V.2; Funk et al 2015). The specific product used in this research provides monthly 0.05 degree spatial resolution rainfall data based on satellite derived (Tropical Rainfall Measuring Mission Rau et al 1982 Multi-Satellite Precipitation Analysis V.7) rainfall estimates and interpolated gauge products over Africa (Funk et al 2015). The monthly GRACE TWS data used in the analysis are gridded to a consistent 3° by 3° spatial resolution and extend from 2003 to 2016 (Zhao et al 2017). As an independent SM record, we used the FEWS NET Land Data Assimilation System's (FLDAS; McNally et al 2017) 100–200 cm root-zone monthly SM record with 0.1° spatial resolution.
We used simulations of five DGVMs from the TRENDY v7 ensemble (CLM5, ISAM, OCN, LPJ, and VISIT) with 0.5 to 1° spatial resolution for the period 2003–2017 (Sitch et al 2015, Quéré et al 2018). The selected models account for climate, land use, and CO2 forcing effects on ecosystem productivity. We used global daily satellite observations of SIF from the ESA GOME-2 satellite extending from 2007 to 2017 (Köhler et al 2015). We aggregated the daily SIF data to a monthly 0.5° spatial resolution as an observational GPP proxy for comparison with the L4C GPP record. The GOME-2 SIF data have been shown to have high correlation with plant photosynthetic activity (Guanter et al 2014, Joiner et al 2014, Walther et al 2015, Yang et al 2015, Madani et al 2017a), and provide an independent validation of the effects of bioclimatic factors on ecosystem productivity (Madani et al 2017a). SIF is an electromagnetic wave emitted during plant photosynthesis in the 650–800 nm spectral range and is based on the principle that PAR absorbed by the leaf is re-emitted as light in the form of chlorophyll fluorescence as a byproduct of photosynthesis (Maxwell and Johnson 2000). GOME-2 SIF observations are known to experience artifacting in data retrieval after mid-2012 due to sensor degradation (Zhang et al 2018). To mitigate this problem, we corrected the drift in time series data by matching the mean of observations after mid-2012 relative to values before that period. Here, GOME-2 SIF and TRENDY GPP are used for comparison and diagnosis of L4C GPP results.
We calculated the anomalies in time series data by subtracting the mean seasonal cycle, and removed the trend using linear regression. We also aggregated the monthly data to annual scales to assess inter-annual variability. The temporal correlation between inter-annual variability of GPP, SM, GRACE TWS and rainfall anomalies was assessed using Pearson's correlation (r) at pixel level over the study period and for three major ecosystems defined by the PFT land cover classification (Sahel, southern savannas, and rainforests, tropical and sub-tropical). A cross-correlation analysis with 24-month time lag was performed to analyze the memory effect of available water on the L4C-GPP time series data.
In order to analyze the factors controlling inter-annual variability in GPP we regressed the residuals of the linear regression between L4C GPP and CHIRPS rainfall with the independent FLDAS SM and GRACE TWS datasets.
We focused on three significant climate events (Climate Center Prediction Team 2018) occurring over the study domain in 2005, 2010, and 2015 and estimated the associated annual GPP and climate anomalies from the available datasets relative to their total available length of record over the 2003–2017 period. The MODIS MOD12Q1 (Type-5) PFT land cover classification (Friedl et al 2010) was used to analyze regional productivity anomalies within the major vegetation classes relative to water supply changes from SM, TWS and rainfall. In this regard, the grasslands (GRA) and shrub lands (SHR) classes were merged into a broader savanna category to analyze the GPP anomalies. Monthly SST records (Clayson and Brown 2016), were used to clarify the influence of regional SST anomalies on GPP over Africa, and for additional insight on regional climate variability.
3. Results and discussion
3.1. Continental-scale rainfall and inter-annual variability in GPP
The African continent receives highly variable rainfall spatially and temporally, with an annual mean and standard deviation of 660 ± 80 mm. Spatial variability in rainfall is highest in SHR, where average annual rainfall is 600 ± 450 mm. On a temporal scale, the highest annual rainfall in the study period was 690 mm and occurred in 2010, categorized as a strong El Niño year (figure 1(a)). In 2005 and 2015, annual rainfall was low by 69 mm and 64 mm than the 2003–2017 average respectively. Annual rainfall variability in Africa shows an inconsistent response to El Niño and La Niña climate oscillations indicated by the Oceanic Niño Index (ONI; Climate Center Prediction Team 2018). In Africa, El Niño events and associated SST anomalies are not the only factors that influence rainfall variability. The Indian Ocean dipole, African and tropical easterly jets, and the Saharan heat low also influence atmospheric circulation patterns and rainfall variability in Africa (Black 2005, Parhi et al 2016).
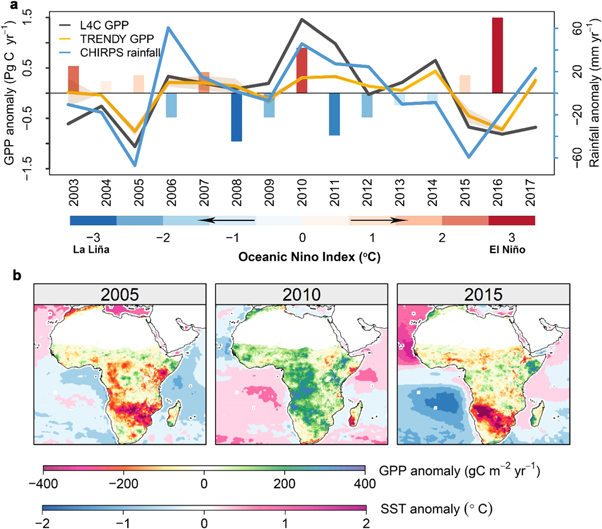
Figure 1. Effect of ENSO on annual GPP of African ecosystems. (a) Anomaly in cumulative annual GPP from L4C (black line) and TRENDY models (orange line; shading shows inter-model standard deviation) and annual rainfall (blue line) in Africa for the 2003–2017 study period. Overlaid is the Oceanic Niño Index bar plot (Climate Center Prediction Team 2018) showing the intensity and status of El Niño warm and La Niña cool phases on a monthly basis. Values above 0.5 represent El Niño and values lower than −0.5 represent La Niña events. (b) Spatial pattern of L4C annual GPP anomaly for El Niño years 2005, 2010 and 2015, and the associated regional SST anomalies.
Download figure:
Standard image High-resolution imageIn 2005, the SST was lower than average over the adjacent South Atlantic and Indian Oceans, resulting in reduced rainfall across Africa (figure 1(b)). In 2010, high SSTs over the South Atlantic Ocean coincided with enhanced annual rainfall and productivity over a majority of the vegetated area of Africa. In 2015, low SSTs over the South Atlantic Ocean were associated with reduced rainfall in the southern savannas of Africa.
The L4C data record indicated that African ecosystems contribute approximately 20% (26.5 ± 0.8 Pg C yr−1) to the total annual global terrestrial GPP. The TRENDY models estimated an annual GPP of 27.4 Pg C yr−1, close to that of L4C GPP but with lower inter-annual variability (±0.5 Pg C). The L4C GPP inter-annual variability is closely related to rainfall patterns (r2 = 0.45, p < 0.05). The TRENDY GPP models showed more agreement with annual rainfall patterns (r2 = 0.57, p < 0.05) than the L4C GPP estimates, suggesting that rainfall plays a leading role in determining inter-annual variations in TRENDY model GPP for African ecosystems. Unlike TRENDY models, the L4C GPP uses the satellite-derived FPAR observations and describes the response of GPP to climate by including water (both SM and VPD) and temperature constraints to limit the LUE photosynthetic carbon assimilation rate (see Methods).
The L4C GPP anomalies showed that the largest reduction in annual GPP for Africa occurred during 2005 (−1.06 Pg C), which was a relatively weak El Niño year (Climate Center Prediction Team 2018; figure 1(a)). In contrast, the 2010 El Niño event was stronger, and coincided with positive rainfall anomalies over much of Africa; 2010 was also the most productive year of the study period (figure 1(b)). Our analysis suggests that African ecosystems respond differently to individual El Niño events (Asefi-Najafabady and Saatchi 2013), with contrasting impacts on the continental scale carbon balance. During 2010, we found widespread increases in productivity except for portions of southern Africa, the Horn of Africa and eastern Sahel. In 2005 and 2015, reduction in rainfall in southern savanna ecosystems represented by shrubs and grass in the MODIS MOD12 PFT classification substantially reduced GPP (figure 1(b)). In 2010, rainfall was on average 55 mm higher than the 2003–2017 annual mean, while TWS was higher by 21.9 mm, FPAR was 0.9% higher and PAR was 1.2% lower than corresponding 2003–2017 annual mean values. In 2004 and 2005, respective reductions in rainfall of 53 and 48 mm coincided with an average 23.3 mm reduction in TWS. This change in water availability is associated with a ∼1.5% reduction in FPAR while PAR increased by 2.5%.
Generally, GPP in African ecosystems appears to follow rainfall anomalies and there are spatial patterns in rainfall anomalies that affect the plant response to water availability or scarcity (figures S1 and S2, available online at stacks.iop.org/ERL/15/034063/mmedia). Partitioning the anomalies in L4C GPP and rainfall by PFT revealed that in tropical ecosystems, the reduction in GPP from 2003 to 2005 coincided with lower-than-average rainfall prior to the year 2005 (figures 2(a), (c)). However, the significant rainfall reduction in tropical ecosystems in 2015 had little apparent effect on GPP, which remained near average levels in the years following 2010 (figure 2(a)). In 2005, L4C GPP for African tropical evergreen broadleaf forests (EBF) was 6.39 Pg C yr−1, while in 2010, EBF GPP increased to 6.82 Pg C yr−1. During the 2015 low rainfall conditions, EBF GPP was 6.51 Pg C yr−1, and thus still 0.1 Pg C yr−1 higher than the 2003–2017 mean value. African rainforests (as defined by the EBF classification) show two rainy season peaks, one from March to May and the other from September to November (figures S3 and S4). GPP tends to increase during the wet season, consistent with previous reports that productivity of African rainforests are more water-limited than light-limited on a regional basis (Guan et al 2015, Madani et al 2017a).

Figure 2. Anomalies in annual GPP and rainfall by land cover class. (a) Anomaly in annual L4C GPP in Africa for evergreen broadleaf forests (EBF), deciduous broadleaf forests (DBF), shrub lands (SHR), grasslands (GRA) and croplands (CRO). (b) Anomaly in annual GPP from ensemble mean of five DGVM models from the TRENDY project. (c) Annual rainfall anomaly in Africa calculated for each land cover class. (d) Land cover classification defined by MODIS-MOD12Q1 (Type-5) PFT land cover classification (Friedl et al 2010).
Download figure:
Standard image High-resolution imageThe GRACE TWS data for the year 2015 indicated that the groundwater level in tropical rainforests of Africa was 14.1 mm above the average. Meanwhile, the EBF canopy FPAR observed by the MODIS instrument, was on average about 2% higher in 2015, even though PAR was slightly lower than the average (∼1%).
Among the different biomes, grasslands in semi-arid savanna ecosystems show a relatively rapid response to changes in rainfall. In 2005, GPP of the grassland biomes declined by 8% (−0.6 Pg C yr−1), while for the relatively wet year of 2010, GPP increased by 5.8% (+0.49 Pg C yr−1). GRAs show the highest GPP variability, with an annual average of 7.97 ± 0.9 Pg C yr−1. SHRs have higher GPP variability (4.22 ± 0.54 Pg C yr−1) than the denser forest ecosystems, including EBF (6.51 ± 0.26 Pg C) and DBF (4.1 ± 0.27 Pg C yr−1); whereas CROs show the lowest productivity and annual variability (3.35 ± 0.19 Pg C yr−1).
The TRENDY model GPP pattern for African biomes follows regional rainfall anomalies and in general agrees with the L4C GPP record, but with less variability (figure 2(b)). However, the TRENDY models showed a 0.04 Pg yr−1 reduction in EBF GPP in 2015, suggesting that there are mechanisms in ecosystem water availability modulated by groundwater that are reflected in the L4C model, but missing from the TRENDY models. The L4C and TRENDY models show similar seasonal patterns, but with smaller TRENDY GPP seasonal variation over tropical ecosystems compared to satellite observations of SIF and the modeled L4C GPP (For a comparison between seasonality in the L4C and TRENDY GPP with SIF, FPAR, PAR and environmental multipliers used in L4C LUE model, refer to figure S3 in the supplementary material).
3.2. Impact of water availability on regional GPP
To better understand the L4C GPP anomalies in different biomes across Africa, we focused on three major regions with different environmental conditions and climate seasonality, including (i) tropical and sub-tropical ecosystems with EBF and DBF PFTs falling between 10o S and 10o N; (ii) the Sahel, which is characterized by SHR and GRA PFTs; and (iii) southern savannas with GRA and SHR PFTs falling below 25o S. We ignored CRO to eliminate the effect managed water on productivity.
In 2015, lower-than-average (2003–2017) rainfall in tropical and sub-tropical regions was offset by above-average TWS levels persisting from the net anomalously wet conditions in the 5 preceding years (figure 3). This reduced the negative impact of the 2015 rainfall deficit on GPP. While we observed a positive impact of deep soil water availability on plant productivity, it has been reported that the plants' increased photosynthetic activity can deplete the groundwater storage (Koirala et al 2017). This may explain the reduction of groundwater storage in tropical regions after the highly productive years of 2008–2010. Additionally, trees with conservative water-use behavior may maintain a low productivity level in order to conserve groundwater and maintain persistent productivity levels during drought events (Teuling et al 2010). This behavior might also explain the conservative tropical photosynthetic activity from 2014 to 2016, when TWS was above average. On the other hand, the reduction in TWS between 2010 and 2012 might be attributed to plants' increased evapotranspiration and productivity, suggesting that deep soil water has been used by plants during this rather dry period (Guan et al 2014, Tian et al 2018).
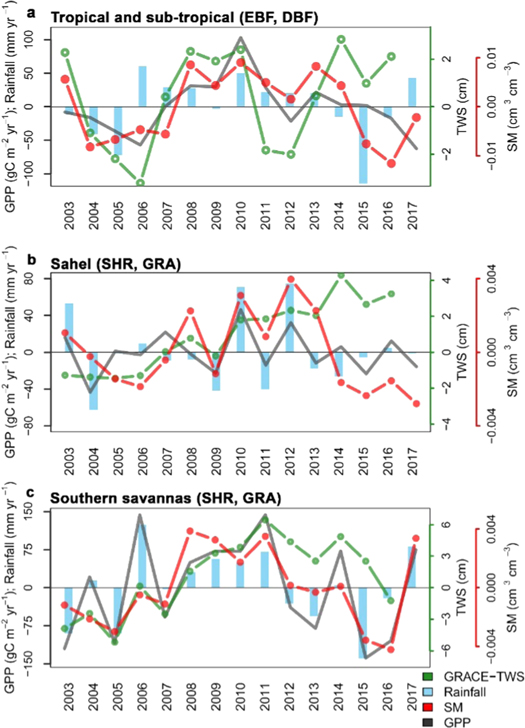
Figure 3. Regional analysis of changes in productivity and ecosystem water balance. Anomalies in rainfall, GPP, root zone soil moisture (SM), and total water storage (TWS) in three major ecosystems, including (a) tropical and sub-tropical forests, (b) the Sahel and (c) southern savannas.
Download figure:
Standard image High-resolution imageIn the dry regions of the Sahel and southern savannas, GPP inter-annual variability is strongly correlated with rainfall patterns (Pearson correlation of 0.67 and 0.84, respectively). The southern savannas showed a strong GPP response to inter-annual SM and rainfall variability, even though TWS was also highly correlated with the GPP anomalies. GPP inter-annual variability in the southern savannas shows higher correlation with SM compared to the Sahel region (r = 0.51 versus r = 0.20), suggesting that in southern savannas below-surface water has a great influence on ecosystem GPP. As shrubs in water-limited environments can be deeply rooted (Jackson and Jackson 2002), GPP seasonality in southern savannas is also well correlated (r = 0.7) with groundwater seasonality. As TWS includes both SM and groundwater (Tapley et al 2004), the high correlation of savanna inter-annual variability of GPP with TWS may be more related to variations in SM than to deeper groundwater variations. Even though shrub dominated southern savannas have access to groundwater, the GPP in this region has more variability than that of the grasslands of the Sahel. One explanation is that plants in more arid climates are closer to their limits of climatic tolerance and show higher drought stress as compared to vegetation in wetter environments (Young et al 2017). In 2015 in the southern savannas, the strong rainfall reduction by 145 mm coincided with on average 3.5% less FPAR, while PAR increased by about 0.4%. In 2010, FPAR in the Sahel was ∼2.4% above-average and at its highest level for the study period. The FPAR increase coincided with 70 mm higher than average rainfall in this region, which led to an approximate 4% reduction in PAR.
To analyze how GPP is affected by water availability memory, we performed a lagged-correlation analysis between water availability indicators and the L4C GPP. Our results revealed that in tropical ecosystems, annual GPP anomalies directly correlate with inter-annual variation in TWS and SM (figure 4(a)). However, the tropical GPP-rainfall correlations are greater over a 16–20 months time-lag, which may explain the 2015 increase in productivity despite significant reduction in rainfall, as well as reduced productivity in 2006 and 2017 despite greater rainfall in those years. On the other hand, TWS shows direct correlation with GPP, but there is a time-lag between rainfall and TWS recharge (figure 3(a)). This time lag may be attributed to two-way interactions between GPP and TWS and loss of TWS as a result of increased plant activity (Tian et al 2018). It has been shown that plant use below surface SM and TWS to maintain their photosynthetic activity during the entire dry season and rain-free periods (Guan et al 2014, Tian et al 2018). This water use strategy among tropical trees has been documented, where they use the available water to flush new leaves during the dry periods (Reich 1995, Chapotin et al 2006, Tian et al 2018).
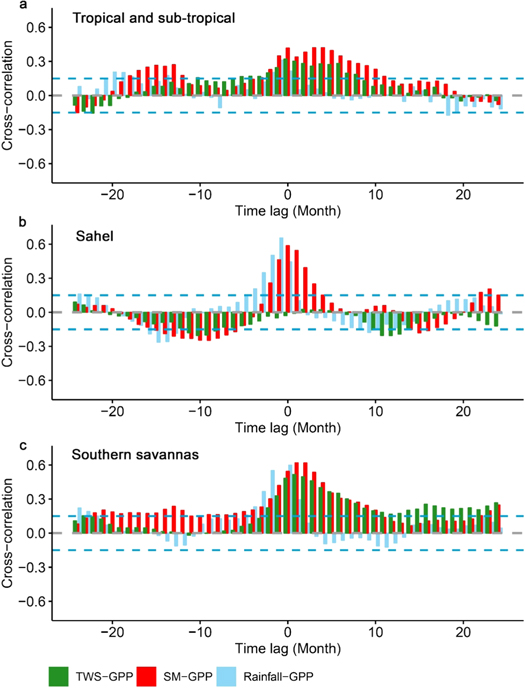
Figure 4. Cross-correlation analysis of time lag effects of TWS, SM, and rainfall on GPP. Time series anomaly in monthly GPP, SM, and rainfall along with GRACE TWS in three major ecosystems in Africa were analyzed to define the time lag between water availability and GPP response. Blue dashed lines represent 95% confidence intervals.
Download figure:
Standard image High-resolution imageSavanna ecosystems in the Sahel, on the other hand, show significant response to rainfall and SM with no time lag. Southern savanna GPP also corresponds to rainfall patterns with little or no time lag, even though the variability in SM and groundwater also plays a major role in explaining the annual variation in GPP (figures 4(b), (c)). Semi-arid lands play a significant role in the global carbon cycle, as they control inter-annual variability in global productivity (Poulter et al 2014, Ahlström et al 2015, Haverd et al 2016). Higher GPP variability and sensitivity to rainfall in savanna ecosystems is consistent with the strong sensitivity of southern savannas to soil water content (Madani et al 2017a).
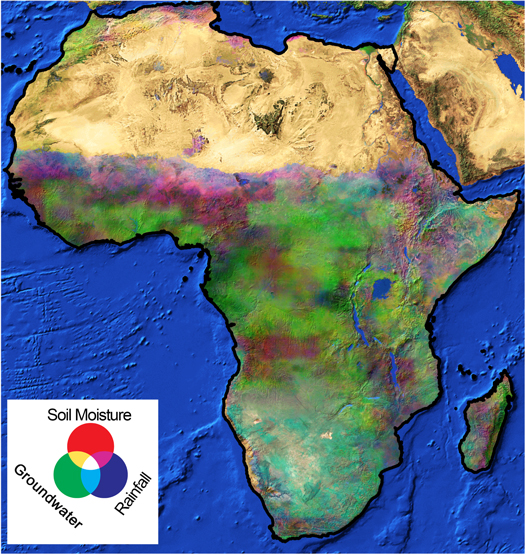
The long-term variability in annual GPP relative to annual variations in SM, groundwater and rainfall, and the relative spatial pattern of the correlations, is specified in an RGB map (figure 5). The partial correlation results reveal that in the wet tropical regions including central Africa, most of the variation in annual GPP is related to changes in groundwater storage. In southern Africa, variability in GPP is strongly related to changes in annual rainfall, even though groundwater and SM also have strong influence on GPP variability. In the Horn of Africa, eastern coasts and central Sahel, GPP variation is highly correlated with SM. The resulting pattern of regional influence shows that SM, groundwater, and rainfall interact in complex ways to control the inter-annual variation in productivity in Africa, even though the amount of variation in productivity is higher and more pronounced in semi-arid GRA and SHR regions.
Figure 5. The effect of variability in different types of water resources on GPP annual anomaly in Africa. The plot shows the relative influence of soil moisture (red), groundwater (green) and rainfall (blue) in each pixel within vegetated areas of Africa on inter-annual variability of GPP. The interactions of different colors indicate the relative influence of two or three water resources on GPP.
Download figure:
Standard image High-resolution image
Our analysis of the effect of rainfall on GPP demonstrated that every ecosystem in Africa shows a positive response to rainfall, except in some wet tropical regions covered by EBF where productivity declines with additional rainfall (when rainfall exceeds 1800 mm yr−1), likely due to reduced light availability under greater cloud cover (figure S5). The total area of the vegetated regions receiving more than 1800 mm annual rainfall represents approximately 6.7% of the total land area of Africa and falls within the rainforest biome. The average rain use efficiency (GPP/rainfall) in Africa is 1.44 ± 0.08 gC mm−1 and varies conservatively across the different land cover types, whereby dryland shrubs have the greatest efficiency (1.55 gC mm−1) and moist EBFs have the lowest efficiency (1.39 gC mm−1; figure S6).
3.3. Below-surface water control on inter-annual GPP
To further understand the response of African ecosystems to plant-available water, we separated the effect of rainfall on GPP variability by regressing the residuals of the rainfall-GPP relationship with GRACE TWS and FLDAS SM (figures S7(a), (b)) used as independent proxies for available water. We also looked at the same relationships between rainfall, SIF, TWS and SM (figures S7(c), (d)). We found that in central Africa (tropical and sub-tropical regions) annual GPP variability, when separated from a rainfall effect, strongly correlated with TWS and SM, while groundwater still has a major role in explaining some of the GPP variability in the southern savannas. The SIF-TWS relationship shows similar patterns as GPP-TWS even though there is some mismatch between the two datasets, which may be due to the different periods of record between GOME-2 SIF and GPP, and lower resolution and higher noise in the SIF signal. The spatial pattern examined indicated that below-surface water and rainfall interact in complex ways to control the inter-annual variation in GPP in Africa, with more pronounced variability in the semi-arid regions (GRA and SHR).
In 68% of the vegetated area, the GPP inter-annual variation is highly correlated with groundwater variability, making it the most important factor controlling GPP in Africa. This is in line with previous reports that the atmospheric CO2 growth rate is partly controlled by anomalies in TWS (Humphrey et al 2018).
The direct relationship between annual anomalies in rainfall and TWS with GPP and SIF in tropical and sub-tropical regions indicate that the GPP in these regions is enhanced by greater rainfall and groundwater availability (figure S8). However, when rainfall is below average a positive signal in GPP is related to higher than average TWS. SIF follows the same pattern as GPP with the exception of reduction in SIF signal as a result of high precipitation, highlighting the role of groundwater storage in moderating the effect of drought in the dense forests of Africa.
There have been increasing attempts to add groundwater information to Earth system models (Barbeta and Peñuelas 2017). Remote sensing-driven LUE models can capture temporal information about plant phenology and canopy photosynthetic capacity with relatively high spatial resolution, which can indirectly reflect the influence of available water on photosynthesis. The anomalous 2015 El Niño year in Africa highlights the importance of soil water memory, as it was detected by changes in remote sensing vegetation indices and the fluorescence signal observed by GOME-2 (figure S9(a)). The TRENDY ensemble models describe the effect of rainfall reduction on GPP, but do not show the effect of available soil water as inferred from the satellite record (figure S9(b)). This may also be due to oversensitivity of the models to atmospheric CO2 concentrations (Smith et al 2016); once we removed the seasonality and trend, the inter-annual variability in TRENDY GPP was lower compared to L4C GPP results.
Plants in humid tropics are less sensitive to climate anomalies (Reich 1995, Zhang et al 2016). However, significant changes in water balance can influence plant phenology and productivity (Reich 1995, Guan et al 2014), and here L4C GPP shows higher sensitivity to changes in water balance than do Earth system models. Our results also demonstrate differences in the response to variations in water availability between savanna and tropical forest ecosystems. While GPP inter-annual variability in tropical forests is more correlated with deep soil water, savanna ecosystems exhibit a mixed response to all water sources from SM to groundwater (figure 5), which may be due to species with diverse functional traits.
Savanna ecosystems of Africa are covered by grass and tree species, while woody cover tends to decline with more frequent yet less intense rainfall events (Good and Caylor 2011). Here, we analyzed ecosystems at regional scales; however, to better understand different plant water use strategies, we recommend monitoring plant species based on their key life history traits. Plants exhibit different strategies in the face of dry conditions. For example, anisohydric species are at risk of hydraulic failure as a result of xylem cavitation while isohydric species regulate stomata and thereby maintain plant water potentials to avoid cavitation, but are at risk of carbon starvation from depletion of carbohydrate reserves (Sala et al 2012, Klein 2014, Sankaran 2019). Here, we focused on periods where annual rainfall was lower than its annual average and not specifically on drought. Future studies could focus on the response of ecosystems in savanna and tropical regions during dry conditions with respect to total available water and their life history traits and drought tolerance strategies.
Overall, our results indicate that the anomaly in TWS determines the net balance between water availability and water loss and highlight the critical role of TWS in buffering rainfall shortages and ensuring continued availability of near-surface water to plants through dry spells.
4. Conclusion
Our analysis showed that rainfall anomaly patterns in Africa are different among El Niño years, and that rainfall is not the only water supply factor controlling inter-annual variability in GPP in Africa. In tropical regions, persistent dry conditions may have greater influence on GPP than reduced rainfall from a single strong reduced rainfall event. Persistent drought may also alter the forest structure (Zhou et al 2014). Our results indicate that groundwater storage in tropical forests of Africa can act as a buffer to compensate for the potential productivity reductions from rainfall and SM drought.
Our results indicated that both the SIF observations and TRENDY GPP show similar seasonality, but capturing GPP inter-annual variability from Earth system models remains challenging. Interpretation of the satellite SIF record is limited by relatively low signal-to-noise levels and sensor degradation (Zhang et al 2018). Additionally, SIF data showed higher sensitivity to rainfall than the L4C GPP; thus, SIF normalized by PAR, might be a better proxy for slower response to groundwater and rainfall. Remote sensing productivity models address some of the shortcomings of SIF by having higher spatial-temporal resolution and utilizing near real time satellite observations though vegetation indices. However, the L4C model includes LUE uncertainties contributed from underlying assumptions of PFT homogeneity in ecosystem processes defined by global biome classifications (Madani et al 2014). We anticipate that improvements in LUE models, such as incorporating plant trait information and SIF satellite observations to better represent plant phenology and ecosystem heterogeneity, will result in significant improvements in estimating global terrestrial productivity and its inter-annual variability (Madani et al 2017a, 2017b).
Here we only focused on ecosystem GPP and showed a slight increase in tropical productivity during the 2015 reduced rainfall condition, highlighting the role of groundwater as a key environmental control on annual ecosystem productivity in Africa. The scarcity of SM during dry conditions can increase human reliance on groundwater resources, thereby intensifying water stress in natural ecosystems that rely on groundwater to sustain productivity.
Acknowledgments
This research, carried out at the Jet Propulsion Laboratory, California Institute of Technology, was under a contract with the National Aeronautics and Space Administration, © 2019 California Institute of Technology. Study was conducted with funding provided by NASA (NNX14AI50G, NNH15ZDA001N, NNX15AB59G) and the Earth Science Division Interdisciplinary Science (IDS) program. TT was funded by SNSB (Dnr 95/16). We also acknowledge the reviewers for their constructive comments and suggestions.
Competing interests
The authors declare no competing interests.
Data availability
All data used in this research are publicly available from the cited literature. The L4C-GPP data are freely available for download from http://files.ntsg.umt.edu/data/.