

Abstract
Deforestation and drought are among the greatest environmental pressures on the Amazon rainforest, possibly destabilizing the forest-climate system. Deforestation in the Amazon reduces rainfall regionally, while this deforestation itself has been reported to be facilitated by droughts. Here we quantify the interactions between drought and deforestation spatially across the Amazon during the early 21st century. First, we relate observed fluctuations in deforestation rates to dry-season intensity; second, we determine the effect of conversion of forest to cropland on evapotranspiration; and third, we simulate the subsequent downwind reductions in rainfall due to decreased atmospheric water input. We find large variability in the response of deforestation to dry-season intensity, with a significant but small average increase in deforestation rates with a more intense dry season: with every mm of water deficit, deforestation tends to increase by 0.13% per year. Deforestation, in turn, has caused an estimated 4% of the recent observed drying, with the south-western part of the Amazon being most strongly affected. Combining both effects, we quantify a reinforcing drought-deforestation feedback that is currently small, but becomes gradually stronger with cumulative deforestation. Our results suggest that global climate change, not deforestation, is the main driver of recent drying in the Amazon. However, a feedback between drought and deforestation implies that increases in either of them will impede efforts to curb both.
Export citation and abstract BibTeX RIS

Original content from this work may be used under the terms of the Creative Commons Attribution 4.0 licence. Any further distribution of this work must maintain attribution to the author(s) and the title of the work, journal citation and DOI.
Deforestation, the human-driven cropping of tree cover, has been gradually decreasing the extent of the Amazon rainforest over the last decades, mainly for the expansion of pastures and soybean plantations [1–3]. The spatial and temporal distribution of deforestation is not random, as a range of socioeconomic and institutional factors affect deforestation. For example, population density and accessibility by road contribute to deforestation [4, 5]. In contrast, designating forest as protected area successfully inhibits deforestation [6–8]. Sometimes, cause-and-effect relations are more complex, as when positive feedbacks are in play. An example of such an amplifying causal loop is a two-way interaction between road density and deforestation: accessibility of the forest increases deforestation, but that deforestation is in turn also used as justification for constructing more roads [9]. Besides being a product of socioeconomic complexity, deforestation also interacts with climatic and ecological processes in the Amazon, e.g. [10–14]. However, not all causal pathways have been studied so far.
In the Amazon, deforestation is often accompanied by fire [15, 16]. Because a more intense dry season makes the Amazon forest more flammable [4, 17–21], it seems reasonable to hypothesize that increasing dry-season intensity facilitates clear-cut deforestation in several ways: (1) traditional slash-and-burn agriculture depends on a sufficiently dry season [15, 17]; (2) pastures are often repeatedly cleared of encroaching woody vegetation and weeds with the use of fire [15, 22]; and (3) deforestation using mechanical methods is often followed by the combustion of the remaining vegetation, which is easier when the material is drier [15, 17, 23, 24]. Furthermore, dry seasons facilitate the escape of fires into neighboring forest areas, especially in fragmented landscapes [25], potentially making them more attractive for subsequent deforestation. While dry seasons may facilitate the deforestation process, deforestation in turn affects the regional water cycle [26–29]. Evapotranspiration from forests is higher than from other land covers, in part due to enhanced evaporation directly from leaves (interception evaporation) and in part due to transpiration, in which trees pump water from the soil and release it through their leaves during photosynthesis [30]. Thus, forests maintain high evapotranspiration in the dry season by transpiring water that is stored in deeper soil layers, which act as a buffer during droughts. Part of this water subsequently precipitates over the forest, alleviating the intensity of the dry season by disproportionally contributing to rainfall under drier conditions [29]. Taking a viewpoint at the Amazonian scale, we see a positive feedback emerging: as deforestation reduces forest area, less water can be recycled and dry seasons intensify regionally; the more intense dry seasons become, the more deforestation tends to occur. These dynamics may amplify regional-scale deforestation and in principle contribute to a self-propagating loop of forest loss [31]. However, the extent to which dry seasons and deforestation affect one another remains unclear [32] and a hypothetical drought-deforestation feedback has never been explicitly addressed. Therefore, we here integrate several state-of-the-art approaches to disentangle the causal interactions between deforestation and dry-season intensity, and analyze the 'drought-deforestation feedback' in the Amazon rainforest.
To estimate how deforestation has interacted with regional rainfall patterns, we relate remotely sensed time series of forest cover change [33] to changing dry-season intensity during the early 21st century. We combine these results with: (1) a hydrological model that estimates forest evapotranspiration relative to that of cropland on a monthly basis [34, 35]; and (2) a high-resolution atmospheric moisture tracking algorithm to determine the fate of that evapotranspiration [29, 36]. In addition, we account for multiple evapotranspiration-rainfall cycles of water ('cascading moisture recycling'). This allows us to quantify the strength of the drought-deforestation feedback, analyze how it has changed over the course of more than a decade, and discuss its implications for the stability of the Amazon rainforest.
Methods
We quantify two causal effects: the effect of drought on deforestation and the effect of deforestation on drought. Below we outline how each was estimated, followed by a description of how we used those results to calculate the feedback strength in the Amazon forest. A diagram of the feedback loop, of which we quantify all steps for the Amazon, is given in figure 1.

Figure 1. Causal loop diagram of the hypothesized drought-deforestation feedback in the Amazon. All the steps in this diagram are analyzed in this study.
Download figure:
Standard image High-resolution imageThe effect of drought on deforestation
We define drought as the intensity of a dry season in a given calendar year as given by the Maximum Climatological Water Deficit (MCWD in mm). The independent calculation of MCWD for each calendar year means we do not account for possible continuation of droughts into a new calendar year. MCWD is a common measure of drought in the Amazon [37, 38], capturing the cumulative difference between precipitation P and evapotranspiration E in a certain year. MCWD values are negative, so a more negative value of MCWD means a more intense dry season. Monthly precipitation and actual evapotranspiration data were taken from the GLDAS2 dataset [39].
Deforestation estimates were obtained from the Landsat satellite dataset of [33]. This dataset provides forest loss and forest gain data on 0.00025° (∼25 m) resolution. Forest loss is provided on an annual basis, whereas forest gain is provided only once for the entire time period of 2000 through 2017. If a cell has become forested during this period, we assumed that the increase in tree cover is linearly distributed over the years. Forest degradation by understory fires or logging, for instance, is not detected by the algorithm behind the dataset, so our analysis accounts for clear-cut deforestation only. All forest loss and gain data were aggregated to net deforestation (forest loss minus gain) on a 0.25° basis to match the resolution of the hydrological simulations (see section The effect of deforestation on drought).
We related dry-season intensity to deforestation to better understand how the former affects the latter. However, correlation analysis can be problematic, because the relation between deforestation and dry-season intensity may be confounded by other spatially non-random factors. For example, deforestation is mostly concentrated in the drier southern and eastern parts of the Amazon, along the 'arc of deforestation'. This region is not only naturally drier than the central-western parts of the Amazon, but it also holds more infrastructure. To correct for such geographical factors, we determined the effect of dry-season intensity (MCWD in mm) on deforestation on a per-cell basis over time: for this we spatially averaged the climatic and deforestation data to 1° and linearly regressed the annual local deforestation anomaly (in % of the local multi-year average) to MCWD. For each cell, this resulted in the slope of the effect of MCWD on deforestation, or ΔDeforestation/ΔMCWD in % yr−1 mm−1. Because we found that the effect of MCWD on ΔDeforestation/ΔMCWD is small (figure S5), we simply took its average across MCWD levels as the effect of dry-season intensity on deforestation.
To check for robustness of our results we repeated the above analysis using the Projeto de Monitoramento do Desmatamento na Amazônia Legal por Satélite (PRODES) dataset from the Brazilian Instituto Nacional de Pesquisas Espaciais (INPE). However, because this dataset is only available for the Brazilian Amazon, it underestimates total deforestation. Therefore, we present the data from Landsat for our main analyses and a comparison with PRODES in the Supplementary Information (available online at stacks.iop.org/ERL/15/044024/mmedia).
The effect of deforestation on drought
To estimate the effect of deforestation on drought we combined output of the PC Raster Global Water Balance hydrological model (PCR-GLOBWB) [34, 35] with an atmospheric moisture tracking algorithm [36] forced with atmospheric and surface flux data. Below we outline how the effects of deforestation on rainfall were calculated. We provide a simple schematic of the methodological steps as figure S7, and for the equations of the moisture tracking algorithm we refer to [29].
We estimated the monthly forest contributions to evapotranspiration during 2003–2014 using the PCR-GLOBWB model at 0.5° resolution. The model estimates the partitioning of evapotranspiration into transpiration, interception evaporation, and remaining bare-soil evaporation for a number of possible land cover types, with a per-cell and monthly output [34, 40]. We calculated the actual forest contribution to evapotranspiration by multiplying its transpiration and interception-evaporation estimates for full forest cover by the fractions of the cells that are actually covered by forest [33]. We then replaced these forest evapotranspiration fluxes by those for rainfed cropland (such as soybean plantations) [34], maximized at the original fluxes. The output of PCR-GLOBWB shows good agreement with independent dry-season evapotranspiration estimates [29] and discharge data [41] from the Amazon river. We show the differences in evapotranspiration between forest and rainfed cropland on a monthly basis in the supplementary material (figure S6).
To estimate the regional effects of evapotranspiration reductions on rainfall due to deforestation, we used a Lagrangian atmospheric moisture tracking model [36]. This model tracks precipitation backwards in time by separating the precipitation into a large number of moisture parcels. These are initially released within cells of 0.25° at random heights in the atmospheric column with a probability scaled with the humidity profile. The trajectories of the parcels are simulated back in time using three-dimensional estimates of wind speed and direction using linearly interpolated ERA-Interim data at 0.75° and 6 h resolution [42]. This is done for each time step of fifteen minutes throughout the study period of 2003–2014. Each time step, water in the parcels that are tracked are updated using interpolated three-hourly evapotranspiration (ET) and precipitation (P) estimates from the GLDAS2 dataset [39] and precipitable water (PW) from ERA-Interim. Every time step, the fraction ET/PW of the moisture in the parcel is assumed to have originated from evapotranspiration at that location. That amount of moisture is allocated there and the moisture present in the parcel is updated. Thus, the amount of tracked moisture in the parcels decreases along their trajectories backward in time from precipitation to evaporation. Parcels of water were tracked either until more than 95% of it had been allocated, 30 d have passed since tracking started, or it has left the study domain of tropical South America (81.5° W–34° W; 13° N–35° S). For precipitation in each cell in tropical South America, we determined the corresponding upwind evaporation location on a monthly basis. Thus, we obtained the monthly moisture flows between each pair of 0.25° cells in tropical South America, from which we used those located in the Amazon. By multiplying these moisture flows with the fractional change in evapotranspiration due to deforestation, we estimated the effects of deforestation on monthly precipitation throughout the Amazon. Implicitly, we assumed that deforestation does not affect wind patterns.
Upon precipitating, moisture can re-evaporate and precipitate again in what has been called 'cascading moisture recycling' [43]. Thus, evapotranspiration reduction by deforestation could affect precipitation multiple times. Reference [29] determined that in the Amazon forest this happens up to six times. This cascading moisture recycling accounts for about half of the forest's contribution to rainfall. Therefore, we tracked the atmospheric trajectories of re-evapotranspired moisture for seven re-evaporation times according to the method of [43]. Although we only present moisture circulation within the Amazon, the calculations were done for the entire tropical South America. We updated our estimates of the deforestation effects on rainfall with this cascading moisture recycling. We show the deforestation-induced changes in MCWD by 2014 and smoothed them spatially using a Gaussian filter with a standard deviation of 0.5°. We also mapped the trend in MCWD across 2000−2014 and subtracted from that the annual contribution of deforestation (the total by 2014, divided by 14) and smoothed it likewise.
Quantifying the feedback
With the above described method we estimated how deforestation during 2003–2014 has affected the frequency distribution of MCWD. By multiplying the estimated frequency distribution of MCWD in the absence of deforestation by the observed effect of MCWD on deforestation we could estimate deforestation in the absence of a drought-deforestation feedback. The feedback strength, measured as the 'drought-deforestation feedback factor' FDD, represents the factor by which deforestation is multiplied due to the feedback. Hence, it is the ratio of observed deforestation Dobs over estimated deforestation in the absence of the drought-deforestation feedback Dest:

As in [29], due to limited availability of data that are consistent across the different models that we used, we only analyze the period between 2003 and 2014: atmospheric data pre-2003 have discrepancies with those from 2003 onward due to differences in the data sources [42], and the input data for PCR-GLOBWB are available until 2014 [34]. However, we could estimate how the feedback strength has increased with cumulative deforestation during the early 21st century to obtain the effect of historical deforestation on the feedback strength. We took the estimate that goes furthest back in time [44], which is 1960, although it only accounts for the Brazilian Amazon.
Results
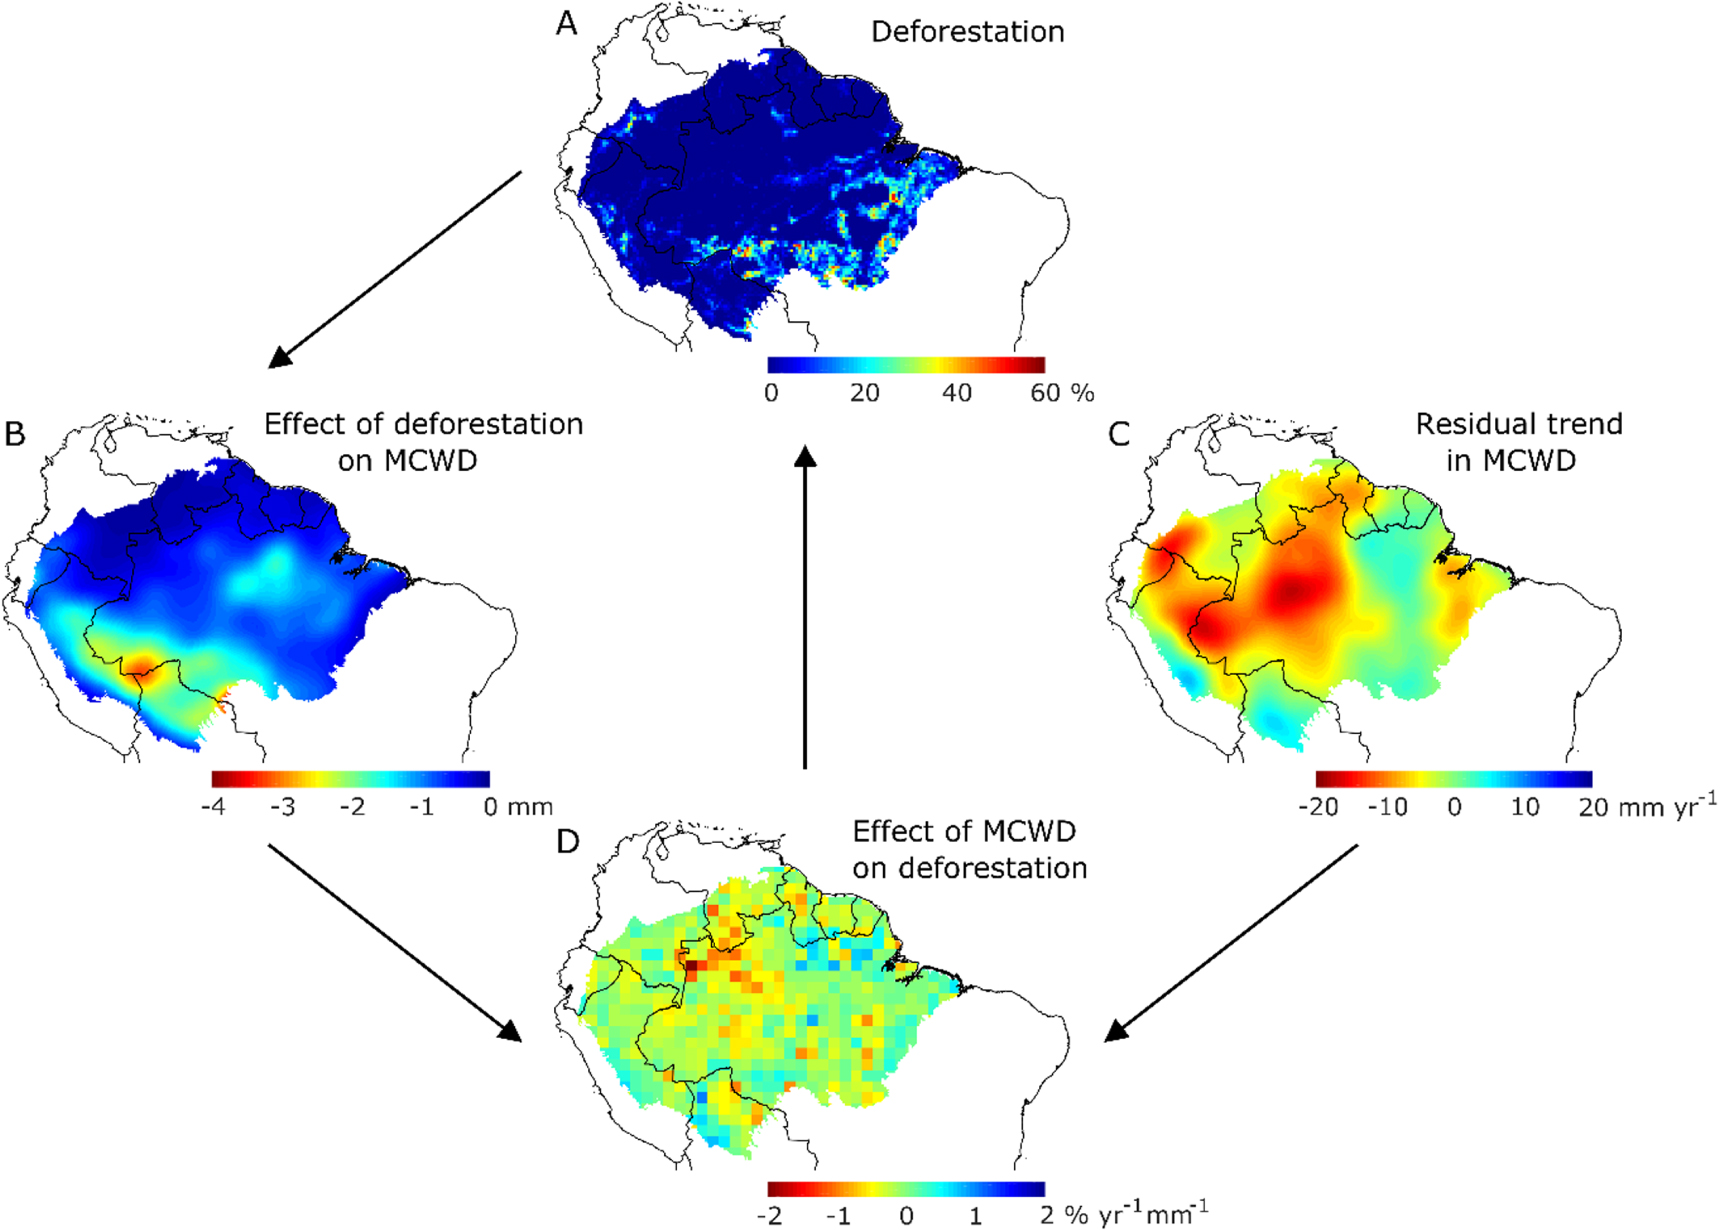
Our hydrological simulations show that deforestation, which has predominantly occurred in the south-eastern part of the Amazon (figure 2(A)), has made dry seasons more intense over the early 21st century (figure 2(B)). By 2014, the mean decrease in Maximum Climatological Water Deficit (MCWD in mm) across the Amazon in response to 21st century deforestation was c. 1.6 mm (figure S8), or a decrease of 0.11 mm yr−1 (linear R2 = 0.87). This corresponds to 3.8% of the average decrease in MCWD. We postulate that the remainder of the decrease (figure 2(C)) is due to global climate change, although natural fluctuations such as the El Niño Southern Oscillation [45], or other atmospheric effects of deforestation such as changed circulation [46] may have contributed as well. Although the largest drying trends have occurred in the central and western parts of the Amazon (figures 2(C) and S1 ), deforestation has intensified dry seasons especially in the south-western Amazon (∼4 mm; figure 2(B)). This demonstrates the international effects of deforestation on rainfall [47]: deforestation in the Brazilian Amazon causes part of the drying in Bolivia and Peru (figure S10).

Figure 2. Interplay between dry-season intensity and deforestation in the Amazon during the early 21st century. (A) Total deforestation (%) between 2001 and 2014 on 0.25° resolution. (B) The effect of cumulative deforestation between 2001 and 2014 on Maximum Climatological Water Deficit (MCWD, in mm) in the Amazon in the year 2014. (C) The trend in MCWD (mm yr−1) from 2000 to 2014 without the contribution of deforestation, which we interpret as the effects of global climate change and natural fluctuations on MCWD. (D) The effect of MCWD on deforestation (% yr−1 mm−1) between 2001 and 2014. Here the values represent the change in deforestation for every mm increase in MCWD as percentage of average local deforestation. Note that negative values indicate that deforestation increases with a more intense dry season (i.e. more negative MCWD).
Download figure:
Standard image High-resolution imageLooking on a per-cell basis, we find that, on average, deforestation increases in years with a more intense dry season: the sensitivity of deforestation to MCWD is significantly below zero with a mean of −0.13% yr−1 mm−1 (95% CI [−0.14, −0.12]), which is the annual deforestation change for each mm change of water deficit (n = 14 for each cell). Note that, because MCWD is negative, a negative sensitivity implies that deforestation increases as conditions become drier. There are, however, large spatial differences in the sensitivity of deforestation to drought (σ = 0.30). Especially in the central Amazon we find locations with increases in deforestation with drought (figure 2(D)). In 69% of the Amazon (regardless of p-value), deforestation increases with a more intense dry season (see figure S2 for examples). When areas with a non-significant (α = 0.05) effect of drought are excluded, this proportion rises to 80% (figure S3). In other words, in four out of five significant effects, deforestation increased with drought. Among the remaining areas, we find a number of cells with significant effects of drought on deforestation near major roads in a new deforestation frontier in the western Amazonia of Brazil (figure S4).
Although our study period covers only a part of the historical deforestation, we are able to estimate the increase in feedback strength within that period, showing that the feedback has gained strength by an average of 5.1 × 10⁻⁴ per year compared to the feedback strength in 2000 (linear R2 = 0.75, p ≈ 0; figure S9). Put otherwise, for every 1000 km2 that was deforested, the feedback increased on average by 2.7 × 10⁻⁵ (linear R2 = 0.69, p ≈ 0; figure 3).

Figure 3. The increasing drought-deforestation feedback. The plot gives the relative increase in the drought-deforestation feedback strength across years (R2 = 0.69 for a linear regression). Hydrological simulations were performed for each year between 2003 and 2014, accounting for deforestation after 2000. Thus, 2000 is the reference year at which cumulative deforestation is set to 0 and the feedback strength (FDD, see Methods) is considered to be 1.
Download figure:
Standard image High-resolution imageAside from analyzing drought-deforestation interaction during the recent past, we can assess where potential future deforestation would intensify dry seasons. We therefore calculate the effects of conversion from forest to cropland on the amount of evapotranspiration that directly precipitates in the Amazon within a dry season. On average, converting one hectare of forest to cropland would cause a reduction of 0.5 million L per year of evaporated water that subsequently precipitates within the Amazon during a dry season (i.e. during months when evapotranspiration exceeds precipitation). Locally, this amount ranges between 0 and 2 million L ha−1 yr−1 (figure 4).

Figure 4. The effects of deforestation on rainfall recycling within dry seasons in the Amazon (106 L ha−1 yr−1) with its major roads. Because the map shows how many million liters of water each hectare of forest conversion to cropland would precipitate less elsewhere in the Amazon during the local dry season, the depicted values are smaller than total forest evapotranspiration. The results depend on both the local evapotranspiration calculations and the atmospheric moisture-tracking simulations. The roads [48] are given in white.
Download figure:
Standard image High-resolution image
Discussion
Drought-deforestation feedback: weak, but getting stronger
We analyzed the interactions between deforestation and dry-season intensity in the Amazon, suggesting a drought-deforestation feedback. The strength of this feedback is a function of the cumulative historical forest loss (deforestation minus reforestation). Although the feedback is still small and the effect of drought on deforestation is highly variable, the drought-deforestation feedback may be a previously unidentified hidden driver of deforestation which is becoming stronger as progressively more forest is lost every year. Historical deforestation has a perpetual legacy effect in increasing dry-season intensity, particularly in the south-western Amazon, presumably because using fire to clear the landscape has become easier [17, 19, 49]. Taking the relation between feedback strength and cumulative deforestation, we can estimate to what extent historical deforestation amplifies current deforestation. It is estimated that between 1960 and 2014 in the Brazilian Amazon alone, cumulative deforestation amounts to 649 000 km2 [44]. If the correlation between deforestation and drought represents a causal effect, then by 2014, in the order of 1% of annual deforestation may have taken place due to the drought-deforestation feedback (best estimate is 1.7%, or around 300 km2 for 2014). It should be noted that this estimate depends on uncertain effects of drought on deforestation and a short period of twelve years on which our feedback analysis is based. Also, in assuming a linear increase in feedback strength with cumulative deforestation we adopted a conservative approach. Longer time series and improved satellite monitoring can reduce these uncertainties.
The roles of climate change and fire
Climate change intervenes with the drought-deforestation feedback by increasing the duration, intensity, and frequency of droughts [32, 50–52]. Given our finding that no more than 4% of recent drying in the Amazon has resulted from deforestation, it appears that climate change is the main driver of drought-facilitated forest loss. Intensified dry seasons in the Amazon increase the opportunities for wildfires to spread from human-ignited sources into standing forest. Wildfires not only degrade a forest, but may destabilize the remaining forest cover through flammability and erosion feedbacks favouring open vegetation [53–56]. There could be a critical threshold of drying above which forest loss self-perpetuates even in the absence of further deforestation [31, 57].
The role of governance
In 2019, the rates of deforestation and fire occurrence in Brazil were unusually high for a year with normal rainfall levels [15], whereas during most of our study period, those rates were gradually declining due to strong forest governance [58]. This illustrates how the effects of drought on deforestation can be overwhelmed by changes in governance. Raising societal awareness of the drought-deforestation feedback that we have identified could avoid runaway forest loss. Despite the legacy effect of past deforestation, the feedback decreases in importance with reduced deforestation and ceases to affect the system when deforestation is halted altogether. Governance interventions, involving (inter)national political [59] and financial actors [60], as well as local populations, could realize this [61]. Special attention should be given to Amazonian regions where the forest contributes the most to dry-season rainfall recycling, such as the Brazilian states of Acre, Amapá and Pará, as well as parts of Peru and French Guiana (figure 4).
Limitations
Our results are limited to the observed spatial distribution of dry season intensity across the Amazon. In areas where droughts do not occur yet, and where the absence of infrastructure limits deforestation, we do not know the sensitivity to more intense droughts, increasing the uncertainty of the drought-deforestation feedback in the relatively remote wetter regions. Furthermore, if, due to global climate change, natural fluctuations or deforestation itself, wind patterns change, then the effects of deforestation may change as well. Nevertheless, it seems very likely that the western Amazon will remain a main destination of forest-generated atmospheric moisture, given the large-scale easterly trade winds and the blockage of these winds by the Andes [62]. On smaller scales, however, presumed changes in winds are more complex [63]. We did not account for sub-grid convective cloud transport [64] while models suggest that small-scale deforestation may enhance precipitation locally [65]. This occurs especially in the dry season when the system is less dominated by strong easterly winds [63]. Thus, the effects of deforestation on drought could be scale-dependent, which is not accounted for in our simulations.
The complexity of deforestation dynamics derives from multiple nonlinear interactions between nature and society, including climatic conditions and societal rules that are continuously changing. This means that our results do not warrant prediction of future forest loss. However, they do highlight one social-ecological feedback that constitutes these dynamics. The drought-deforestation feedback has been overlooked so far, and its explicit incorporation in scenarios of future deforestation could improve our projections. As a step in the direction of disentangling the complexities of the Amazon forest, we here unveil a feedback mechanism between drought and deforestation that has been increasingly impacting the dynamics of this important ecosystem.
Conclusion
We presented a previously unrecognized feedback between drought and deforestation in the Amazon. We analyzed the spatial patterns of the causal effects between drought and deforestation by analyzing remotely sensed forest loss data in response to dry-season intensity, and by simulating the atmospheric trajectories of forest-induced evapotranspiration. On average, deforestation becomes higher with a more intense dry season; this deforestation intensifies dry seasons in the south-western Amazon in particular. We conclude that the drought-deforestation feedback has a small, but increasing, effect on deforestation.
Acknowledgments
We thank the two anonymous reviewers for their helpful comments. AS and IF acknowledge support from the European Research Council project Earth Resilience in the Anthropocene (743080 ERA). BMF is funded by São Paulo Research Foundation Grant FAPESP 2016/25086-3. OAT acknowledges support from the research program Innovational Research Incentives Scheme 016.veni.171.019, funded by the Netherlands Organization for Scientific Research (NWO).
Data availability
The data that support the findings of this study are available from the corresponding author upon reasonable request.