

Abstract
A majority of studies suggest that elevation dependent warming (EDW) has been verified in mountainous areas. However, there is some controversy about the EDW of high mountain Asia (HMA). Based on the analysis of the data from 128 meteorological stations in the entire region for 1961–2017, we found that there was no EDW in HMA on the time scale of 1961–2017 and the spatial scale of the altitude of 3500–5000 m. The EDW in HMA is the most obvious during the period of 1998–2012. In general, after 1980, there was EDW in the altitude of 2500–5000 m. The Southeastern Tibetan Plateau always has EDW phenomenon for most of the time scales while other areas only have EDW at certain periods. Therefore, we consider that the rate of warming is higher only in specific mountain areas and time scales.
Export citation and abstract BibTeX RIS

Original content from this work may be used under the terms of the Creative Commons Attribution 4.0 licence. Any further distribution of this work must maintain attribution to the author(s) and the title of the work, journal citation and DOI.
1. Introduction
Global warming is more rapid at higher elevation, which is referred to as elevation-dependent warming (EDW). EDW has become a generally accepted fact by a majority of studies in recent years and was supported by both observations and climate modeling studies (Wang et al 2014, Oyler et al 2015, Pepin and Coauthors 2015, Palazzi et al 2019). The EDW has been confirmed by many scientists and verified in many parts of the world (Wang et al 2014), such as in the Andes (Aguilar-Lome et al 2019), Rocky Mountain (McGuire et al 2012, Minder et al 2018), Yunnan Plateau (Fan et al 2011), the mountains of the western United States (Oyler et al 2015), Colorado Rocky Mountains, and the Greater Alpine Region (Palazzi et al 2019). However, as a particular case, there has been some debate about the EDW in high mountain Asia (HMA) (Zhang and Cheng 2014, Gao et al 2018). Some studies suggested that EDW phenomenon was accompanied by the temperature rise in the Tibetan Plateau (Qin et al 2009, Yan and Liu 2014, Palazzi et al 2017). In particular, when there was every 1000 m increase in altitude in winter, the warming rate of the site increased by 0.16 °C/10a (Wang et al 2012), and this phenomenon has occurred in recent decades, the EDW will continue or increase in the future (Liu et al 2008, 2009). Some studies also showed that EDW occurred in some areas, not all of regions. Also, Guo and Wang (2012) point out that there was no EDW in the northern Tibetan Plateau, and other areas in the Tibetan Plateau have EDW from 1961 to 2007. Gao et al (2018) showed that Tibetan Plateau has EDW below 5000 m, while no EDW occurred above 5000 m during the period from 1983 to 2011. However, other studies suggested that there was no obvious relationship between trend magnitude of air temperature and elevation (Vuille et al 2003, Pepin and Norris 2005, You et al 2008, 2010, Yang et al 2012, Li et al 2013, Xu et al 2018). For example, You et al (2010) suggested that there was the absence of any simple elevation dependency in temperature trends in the Tibetan Plateau from 1961 to 2015. Xu et al (2018) indicated that elevation dependency of temperature trend magnitude was not obvious in the Tianshan Mountains of HMA from 1960 to 2016. Du et al (2019) found that the higher altitudes are seemly to a lower rate of temperature rose on the Tibetan Plateau. Thus, it is still uncertain whether mountainous regions generally are warming higher than the rest of the global land surface (Rangwala and Miller 2012). In the present study, we intended to identify whether EDW existed in HMA.
In this paper, high mountain Asia (HMA) refers to the vast area generally defined by N26°–44° and E75°–105° (figure 1). HAM has high altitude and low temperature. HMA hosts the largest glacier concentration outside the polar regions (Brun et al 2017), which is called 'Water Tower of Asia'. Climatic warming has become an arising environmental challenge for the HMA.
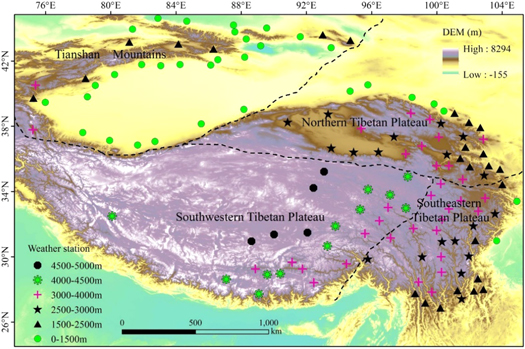
Figure 1. Location of high mountain Asia and the meteorological stations.
Download figure:
Standard image High-resolution imageThe controversy over the EDW of HMA mainly includes these reasons as follows: first, the time series of temperature analyzed by different researchers are inconsistent. Second, we lack high-altitude meteorological data. Third, due to the wide range of HMA, there were inconsistent temperature variations in different areas. Thus, in this paper, we analyzed the relationship between warming and altitude in different time scales and different areas in HMA, and tried to answer at what periods and which areas have elevation-dependent warming characteristics.
Previous studies have shown that China and Tibetan Plateau's climate has changed significantly after the mid-1980s (Ding and Zhang 2008, Chen et al 2014, Ren et al 2017). Therefore, we use 1980 as the first dividing point of time to study the trend of temperature changes in HMA. After that, we add a demarcation point every ten years. Furthermore, we analyze the relationship between temperature change trends and elevations in 1961–1980, 1961–1990, 1961–2000, 1980–2017, 1990–2017, 2000–2017, respectively. However, there was no warming of the global mean surface temperature during 1998–2012, as noted by some studies (Easterling and Wehner 2009, IPCC 2013, Kosaka and Xie 2013, Trenberth et al 2014). So, we use 1998 and 2012 as two other dividing points and study on the change of temperature in 1998–2012, 1998–2017, and 2000–2012, respectively. As a matter of course, we also analyze the relationship between temperature change trend and elevation throughout the study period (1961–2017).
According to the distribution of weather stations and the geographical environment characteristics of the study area, we use the altitude of 1500, 2500, 3000, 3500, 4000, 5000 m as the boundary of different elevation areas. Thus, in space, we analyze the relationship between temperature change trends and elevations in 1500–5000 m, 2500–5000 m, 3000–5000 m, 3500–5000 m, 4000–5000 m, 0–2500 m, and 0–5000 m. Additionally, we divided the study area into four areas as follows (figure 1): Tianshan Mountains (TSM), Northern Tibetan Plateau (NTP), Southeastern Tibetan Plateau (SETP), Southwestern Tibetan Plateau (SWTP). The average altitude of weather stations in TSM, NTP, SETP, and SWTP is 1185, 2515, 2881, and 4173 m, respectively.
2. Data and methods
2.1. Data
In this paper, we used the annual air temperature during the period from 1961 to 2017 from these 128 stations to analyze the temperature change in HMA (figure 1). All the meteorological stations selected for this study had been maintained for following the standard of the China Meteorological Information Center. The standard requires strict quality control processes including extreme inspection, consistency check, and others before releasing these data (Li et al 2012).
2.2. Methods
Mann–Kendall statistical test (Mann 1945, Kendall 1975) was employed to test the significances of trend in the annual mean temperatures of HMA. The nonparametric Mann–Kendall statistical test has been commonly used to assess the significance of monotonic trends in meteorological series (Li et al 2012, Chen et al 2014).
To reveal the relationship between temperatures at different altitudes, we calculated the Pearson's correlation coefficient between them before and after 1985. The correlation coefficient (r) is usually calculated as follows:

Considering the relationship between the trend of temperature and elevation, we calculate Pearson's correlation coefficient (r) to detect the association between them.
3. Results
3.1. Temperature change
The Mann–Kendall statistical test showed a significant rising trend in the air temperature in HMA (figure 2(a)) from 1961 to 2017, with a rate of 0.323 °C/decade (figure 2(b), P < 0.001). A significant rising trend (P < 0.001) was found in four different areas. Compared with SETP (0.269 °C/decade) and TSM (0.308 °C/decade), there were higher changing rates in the NTP (0.381 °C/decade) and SWTP (0.36 °C/decade). Additionally, only two weather stations have a downward trend in temperature from 1961 to 2017.
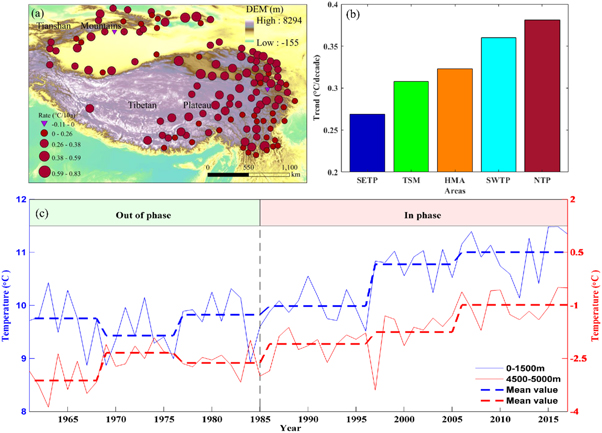
Figure 2. The spatial (a) and temporal (b) changes of annual temperature in the entire region (High Mountain Asia, HMA), Tianshan Mountains (TSM), Northern Tibetan Plateau (NTP), Southeastern Tibetan Plateau (SETP), Southwestern Tibetan Plateau (SWTP) from 1961 to 2017, the changes of temperature at the altitude of 0–1500 m and 4500–5000 m in HMA during 1961–1985 and 1986–2017 (c).
Download figure:
Standard image High-resolution imageFigure 3(b) shows that there is a significant positive correlation (r > 0.55, P < 0.01) among temperatures at all different altitudes from 1986 to 2017. Meanwhile, there is a significant (r > 0.60, P < 0.01) positive correlation in temperatures at different altitude of only above 2500 m during 1961–1985 (figure 3(a)). However, the change trend in temperatures has no correlation between at altitudes below 2500 m and above 3000 m before 1985. It is worth mentioning that the temperature at 0–1500 m has a significant (P < 0.05) negative correlation with the temperature at 4000–5000 m in 1961–1985. Figure 2 (c) also showed that the temperature at the 0–1500 m and 4500–5000 m have an almost perfect 'mirroring' relationship during 1961–1985. It is suggesting that there are significant differences in the influence factors of temperature in the two altitude regions.
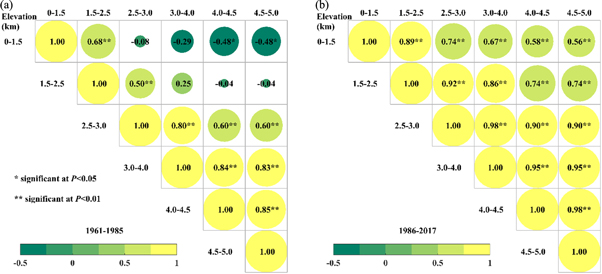
Figure 3. The correlation coefficients among annual temperatures in different altitudes during 1961–1985 (a) and 1986–2017 (b).
Download figure:
Standard image High-resolution image3.2. Relationship between trends of temperature and elevation
The Pearson's correlation coefficient values (figure 4(a)) show that during the period from 1961 to 2017 time scale, the change trend in air temperature of the HMA has no correlation with the elevation, which means there are no EDW at all spatial scales.

Figure 4. The correlation coefficients between the trend of annual temperature and elevation in different periods, altitudes (a), and areas (b) (* significant at P < 0.05, ** significant at P < 0.05, *** significant at P < 0.001, TSM: Tianshan Mountains, NTP: Northern Tibetan Plateau, SETP: Southeastern Tibetan Plateau, SWTP: Southwestern Tibetan Plateau).
Download figure:
Standard image High-resolution image
In 1961–1980, the trend of temperature has a significant (P < 0.05) positive correlation with the elevation at 0–5000 m, 1500–5000 m, and 0–2500 m scale.
In 1980–2017, the change trend in annual air temperature has a significant (P < 0.05) positive correlation with the elevation at 2500–5000 m and 3000–5000 m. In 1990–2017, the correlation values between them in the altitude of 0–5000 m, 1500–5000 m, 2500–5000 m, 3000–5000 m reached significant level (P < 0.05). From 2000 to 2017, the correlation coefficient in the altitude of 0–5000 m, 1500–5000 m also reached significant level (P < 0.05). Thus, it can be seen that from 1980 to 2017, HMA in 1990–2017, 1998–2012, and 2000–2012 has EDW phenomenon in the altitude of 2500–5000 m scale.
Another feature is worth mentioning that the positive correlations between annual temperature and elevation in 1998–2012 and 2000–2012 are much higher (P < 0.001) than the others time scale, which means the EDW in HMA is more obvious in the period of global warming hiatus. It is also indicating that the temperature in the HMA is still rising even in the period of global warming hiatus.
In space, there is no correlation among the change trends in temperature in different time scales and at an altitude of 3500–5000 m and 4000–5000 m, which means there is no EDW for any periods at the altitude of 3500–5000 m scale. Furthermore, HMA had EDW below 2500 m before 1980 while after 1980, HMA had EDW above 2500 m. In short, EDW only occurred in specific spatiotemporal scales, instead of in all spatial and temporal scales.
First, the important thing is that the trend of temperature has a significant positive correlation with the elevation in SETP almost at any time scale (figure 4(b)), indicating SETP almost always has EDW phenomenon. Second, there was EDW in the SWTP only after 1998. Third, EDW occurred in the NTP only during the period from 1961 to 1980 and from 2000 to 2012. Fourth, in the TSM, there was EDW only from 1961 to 1980. But the trend of temperature in TSM has a significant negative correlation with the elevation during the period from 2000 to 2017 and from 1998 to 2017 scales. We can see that anti-EDW occurred in the TSM after 1998.
4. Discussion and conclusion
4.1. Does EDW exist in HMA?
Many studies showed that there was EDW phenomenon in the HMA (Qin et al 2009, Wang et al 2012, Yan and Liu 2014, Palazzi et al 2017). Conversely, Lu et al (2010) found that the higher the altitude, the less the warming magnitude, the higher the altitude, the later the climate warming happens, and vice versa from 1960 to 2005 over the Tibetan Plateau. Hu et al (2014) suggested that there are significant negative correlations between temperature increase rate and elevation in Central Asia between 1979 and 2011. Ouyang et al (2019) found that cooling trend was even found in the northeast Tibetan Plateau from 2003–2011. Pepin et al (2019) found cooling was observed at highest elevations >6000 m in the Himalaya during the period from 2002 to 2017. Guo et al (2019b) found that annual air temperature in the southwestern Tibetan Plateau has decreased by 0.15 °C/decade from 2001 to 2015. They also suggested (Guo et al 2019a) that annual mean warming rates in temperature showed rapid decrease above 4500 m from 2001 to 2015. It can be seen that the results vary if scholars attempted to adopt different data to analyze the temperature in different temporal and spatial scales. It remains difficult to sufficiently assess whether mountains have warmed at a higher rate than the rest of the land surface primarily because we lack adequate observations to resolve it conclusively (Rangwala and Miller 2012).
We compared the relationship between temperature change and elevation at different times and spatial scales over HMA. The results showed that the larger temporal and spatial scales, the more difficult it was for EDW to appear. In other words, there was EDW phenomenon only in specific mountainous and time scales. For example, SETP almost always has EDW phenomenon, however, the phenomenon occurred only in the NTP, SWTP and TSM in specific times. There was no EDW in HMA in the time scale of 1961–2017 and on the spatial scale of the altitude of 3500–5000 m.
The EDW phenomenon only occurred in specific mountain areas and time scales, the main reasons are as follows. First, as it is well known that the warming rate is amplified at high latitudes (Rangwala et al 2013, Du et al 2019, Tabari et al 2019). The HMA has a large range of latitudes (N26°–44°). Therefore, the latitude is a significant factor in temperature change. Second, different land cover is another reason. For example, snow cover increased over the southwestern Tibetan Plateau leads to the annual temperature has decreased by 0.15 °C/decade during 2001–2015 (Guo et al 2019b). Third, Shi et al (2019) found that obviously lower summer minimum temperature warming trend on the southern Tibetan Plateau (2.3 × 10⁻³ °C/year) than over the Eurasian continent (5.1 × 10⁻³ °C/year) from 1850 to 1950 could be due to increased evaporative cooling. However, there are temporal and spatial differences in the degree of evaporative cooling at different altitudes. So, changes in some climate factors can also affect temperature changes. Fourth, tall terrain blocks the movement of atmospheric circulation, such as Pacifc Decadal Oscillation (PDO), Siberian High. Therefore, the influence of the same atmospheric circulation on the HMA is significantly different. For example, the Siberian High has an important effect on temperature changes in TSM (Li et al 2012), but it is difficult to have an effect on the southern part of the Tibetan plateau. Fifth, it may also be influenced by the local environment changes, such as human activities, or the glacier and permafrost melting at different altitudes (Du et al 2019, Yin et al 2019).
4.2. Potential causes of EDW
There are some physical mechanisms that can bring the change of warming rate in different elevation areas, such as snow/ice albedo feedback, cloud cover, water vapor modulation of longwave heating, aerosols, and soil moisture (Rangwala and Miller 2012).
Snow/ice albedo feedbacks was one of importance feedbacks in the climate system (Minder et al 2018). Giorgi et al (1997) believed that the melting water of ice and snow in high altitude areas reduced the surface albedo, and thus the solar radiation absorbed by the surface increased, thereby improving the snow and ice feedback. Palazzi et al (2019) found that the more frequent EDW driver in Tibetan Plateau-Himalayas was the change in albedo. The albedo feedback should be strongest at elevations associated with the snow line or the 0 °C isotherm (Rangwala and Miller 2012).
Duan and Wu (2006) suggested that the nocturnal cloud cover of low level had been increasing over Plateau during the period from 1961 to 2003. They believed that these increases can explain part of the upwards in temperature over Tibetan Plateau in recent 50 years. They also pointed out that if cloud cover in the daytime had been decreasing, it would have increased the absorption of solar radiation and speed up warming. Liu et al (2009) suggested that the elevation dependency was most probably caused by the combined effects of cloud-radiation with snow-albedo feedbacks among various influencing factors in the Tibetan Plateau and its surroundings from 1961 to 2006. Guo et al (2019a) found that trends in nighttime cloud and snow cover were correlated with patterns of EDW on the Tibetan Plateau from 2001 to 2015.
Minder et al (2018) found that EDW in Rocky Mountains was primarily caused by the snow albedo feedback. They also pointed out that no evidence was found for a contribution from elevation-dependent water vapor feedbacks. However, Rangwala et al (2009) suggested that increases in surface water vapor and the related changes in downward longwave radiation appeared to be part of the reason for the warming in the Tibetan Plateau from 1961 to 2000. Palazzi et al (2019) also suggested that in the Tibetan Plateau-Himalayas, the changes in specific humidity were an additional driver factor for EDW.
Aerosols, black carbon (soot), and dust were additional reasons to EDW (Rangwala and Miller 2012). Xu et al (2009) suggested that atmospherically deposited black carbon can increase the absorption of visible radiation by 10%–100% in the Tibetan Glaciers. Black carbon can also lead cloud cover to decrease and affect the radiation budget at the surface (Hansen et al 1997). Rangwala et al (2010) indicated that there were higher aerosol concentrations at lower elevations in the Tibetan Plateau, which would lead the rate of increase in temperature to be lower at these lower elevations and consequently contribute to an elevation gradient in warming rates.
Additionally, Palazzi et al (2019) found that the role of internal climate variability can be significant in modulating the EDW signal. Zhu et al (2019) pointed out that surface wind speed was consistently the major contributor to the variation in sensible heat trend from lower to higher altitude areas over Tibetan Plateau. They also stated that surface wind speed was mainly attributed to the dynamic process related to the PDO. So, atmospheric circulation was another natural factor affecting climate system changes. Furthermore, the changes of sensible heat may be influenced by the diminution in sunshine duration at higher-altitude regions (Zhu et al 2019).
4.3. Why is EDW more obvious in the Southeastern Tibetan Plateau?
Chen et al (2003) suggested that when CO2 doubled, the high-altitude cloud cover in the eastern Tibetan Plateau decreased, the low-altitude cloud increased. Duan and Wu (2006) showed that nocturnal cloud cover of low layer had been increasing over the eastern parts of the Plateau from 1961 to 2003. Therefore, more solar radiation reached the ground at high altitudes. Chen et al (2003) also found that there was less snow in the eastern Tibetan Plateau, so cloud cover was the main reason for the EDW in the SETP. The decrease in reflectivity caused by ice/snow in the western and southwestern Tibetan Plateau was the main factor affecting the surface energy balance, so the snow/ice feedback was the main reason for the EDW in the western and southwestern part of the Tibetan Plateau. Gao et al (2012) and Li et al (2018) illustrated that there was less snow in the east than that in the west. They also suggested that the snow cover period of low-altitude in the eastern part of the Tibetan Plateau shortened while that of the high altitude lengthened, which also proved that the snow/ice cover was not the main reason for EDW in the SETP.
Zhu et al (2019) found that sensible heat changes were related to the Pacific Decadal Oscillation. In the recent decades, the warming in the northwestern Pacific in relation to the switch of the PDO from a warm phase to a cold phase led to divergence anomalies in the upper troposphere, which would have caused an enlargement in divergence of the upper troposphere and subsequently a boost in surface convergence and rising motion over Tibetan Plateau. Obviously PDO has a greater impact on sensible heat in the eastern part of Tibetan Plateau than that in the western.
4.4. Why is the temperature at 0–1500 m different with 4000–5000 m in 1961–1985?
The meteorological stations with an altitude of 0–1500 m and 4000–5000 m are mainly located in TSM and SWTP, respectively (figure 1).
Previous studies have shown that the temperatures in Xinjiang (including TSM) (Wang et al 2013a, 2013b, Chen et al 2014) and Tibetan Plateau (Ding and Li 2008) have abrupt change in the mid-1980s. Before the abrupt change, temperature changes were mainly affected by natural factors. After the change, although the temperature trends in the two regions were similar, the driving factors for warming were not exactly the same. In particular, their local environments are different, making their temperature changes significantly different. Firstly, the TSM belongs to the arid area, while the SWTP belongs to the semi-arid area. Secondly, the SWTP is higher in altitude, and snow, glaciers and permafrost are more widely distributed than in TSM. Thirdly, Li et al (2012) found that that the weakening of the Siberian High during the 1980s–1990s was the main reason for the higher rate of the temperature rise in TSM. However, snow/ice albedo feedback, cloud cover, and water vapor were the main reasons for the temperature rise in the SWTP (Duan and Wu 2006, Duan and Xiao 2015, Palazzi et al 2019).
4.5. Why is the EDW more obvious during the period from 1998 to 2012?
We found that the EDW was more obvious during the period from 1998 to 2012. This was consistent with Yan and Liu (2014), who indicated EDW and extreme climate events have strengthened over the Tibetan Plateau since 2001 because of rapid warming from 2001 to 2012.
There was no warming of the global mean surface temperature during 1998–2012, as noted by many studies (Easterling and Wehner 2009, IPCC 2013, Kosaka and Xie 2013, Trenberth et al 2014). But, Huang et al (2017) suggested that the amplified Arctic warming over the past decade has significantly contributed to a continual global warming trend, rather than a hiatus or slowdown. Cheng et al (2017) also showed that all ocean basins examined have experienced significant warming since 1998. Duan and Xiao (2015) found that the climate warming hiatus did not occur over the Tibetan Plateau from 1998 to 2013. According to the principle of global energy balance, this may indicate that the slowdown in global land surface warming was mainly attributed the convergence of heat into the oceans, the Arctic and high-altitude mountains, because the warming in these areas has never stagnation or slowdown.
Acknowledgments
The research is supported by the National Natural Science Foundation of China (U1903208, 41501211, 41630859). We'd like to thank Dr Jonathan W Chipman at Dartmouth College for his suggestions about the manuscript.
Data availability statement
The data that support the findings of this study are available from the corresponding author upon reasonable request.