

Abstract
Soil nitrogen (N) mineralization is crucial for the sustainability of available soil N and hence ecosystem productivity and functioning. Metabolic quotient of N mineralization (Qmin), which is defined as net soil N mineralization per unit of soil microbial biomass N, reflects the efficiency of soil N mineralization. However, it is far from clear how soil Qmin changes and what are the controlling factors at the global scale. We compiled 871 observations of soil Qmin from 79 published articles across terrestrial ecosystems (croplands, forests, grasslands, and wetlands) to elucidate the global variation of soil Qmin and its predictors. Soil Qmin decreased from the equator to two poles, which was significant in the North Hemisphere. Soil Qmin correlated negatively with soil pH, total soil N, the ratio of soil carbon (C) to N, and soil microbial biomass C, and positively with mean annual temperature and C:N ratio of soil microbial biomass at a global scale. Soil microbial biomass, climate, and soil physical and chemical properties in combination accounted for 41% of the total variations of global soil Qmin. Among those predictors, C:N ratio of soil microbial biomass was the most important factor contributing to the variations of soil Qmin (the standardized coefficient = 0.39) within or across ecosystem types. This study emphasizes the critical role of microbial stoichiometry in soil N cycling, and suggests the necessity of incorporating soil Qmin into Earth system models to better predict N cycling under environmental change.
Export citation and abstract BibTeX RIS

Original content from this work may be used under the terms of the Creative Commons Attribution 4.0 licence. Any further distribution of this work must maintain attribution to the author(s) and the title of the work, journal citation and DOI.
Introduction
Soil nitrogen (N) mineralization and N availability largely determine plant productivity and community dynamics (Zak et al 2003). The changes in soil N mineralization even determine how an ecosystem responds under climate change (Reich et al 2018). As estimated, the amount of N mineralization accounts for approximately 58% (ranging from 47% to 68% across different ecosystems) of total N demand in a terrestrial biome (Cleveland et al 2013). Soil mineralization of organic N is performed by soil microbes at microscale in the concept model (Schimel and Bennett 2004). Moreover, a recent study reveals that soil microbial biomass plays a key role in global soil N mineralization (Li et al 2019). It is vital to understand the microbial role in soil N mineralization for the projection of N cycling. However, it remains elusive what determines the efficiency of N mineralization through soil microbes.
The soil metabolic quotient of N mineralization (Qmin), which is defined as net soil N mineralization per unit of soil microbial biomass N (MBN), is one of the important parameters of soil microbial properties (Anderson and Domsch 1993) and reflects the efficiency of soil microbial N mineralization. Soil Qmin may be influenced by soil microbial biomass and its elemental stoichiometry, climate, as well as soil physical and/or chemical properties. The stoichiometry of microbial biomass varies largely at the regional (Li et al 2012) and global scales (Bell et al 2014). Sinsabaugh et al (2009) point out that stoichiometry of microorganisms, reflecting the relative nutrient limitation for microbial growth, is fundamental for biogeochemical cycles. In terrestrial ecosystems, heterotrophs usually live in a carbon (C)-rich, N-poor condition relative to their physiological requirements (Sistla and Schimel 2012). When the stoichiometric demands of microbial physiology for N are not matched, soil microbes will strive to mine organic N from the environment. Therefore, a higher soil microbial biomass C:N ratio will accompany a higher soil Qmin. The size of soil microbial biomass could also influence soil N mineralization (Li et al 2019), which increases with microbial biomass C. Soil Qmin declines with the size of soil microbial biomass as shown in Yellowstone National Park (Tracy and Frank 1998) and following grassland restoration (Rosenzweig et al 2016). A general negative relationship between metabolic quotient of C mineralization and the size of soil microbial biomass was discovered with ecosystem development (Wardle and Ghani 2018). There may be a negative relationship between Qmin and microbial biomass C. Climate factors have strong influences on soil N mineralization at the global scale (Liu et al 2017). Specifically, soil N mineralization rate increases with higher mean annual temperature (Liu et al 2017). The soil physical and/or chemical properties might also regulate soil Qmin. Research discerning the effect of soil texture on soil biogeochemical processes shows that the lowest soil Qmin was found in the clays (Hassink 1994). To our knowledge, the global pattern of soil Qmin and the controls of soil microbial biomass amount and stoichiometry, climate, and soil physical and/or chemical properties on soil Qmin have yet to be quantified. Particularly, how these controlling factors interactively determine soil Qmin remains ambiguous at large spatial scales.
The characteristics of soil N cycling differ among ecosystem types. For example, soil N mineralization is higher in grasslands compared with adjacent croplands (Cookson et al 2007). The size of soil microbial biomass C in grasslands and forests is 3.6–6.9 times the size of that in croplands, and the MBN in grasslands and forests is 2.5–4.1 times more than that of croplands (Liu et al 2016). The climatic and soil properties also differ among ecosystems. For instance, soil pH shows significant difference among forests, grasslands, and croplands (Islam and Weil 2000). So, we hypothesized that the controlling factors for soil Qmin would change in different ecosystem types.
In this study, we compiled 871 observations from 79 published articles to address two questions: 1. How do climate, soil physical and/or chemical properties, and soil microbial biomass interactively influence the global variations of soil Qmin? 2. Which one of the above variables is the dominant driver on the variations of soil Qmin in different ecosystem types?
Materials and methods
Data collection and overview
We retrieved peer-reviewed articles that simultaneously measured the rate of N mineralization and soil microbial biomass in terrestrial ecosystems by the Web of Science (http://apps.webofknowledge.com) and China National Knowledge Infrastructure Database (http://cnki.net) till 30 July, 2018. We also retrieved articles using Google Scholar. The terms for searching articles were '(nitrogen mineralization OR N mineralization) AND (microbial biomass)'. Duplicates of article were removed. The criteria for selecting eligible articles include: 1. the net N mineralization and MBN were simultaneously reported (approximately only 30% articles on soil N mineralization were eligible); 2. the study was conducted with the upper soil layer (mostly to the 15 cm soil depth); 3. the condition of soil incubation, in particular the temperature of incubation, was available. For each study, we also extracted the number of replications of soil incubation. Site-specific data were also collected from original articles, including geographic information (latitude, longitude), climatic factors (mean annual temperature, mean annual precipitation), soil physical and chemical properties (the content of clay and sand, soil pH), the substrate features (soil organic C, total soil N, and the ratio of soil C to N), and the characteristics of soil microbial biomass (soil microbial biomass C and the C:N of soil microbial biomass). All data were directly extracted from the text, tables, and figures with the latter extracted by GetData Graph Digitizer (version 2.22). When the climatic factors were unavailable in the original article, they were derived from climatic database (http://worldclim.org/) with grid precision of 0.5 × 0.5° according to geographic information (i.e. latitude and longitude).
The final dataset of Qmin comprised 871 observations from 79 published articles. The dataset encompassed four types of terrestrial ecosystems and included croplands (292 observations), forests (238 observations), grasslands (147 observations), and wetlands (52 observations) (figure 1(a)). The spatial pattern of observations was: 306 from Asia, 160 from Europe, 101 from Australia, 99 from North America, 10 from South America, and the others without geographic coordinates. The range of mean annual temperature varied from −2.2 °C to 30.1 °C, and the range of mean annual precipitation was from 85 to 3100 mm. The soil pH ranged from 3.5 to 9.1, and the content of soil clay from 2.0% to 75.2%.
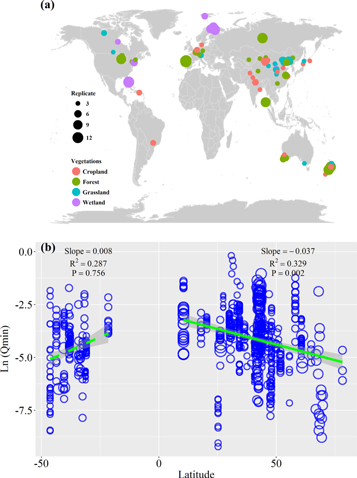
Figure 1. Global distribution of soil metabolic quotient of nitrogen mineralization (Qmin) in this study (a) and the patterns of soil metabolic quotient of nitrogen mineralization (Qmin) along with latitude (b). The colours stand for the types of ecosystem among cropland, forest, grassland, and wetland. The size of dots refers to the number of replicates ranging from 1 to 12(a). The green line is the mean slope and grey shades are 95% confidence intervals of the slope by a linear mixed-effect model (b). The solid green line stands for the significant relationship, and the dash green line stands for the nonsignificant relationship. The size of blue dots refers to the number of replicates (from 1 to 12).
Download figure:
Standard image High-resolution imageData analyses
To calculate the soil Qmin, we adjusted the N mineralization to reference temperature (Xu et al 2017), i.e. 25 °C, as the majority (525 out of 871 observations) of soil N mineralization were measured at 25 °C. All N mineralization rates were standardized on the basis of the Q10 of N mineralization, similar to Liu et al (2017), using the following formula:

where Nmin1 and Nmin2 are the original soil N mineralization and adjusted N mineralization at 25 °C, respectively. T1 is the measured temperature for Nmin1.
We calculated soil Qmin similarly to the metabolic quotient of soil respiration by Xu et al (2017).

where Qmin is the metabolic quotient of net soil N mineralization, Nmin2 is the net N mineralization rate at 25 °C, and MBN is the soil MBN.
We examined the patterns of soil Qmin and its controlling factors at a global scale using a linear mixed-effect model. Firstly, we tested the patterns of soil Qmin along latitude and longitude, and then we explored the relationships between soil Qmin and the controlling factors. The model was used as:

where β0, β1, πstudy and ε are the intercept, slope coefficient, the random effect, and sampling error, respectively. The random effect took the autocorrelation among observations within each 'study' into account. The bivariate relationships between ln (Qmin) and variable were presented as the intercept (β0) plus coefficient (β1) times variable plus residuals (ε).
Secondly, the relationship between soil Qmin and each environmental factor was examined in each ecosystem type. All data were standardized using z score normalization in each ecosystem, and the relationships were tested by equation (3). The slope ± its 95% confidence intervals of each relationship were graphically presented. All statistical analyses were conducted with R (version 3.5.0., R Development Core Team, Vienna, Austria).
Thirdly, structural equation modelling (SEM) was used to explore the multivariate relationships between soil Qmin and environmental factors using the normalized data. Initially, we constructed the conceptual SEM, where the climatic factors (mean annual temperature, mean annual precipitation), soil properties (soil pH and the content of soil clay), the substrate (the content of soil N and the ratio of soil C to N), and the properties of soil microbial biomass (soil microbial biomass C and the C:N ratio of soil microbial biomass) might be directly related to soil Qmin. There were also relationships among the environmental factors. For instance, the properties of soil microbial biomass might be influenced by climatic factors and soil properties. The conceptual SEM was tested with the piecewiseSEM package (Lefcheck 2016). To prevent overfitting, we removed variables, e.g. mean annual precipitation, that were not significantly related to soil microbial biomass C, the C:N ratio of soil microbial biomass, and soil Qmin. The optimal SEM was chosen with the lowest Akaike Information Criterion value.
Results
Bivariate relationships of Qmin with latitude, climatic variables, soil properties, and microbial biomass at a global scale
Soil Qmin was the highest at the equator and tended to decrease with the increasing latitude in both Northern (r2 = 0.33, P = 0.002; figure 1(b)) and Southern Hemisphere (r2 = 0.29, P = 0.756). There was no significant relationship between Qmin and longitude (r2 = 0.32, P = 0.319; figure S1 is available online at stacks.iop.org/ERL/15/034005/mmedia).
Soil Qmin increased with mean annual temperature with the slope being 1.29 (r2 = 0.32, P = 0.003; figure 2(a)), but did not significantly change with mean annual precipitation (r2 = 0.30, P = 0.397; figure 2(b)). Soil Qmin decreased with soil pH (r2 = 0.35, P = 0.033; figure 3). Soil Qmin was slightly higher in soils with higher content of sand, and slightly lower with higher contents of clay, but the relationships of Qmin with soil sand or clay contents were not statistically significant (r2 = 0.37, 0.39; P = 0.268, 0.559; respectively).

Figure 2. The bivariate relationships between soil metabolic quotient of nitrogen mineralization (Qmin) with mean annual temperature (MAT) and mean annual precipitation (MAP) using logarithm transformation data. The green line is the mean slope and grey shades are 95% confidence intervals of the slope by a linear mixed-effect model. The solid green line stands for the significant relationship, and the dash green lines stand for the nonsignificant relationships. The size of blue dots refers to the number of replicates (from 1 to 12). The number after N without parentheses points to observations, and the number in parentheses points to studies.
Download figure:
Standard image High-resolution image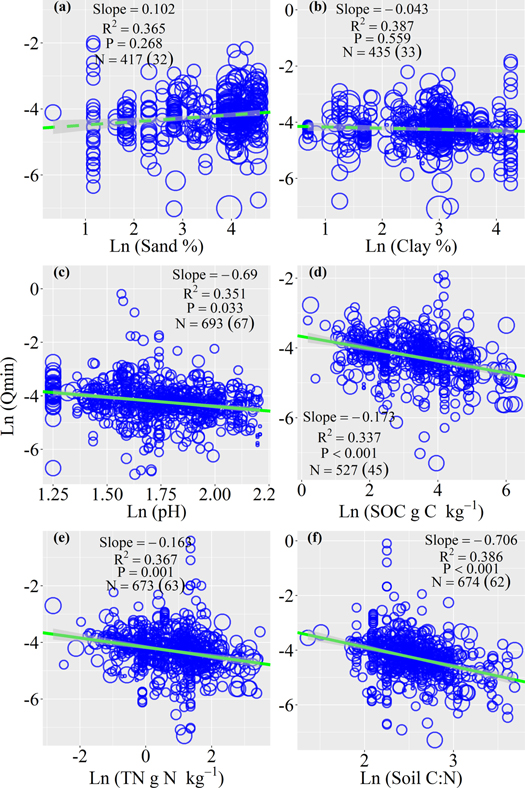
Figure 3. The bivariate relationships between soil metabolic quotient of nitrogen mineralization (Qmin) with the content of soil sand and clay, soil pH, soil organic matter (SOC), total soil nitrogen (TN), and the ratio of soil carbon to nitrogen (soil C:N) using logarithm transformation data. The green line is the mean slope and grey shades are 95% confidence intervals of the slope by a linear mixed-effect model. The solid green line stands for the significant relationship, and the dash green lines stand for the nonsignificant relationships. The size of blue dots refers to the number of replicates (from 1 to 12). The number after N without parentheses points to observations, and the number in parentheses points to studies.
Download figure:
Standard image High-resolution imageSoil Qmin was significantly related to the properties of the substrate and microbial biomass. Specifically, soil Qmin decreased with the content of soil organic C with the slope being −0.17 (r2 = 0.34, P < 0.001; figure 3(d)) and the content of total soil N (r2 = 0.37, P = 0.001; figure 3(e)). Moreover, there was a negative relationship between soil Qmin and the ratio of soil C to N (r2 = 0.39, P < 0.001; figure 3(f)). Soil Qmin decreased with soil microbial biomass C (r2 = 0.30, P < 0.001; figure 4). But soil Qmin increased with the C:N ratio of soil microbial biomass (r2 = 0.37, P < 0.001).
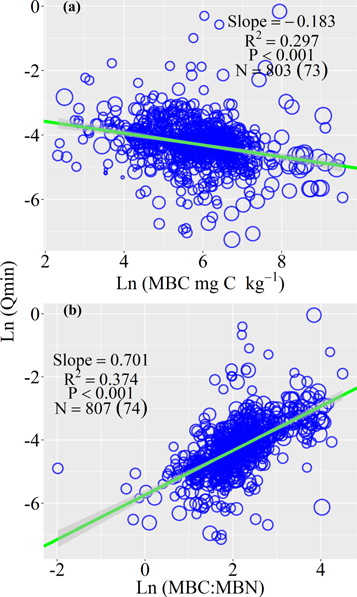
Figure 4. The bivariate relationships between soil metabolic quotient of nitrogen mineralization (Qmin) with the soil microbial biomass carbon (MBC) and the stoichiometry of soil microbial biomass (MBC:MBN) using logarithm transformation data. The green line is the mean slope and grey shades are 95% confidence intervals of the slope by a linear mixed-effect model. The size of blue dots refers to the number of replicates (from 1 to 12). The number after N without parentheses points to observations, and the number in parentheses points to studies.
Download figure:
Standard image High-resolution imageMultivariate relationships between soil Qmin and its controlling factors
SEM indicated that mean annual temperature, soil pH, soil microbial biomass C, the C:N ratio of soil microbial biomass had direct effects on soil Qmin at a global scale (figure 5). Specifically, soil Qmin was positively related to mean annual temperature (coefficient = 0.26, P < 0.001) and the C:N ratio of soil microbial biomass (coefficient = 0.39, P < 0.001), while Qmin was negatively related to microbial biomass C (coefficient = −0.20, P = 0.024) and soil pH (coefficient = −0.11, P < 0.001).
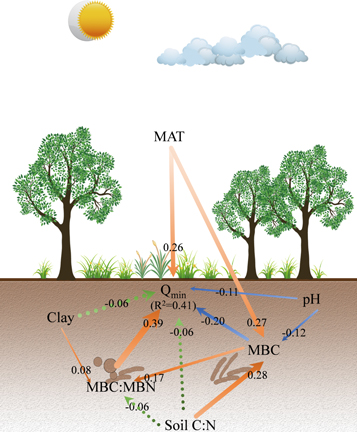
Figure 5. Structural equation model (SEM) to reveal the multiple relationships of soil metabolic quotient of nitrogen mineralization (Qmin) at a global scale. The orange lines are the significantly positive relationships, the blue lines are the significantly negative relationships, and the green dash lines stand for non-significant relationships where the significant level is set at α = 0.05. Arrow represents a directional influence of one variable upon another. Numbers aside arrows are standardized coefficients. R2 stands for the amount of variation of the variable interpreted by variables. MAT, soil C:N, MBC, and MBC:MBN represent mean annual temperature, the ratio of soil carbon to nitrogen, soil microbial biomass carbon, and carbon: nitrogen ratio of soil microbial biomass, respectively.
Download figure:
Standard image High-resolution imageMean annual temperature, soil pH, and the ratio of soil C to N also influenced soil Qmin via changing soil microbial biomass C. The effects from mean annual temperature (coefficient = 0.27, P = 0.006) and the ratio of soil C to N (coefficient = 0.28, P < 0.001) on soil microbial C were positive, whereas the effect from soil pH on soil microbial biomass C was negative (coefficient = −0.12, P = 0.046). Moreover, soil microbial biomass C (coefficient = 0.17, P < 0.001) and the content of soil clay (coefficient = 0.08, P = 0.041) positively influenced soil Qmin via changing the C:N ratio of soil microbial biomass.
Among these relationships, the correlation between the C:N ratio of soil microbial biomass and soil Qmin was prominent with standardized coefficient of 0.39. The total effect (the sum of direct and indirect effects) of mean annual temperature on soil Qmin was of the second importance (standardized coefficient = 0.21). The lesser important factors included soil microbial biomass C (total effect = −0.13) and soil pH (total effect = −0.09).
The bivariate relationships between soil Qmin and impacting factors in different ecosystems
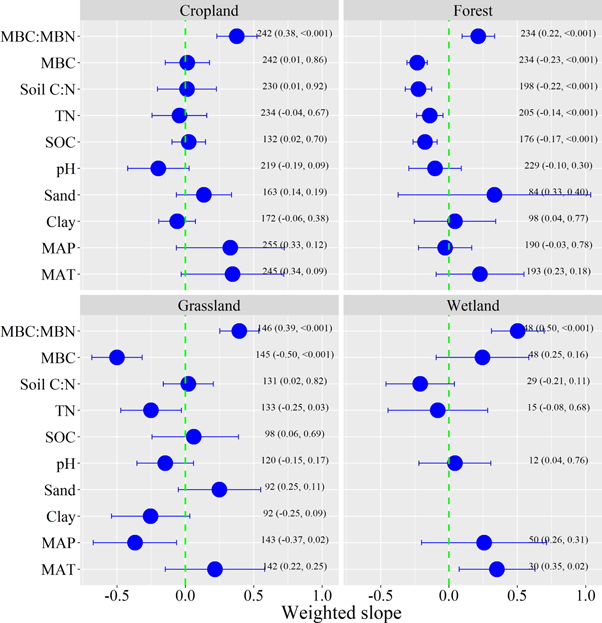
Soil Qmin correlated positively with the C:N ratio of soil microbial biomass in all ecosystem types, with the slope being 0.38 (SE = ±0.075; P < 0.001) in croplands, 0.22 (SE = ±0.061; P < 0.001) in forests, 0.39 (SE = ±0.072; P < 0.001) in grasslands, and 0.50 (SE = ± 0.098; P < 0.001) in wetlands (figure 6). Besides the C:N ratio of soil microbial biomass, the determinants on soil Qmin differed with ecosystem type. In croplands, soil Qmin correlated positively with mean annual temperature (slope = 0.34, SE = ±0.191; P = 0.088) and negatively with soil pH (slope = −0.19, SE = ±0.115; P = 0.087). In forests, soil Qmin correlated significantly with soil microbial biomass C (slope = −0.23, SE = ±0.038; P < 0.001), soil organic C (slope = −0.18, SE = ±0.045; P < 0.001), total soil N (slope = −0.14, SE = ±0.096; P < 0.001), and the ratio of soil C to N (slope = −0.22, SE = ±0.096; P < 0.001). In grasslands, soil Qmin was negatively related to soil microbial biomass C (slope = −0.50, SE = ±0.094; P < 0.001), total soil N (slope = −0.25, SE = ±0.113; P = 0.030), and mean annual precipitation (slope = −0.37, SE = ±0.155; P = 0.021). In wetlands, soil Qmin decreased significantly with the mean annual temperature (slope = 0.35, SE = ±0.141; P = 0.019).
Figure 6. The slopes of the bivariate relationships from the linear mixed-effect model between soil metabolic quotient of nitrogen mineralization (Qmin) and MAT, MAP, Clay, Sand, pH, SOC, TN, soil C:N, MBC, MBC:MBN after data normalization across ecosystems. The blue dot is mean ±95% confidence intervals of the slope between Qmin and variable. The values in parentheses are the value of slope and p, respectively, and values without parentheses are the number of observations. MAT, MAP, SOC, TN, soil C:N, MBC, MBC:MBN represent mean annual temperature, mean annual precipitation, total soil organic carbon, total soil nitrogen, the ratio of soil carbon to nitrogen, soil microbial biomass carbon, and carbon: nitrogen ratio of soil microbial biomass, respectively.
Download figure:
Standard image High-resolution image
Discussion
This study reveals the global pattern of soil Qmin and comprehensively quantifies the determinants of soil Qmin. The C:N ratio of soil microbial biomass predominantly determines the variations of soil Qmin at the global scale and in individual ecosystem type in comparison with climate and soil physical and/or chemical properties (figures 5 and 6). This finding, together with the previous one which found that the amount of soil microbial biomass drives the variations of global soil N mineralization (Li et al 2019), highlights the roles of soil microbial traits in soil N cycling. Thus, changes in the stoichiometry of soil microbial biomass under climate change and/or anthropogenic disturbances would cause significant impacts on soil N cycling.
The drivers of global soil Qmin
The C:N ratio of soil microbial biomass is the paramount factor determining the global variation of soil Qmin, which showed positive relationship with each other. Previous studies found a negative relationship between soil metabolic quotient of soil respiration and microbial C:P, which indicates the significant influences of microbial stoichiometry on soil metabolic quotient of soil respiration (Hartman and Richardson 2013). As pointed out by Cleveland and Liptzin (2007), soil microbial stoichiometry could mirror the relative microbial nutrient limitation. At a global scale, soil microbial biomass is relatively restricted by N in the terrestrial ecosystem (Cleveland and Liptzin 2007). Therefore, microbes increase N metabolism to gain N. Greater exudation of enzymes used to obtain N from the environment may be a strategy for microbes when available N is limited. Urease is negatively correlated with the contents of soil inorganic N (Ajwa et al 1999). Moreover, the arginine deaminase, alanyl aminopeptidase, lysyl–alanyl aminopeptidase increase under low N treatment (Enowashu et al 2009). The exudation of enzymes might consume the N of microbial biomass, which, in turn, result in higher C:N ratio of soil microbial biomass. When N is limiting, the metabolism of soil microbes should be more sensitive to N availability. Consistent with our assumption, the catabolic activity of soil microbial biomass increases with the additional N input in the natural ecosystem (i.e. grassland in Cedar Creek) (Fierer et al 2012). In addition, soil physical property (i.e. the content of clay) and microbial biomass influenced soil Qmin via changing the C:N ratio of soil microbial biomass (figure 5), indicating that the properties of soil microbial biomass are the critical bolt for soil Qmin.
Mean annual temperature is the second important controlling factor on soil Qmin on a global scale. The previous experiment also shows that the microbial metabolic quotient of soil respiration substantially increases with temperature (Xu et al 2006, Nazaries et al 2015). This phenomenon is ascribed to the increasing costs of sustaining microbial activities under higher temperature (Alvarez et al 1995), which is verified by decreasing C utilization efficiency under higher temperature (65.4% for 15 °C versus 59.5% for 25 °C) (Steinweg et al 2008). Additionally, the activities of soil extracellular enzymes accelerate under higher temperature. For example, the activity of soil urease significantly increases by 33% in a natural forest when the soil temperature rises by 0.55 °C (Xu et al 2010). The results from 16 experiments across the United States revealed that experimental warming significantly increases proteolytic activity by 18% in organic horizons (Brzostek et al 2012). When the soil temperature is increased by 0.98 °C, soil N-acetylglucosaminidase increases by 5% or even up to 21% (Zhou et al 2013). These suggest that increasing mean annual temperature under global climate change might accelerate soil N cycling via motivating soil Qmin.
The size of soil microbial biomass C negatively influenced soil Qmin, which might attribute to three reasons. First, given the same amount of soil substrate, with more soil microbes, the efficiency of decomposing substrate might become less. Second, soil microorganisms are highly diverse, and they could be grouped into active, potentially active, and dormant microbial states (Blagodatskaya and Kuzyakov 2013). In general, majority of soil microbial biomass cannot participate in ecosystem processes (Blagodatskaya and Kuzyakov 2013). This might account for the negative relationship between soil microbial biomass C and Qmin. Third, the bigger soil microbial community might arouse a greater competition with one another. Given the scarcity of resources in most soil ecosystems, more soil microbes might lead to fierce competition (Ghoul and Mitri 2016). The microbes might excrete the secondary metabolites, i.e. antibiotics, to compete with one another. This could consume the energy of microorganism. It was reported that 5%–10% of genomes link to secondary metabolites in actinomycetes (Nett et al 2009). Consistent with the negative relationship between soil Qmin and microbial biomass C, soil microbial metabolism of respiration with ecosystem succession shows the contrary trends in comparison with that of the microbial biomass (Wardle and Ghani 2018).
Soil pH is the second negative controller on global soil Qmin. Soil pH could negatively influence the activities of enzymes taking part in N cycling. A global synthesis revealed that β-N-acetylglucosaminidase decreases (slope = −0.54) with pH changing from 4 to 9 (Sinsabaugh et al 2008). The activity of urease decreases when soil pH increased from 4.5 to 8.5 (Singh and Nye 1984). In addition, previous studies found that some protease is optimal under acidic conditions (Kamimura and Hayano 2000).
The drivers of soil Qmin in different ecosystems
Although the positive relationships between soil Qmin and C:N ratio of soil microbial biomass were consistently found across all ecosystem types, there were different drivers, other than the C:N ratio of soil microbial biomass, on soil Qmin in different ecosystem types. In forests and grasslands, soil Qmin was correlated negatively with soil microbial biomass C. The soils in forests (644 μg g−1 soil) and grasslands (416 μg g−1 soil) usually possess more microbial biomass C than adjacent croplands (313 μg g−1 soil) (Prasad et al 1995). It was reported that soil microbial biomass increases along the forest succession (Wardle and Ghani 2018), the competition among microorganisms likely increases as well, indicating an increasing negative regulation of microbial biomass on Qmin. In grasslands, soil Qmin also significantly correlated with mean annual precipitation. The water shortage in grasslands might limit soil N cycling (Reichmann et al 2013, Hu et al 2015). In wetlands, soil Qmin significantly accelerated with higher mean annual temperature. The higher temperature can expedite the microbial metabolism (Tveit et al 2015) and the activities of soil extracellular enzymes (e.g. urease increased by 9%; (Bai et al 2018)). Soil N mineralization generally occurs under aerobic conditions, the anaerobic condition of wetland might partially mask the other relationship between soil Qmin and soil microbial properties (i.e. microbial biomass C).
In croplands, the insignificant relationship between soil Qmin and microbial biomass C may be due to that anthropogenic disturbance significantly impacts soil microbial biomass (Helgason et al 2010, Da Silva et al 2014). The croplands exposed to greatest anthropogenic disturbances, such as tillage, fertilization, etc, may directly affect the size of soil microbial biomass. For instance, soil microbial biomass C decrease by 19% under tillage (Zuber and Villamil 2016), wherein the relationship between soil Qmin and microbial biomass should be enhanced. However, the disturbance could break the competition among the community (Huston 1979). For example, tillage could weaken the competition within the soil microbial community (Bailey and Lazarovits 2003). Particularly, fertilization (e.g. urea) provide more substrate to mineralize by microbial biomass, so the negative relationship between soil Qmin and microbial biomass weakened or even disappeared (figure 6). However, soil pH exhibited marginally significantly negative influence on soil Qmin. The fertilization could elicit soil acidification (Guo et al 2010). The acidification could positively affect soil Qmin by changing the activities of soil enzymes in N cycling. For instance, soil urease activity decreases with higher soil pH (Singh and Nye 1984).
Implications and uncertainties
The changes in soil microbial stoichiometry under global change will play an important role in soil N cycling via changing soil Qmin. As reported, the ratio of C to N in bacteria averages 6.5, but that in fungi is 5–17 (Cleveland and Liptzin 2007), therefore, any shift in the ratio of fungi to bacteria under global change could eventually change soil Qmin. The results from a 3 year warming experiment showed that the ratio of fungi to bacteria increases 22%–63% (Zhang et al 2005). The C:N ratio of soil microbial biomass is also increased by 0.8%–6.2% in an alpine meadow under warming (Fu et al 2012). A 70% increase of N mineralization in arctic zones under warming (Aerts et al 2006) is partially ascribed to the changes in microbial biomass stoichiometry and increases of enzymatic activities. Additionally, the changes in the stoichiometry of soil microbial biomass, which is significantly decreased under N deposition (Bell et al 2010), will negatively affect soil Qmin and subsequently reduce the N mineralization. Moreover, the ratio of fungi to bacteria increases by 8% at elevated CO2 (Guenet et al 2012), which likely results in higher soil Qmin under increasing atmospheric CO2 concentrations.
More severe soil acidification under N deposition and/or N addition might elicit significant changes in soil N cycling. Apart from the direct effect of soil pH on soil Qmin, the indirect effect via changing the size of soil microbial biomass is also important. Soil pH generally dominates the distribution patterns of bacteria (Fierer and Jackson 2006) and fungi at the global scale (Tedersoo et al 2014). The bacterial community is more sensitive to soil pH than fungi (Rousk et al 2010). Moreover, the fungal: bacterial growth is significantly decreased with soil pH ranging from 3 to 8 (Rousk et al 2011). The meta-analysis showed that soil pH has decreased on average by 0.26 in natural ecosystems (Tian and Niu 2015) and 0.5 in croplands (Guo et al 2010). To meet the food demand in the context of population growth, the fertilizer inputs might not decrease in the next century (Erisman et al 2008), which will strengthen soil acidification. Eventually, soil acidification would fortify the microbial ability of soil N mineralization.
Current soil N models are built on either the dynamics of N pool (Wang et al 2004) or the empirical response of soil mineralization to temperature (Paul et al 2002). However, the microbial mechanisms have not been well presented in models to predict soil N availability. Soil microbial properties, like the size of microbial biomass and the stoichiometry, are very sensitive to environmental changes (Buchkowski et al 2015). With mounting data on the stoichiometry of microbial biomass (Xu et al 2013), it is urgent to incorporate soil microbial mechanisms into global N cycling model (Wieder et al 2015a).
We are aware that changes in soil microbial community and extracellular enzymes are also important for soil N cycling. However, due to data paucity, they are unable to be included in this study. The projection of soil biogeochemical processes will be more precise when the responses of soil microbial communities are taken into consideration (Karhu et al 2014). Soil extracellular enzymes are the direct participants in biogeochemical processes, which have drawn growing attentions in biogeochemical processes (Chen et al 2018), and there are many enzymes in N cycling, such as urease, proteinase, amidases, and deaminases, etc However, there is a shortage of data to reveal the influences of soil enzymes on soil Qmin on a global scale. In addition, soil Qmin was calculated using the data from laboratory incubation, which might be higher than that calculated using in situ data, but they could show a similar relationship at the global scale (r2 = 0.87) (Xu et al 2017). The relationships between soil Qmin and the impacting factors remain to be tested when there would be enough data from field studies.
Conclusion
Understanding the drivers of soil Qmin is essential because soil N mineralization and availability are crucial for ecosystem productivity and C sequestration, especially in the context of global climate change or anthropogenic disturbances (Reich and Hobbie 2013, Wieder et al 2015b). The present work demonstrates that, although the climate and soil physical and/or chemical properties significantly affect soil Qmin, the stoichiometry of soil microbial biomass primarily determines the variations of soil Qmin at a global scale, and this relationship is consistent across ecosystems. This study is one of the first attempts to quantify the general pattern of Qmin and its dominant drivers across a wide range of climatic and edaphic environments, which moves us toward a more mechanistic understanding of how changes in soil microbial biomass stoichiometry regulate soil N cycling in terrestrial ecosystems. Our findings provide experimental evidence and mechanistic understanding for parameterizing and benchmarking biogeochemical models. We call for future studies on soil microbial traits, with more attention to soil microbial community and extracellular enzymes, to further reveal the biological mechanisms underlying soil Qmin variation.
Acknowledgments
This study was supported by the National Natural Science Foundation of China (31988102, 31625006), the CAS international collaboration program (131A11KYSB20180010), and the Postdoctoral Science Foundation of China (2018M641459). The dataset used in this study can be accessed in the appendix. The patterns of soil Qmin with longitude (figure S1) were attached as supporting information.
Competing interests
The authors declare no competing financial interests.
Author contributions
Z Li and S Niu wrote the first draft. All the authors contributed to the writing of the paper.
Data statement
Any data that support the findings of this study are included within the article. The dataset is archived from published articles. The list of references for dataset is publicly available and can be accessed in the appendix.