

Abstract
Direct emissions from commercial-scale composting are uncertain. We used micrometeorological methods to continuously measure greenhouse gas (CO2, CH4, N2O) emissions from full composting of green waste and manure. We measured oxygen (O2), moisture, and temperature continuously inside the composting pile, and analyzed chemical and physical characteristics of the feedstock weekly as potential drivers of emissions. Temperature, moisture, and O2 all varied significantly by week. Feedstock porosity, C:N, and potential N mineralization all declined significantly over time. Potential net nitrification remained near zero throughout. CH4 and CO2 fluxes, indicators of feedstock lability, were variable, and most emissions (75% and 50% respectively) occurred during the first three weeks of composting. Total CH4 emitted was 1.7 ± 0.32 g CH4 kg−1 feedstock, near the median literature value using different approaches (1.4 g CH4 kg−1). N2O concentrations remained below the instrument detection. Oxygen, moisture and temperature exhibited threshold effects on CH4 emissions. Net lifecycle emissions were negative (−690 g CO2-e kg−1), however, after considering avoided emissions and sinks. Managing composting piles to minimize methanogenesis—by maintaining sufficient O2 concentrations, and focusing on the first three weeks—could reduce emissions, contributing to the climate change mitigation benefit of composting.
Export citation and abstract BibTeX RIS

Original content from this work may be used under the terms of the Creative Commons Attribution 3.0 licence. Any further distribution of this work must maintain attribution to the author(s) and the title of the work, journal citation and DOI.
Introduction
Organic waste in landfills and manure slurries is a large source of greenhouse gas emissions globally [1, 2]. Manure alone accounts for 10% of global agricultural emissions [2]. Diverting organic waste to composting may lower greenhouse gas emissions, but there is uncertainty regarding emissions from the composting process. Composting, the aerobic degradation of organic matter mediated by microbes, is used to manage wastes and recycle nutrients into the soil [3]. Under aerobic conditions, organic waste is converted to stable material; microbial respiration emits mostly carbon dioxide (CO2) and N mineralization predominantly produces ammonium (NH4+). Compost piles often have pockets of anaerobiosis, and even well-managed composting emits methane (CH4) and nitrous oxide (N2O) [1], greenhouse gases that trap 34 and 298 times more heat than CO2, over 100 years [4].
Aerobic composting follows four phases. In the first mesophilic (25 °C–40 °C) stage, primary decomposers break down easily degradable material, releasing CO2 and heat. High redox potentials allow for the presence of nitrifying and denitrifying bacteria, potentially emitting N2O [5]. The thermophilic (40 °C–65 °C) stage features increasing microbial activity and temperatures, which can favor oxygen (O2) consumption and methanogenesis [5]. The second mesophilic stage begins as easily degradable material is consumed, and thermophilic activity and compost temperature decrease. During maturation, bacterial numbers decline and fungal populations increase as easily degraded material is exhausted. Recalcitrant material dominates and temperature declines to ambient levels [6].
Emissions from composting at a commercial scale are not well characterized. Of the studies that have measured emissions from composting e.g. [7–10], few measured continuously, few measured at field scale [10] and estimates of total emissions vary widely (table S1 is available online at stacks.iop.org/ERL/14/124027/mmedia). One reason composting emissions are poorly constrained is that effective measurement requires technologically advanced instrumentation due to the scale and heterogeneity of compost piles. Methods used to measure greenhouse gases from composting include micrometerological (e.g. eddy covariance, mass balance) [11] and non-micrometerological techniques (e.g. static chambers). Chamber techniques measure at small scales (<1 m) and introduce sources of bias, including altering pressure and concentration gradients, physically disturbing the source, leakage, difficulty in capturing spatial and temporal variation, and potential for significant human error [9, 12, 13]. Enclosing the emitting source[7] facilitates emission measurement, but introduces artifacts from altering ambient conditions and degradation dynamics.
Micrometeorological methods use physical, chemical, and engineering principles to estimate greenhouse gas fluxes by continuously measuring gas concentrations and wind dynamics. The micrometeorological mass balance (MMB) approach measures gas concentrations going into and coming out of a control volume surrounding an emitting source. The source's emission rate is calculated by subtracting the input from the output flux [11].
Three previous studies [7, 8, 12] used micrometeorological approaches to measure emissions from composting, though none measured fluxes from a commercial process, nor from composting manure with green waste. These studies provided a basis upon which the methodology was developed. Amlinger et al (2008) used a large chamber enclosing a compost windrow and measured gas concentrations at the inflows and outflows. This approach captured emissions, though covering the pile may have altered gas fluxes by increasing temperature and moisture, and affecting the concentration gradient from the source to the atmosphere. Sommer et al (2004) and Kent (2010) used a MMB approach. Sommer (2004) measured concentrations of gases upstream and downstream of a circular manure pile, not the windrow formation typical of commercial composting operations, and Kent (2010) analyzed emissions from green waste composting in windrows, but the study encountered instrumentation malfunctions, and was short in duration (5 weeks).
Understanding how environmental variables influence greenhouse gas fluxes is critical for modeling, extrapolating results, and developing strategies to reduce emissions. Though composting is mostly aerobic, the heterogeneity of the feedstock, temperature and moisture, microbial activity, and the pile structure can create variable redox conditions. In the absence of oxygen (O2), a succession of microbes converts carbohydrates in the organic waste to CO2 and CH4 [14]. O2 availability is affected by feedstock porosity [7, 15], turning frequency [5], and pile size. Once CH4 is produced, it may be emitted to the atmosphere or oxidized to CO2 within the pile. The balance between CH4 production and oxidation is likely controlled by redox potential [16] and is affected by temperature and moisture, which control O2 solubility and biological activity [17, 18].
Nitrification, the conversion of NH4+ to NO3−, and denitrification, the conversion of NO3− to nitrogen gas (N2 and N2O), are the major pathways leading to N2O production and consumption [19]. Net emission of N2O is dependent on the controls on both processes. The production of NO3− during composting poses a potential water eutrophication threat. Nitrification is regulated by NH4+ supply, pH, and redox potential; denitrification is dependent on NO3− supply, C availability, and redox. N2O fluxes are expected to increase as the C:N ratio of organic matter decreases, as the N availability increases [20] and as O2 concentrations decline [19].
This study is the first to continuously measure greenhouse gas emissions from the commercial-scale composting of manure and green waste. Three questions guided our research: (1) how do environmental and biogeochemical characteristics vary during composting?; (2) what are the whole-pile emissions of CO2, CH4, and N2O, and how are they related to environmental and biogeochemical variables?; and (3) what are the net lifecycle greenhouse gas emissions from composting green waste and manure? We used field experiments, laboratory assays, and lifecycle modeling to answer these questions.
Methods
Site description and experimental set-up
The experiment was conducted at the West Marin Composting Facility in Nicasio, California, from February through September 2016. A windrow pile (15 m × 2 m × 4 m) comprised of manure (mostly cattle, with goat, horse, chicken) and yard waste (branches, leaves, grass) was composted. The starting pile was 55% manure by volume and 91% manure by mass. The pile was managed as a commercially-produced compost pile: with weekly turning using a large-scale mechanical windrow turner (Scarab 18), periodic watering, and a 98 d duration.
Sensor system and laboratory analyses
Conditions inside the piles were monitored continuously using 27 automated sensors. Nine O2 (Apogee SO-110), temperature (Campbell 107), and moisture (Campbell CS616) sensors each were placed in three transects along the length of the pile, at three heights (0.50 m, 1 m, 1.5 m), in the center of the pile (figures S1-2). Sensors were removed briefly for weekly pile turning (<60 min). Compost grab samples were collected weekly into 1 gallon Ziploc bags from three heights (0.5 m, 1 m, 1.5 m—at 2 m horizontal depth) before and after pile turning (n = 6). Samples were analyzed for gravimetric moisture content by weighing 10 g samples before and after drying at 105° C for 24 h. Compost pH was measured by suspending 3 g of sample in 12 g of water [21]. We estimated porosity by weighing a mason jar with a volume of 100 ml of collected compost, adding 100 ml distilled water, and re-weighing to determine the volume of the pore space [22] (n = 5 per sample). Note that collecting samples for porosity may result in disturbance to the sample and thus not represent exact in situ conditions. Potential net N mineralization and nitrification were determined using dark laboratory incubations; 3.5 g compost samples were extracted before and after incubation (7 d) in 75 ml of 2 M KCl (n = 3 per sample) [23]. Total C and N were measured on air-dried, sieved (2 mm) and ground samples using an elemental analyzer (Carlo Erba Elantech, Lakewood, NJ, USA).
MMB method
The pile was outfitted with a greenhouse gas and wind measurement system. Four gas towers (figure S2, A–D) were placed at cardinal directions along each edge of the windrow, 1 m from the pile edge; each of these towers held four gas intakes (heights of 0.25, 1, 2, and 3.5 m). Air samples were continuously drawn through 16 Teflon tubes, delivering gas samples to a G2308 cavity ring down laser spectrometer (Picarro, Santa Clara, CA), which measured real-time CO2, N2O and CH4 concentrations. The instrument was calibrated using a three-point calibration curve, using zero (pure N2 gas), intermediate (304 ppm CO2, 0.513 ppm N2O, 1.05 ppm CH4), and high (1000 ppm CO2, 10 ppm N2O, 10 ppm CH4) standard concentrations. The instrument sensitivity is high for CH4 and N2O (raw precision <10 ppb and <25 ppb, respectively), but low for CO2 (<20 ppm). While one intake port delivered gases to the greenhouse gas analyzer (1 min per intake), the other 15 lines were flushed with ambient air.
Two wind towers on the NW and SE corners of the windrow held four 3D sonic anemometers (Gill Windmaster Pro) each, at four heights (0.25 m, 1 m, 2 m, 3.5 m), measuring wind speed and direction at 0.1 Hz. The high frequency wind and gas concentration data were combined to measure greenhouse gas concentrations upwind and downwind of the pile, and calculate the flux of CO2, CH4 and N2O from composting, using MMB [11, 24]. The flux (g m−2 s−1) from the source was approximated:

where L (m) is the fetch (horizontal distance that air travels over the source),  represents mean horizontal wind speed at height z (m s−1), and
  and
and  are the mean gas concentrations (g m−3) at height z downwind and upwind of the source. The flux describes the mass of trace gas emitted per unit time, per cross-sectional area of the source (the windrow pile).
Statistical analyses and emissions calculations
Statistical analyses were performed using the open-source statistical software 'R.' Sensor readings were logged every half hour for the duration of the experiment. Two-way, repeated measures ANOVA was used to test the null hypotheses that sensor values did not change by week or position (top, middle, or bottom of pile), and to test variability of weekly physical and chemical properties of the composting material (pH, porosity, N mineralization, nitrification, C:N, moisture).
Wind speed and direction, and gas concentrations were averaged in 8 min blocks, and fluxes were calculated using equation (1), after screening for wind direction. An angle allowance of  30 degrees was used to determine upwind and downwind towers for each time block [9]. Relationships between CH4 fluxes and environmental variables (temperature, moisture, and O2) were examined using breakpoint analyses (R package 'strucchange'). The number of breakpoints (1, 2 or 3) with the lowest Bayesian Information Criterion (BIC) was selected; breakpoint significance was determined using a structural change test [25].
Emissions factors were estimated by calculating the area under the mean daily flux curves, for each greenhouse gas, using the R package 'pracma'; we multiplied this integral (g m−2) by the pile volume (m3) divided by the fetch (m) to estimate the total emissions. For CO2 fluxes, we additionally perform a mass balance on C, using laboratory analyses of C content in the composting material over the course of the experiment. We compared our emissions factors to those in the literature, by performing a meta-analysis of published studies that measured greenhouse gas emissions from composting.
To estimate net emissions from composting, we created a lifecycle model, using a functional unit of 1 kg of waste (91% manure, 9% green waste by mass) over one year, employing a system boundary beginning at waste generation, and ending at its final application (land or landfill; figure S3). We simplified the model by including only major contributors to greenhouse gas emissions from waste management: avoided emissions, waste processing, and carbon sequestration from land application [26, 27]. To estimate avoided emissions, we assumed that manure would otherwise be managed in an anaerobic lagoon, a common practice in California [2], and yard waste would be used as alternate daily cover in a landfill [28]; emissions values were taken from Owen and Silver (2015) [2] (manure), and EPA's WARM model (yard waste) [29]. Carbon sequestered from compost application are from Ryals et al (2013) [30]. We assumed that 1 kg wet waste produced 0.5 kg compost.
Results and discussion
Environmental conditions: temperature, moisture, and oxygen
Temperature varied over time and by position in the compost pile, and followed a pattern consistent with microbial degradation of organic feedstocks [31]. Temperatures rose rapidly initially, then decreased as easily-decomposed substrates were consumed (figure 1(a)). Within that pattern was a weekly oscillation, corresponding to turning events: temperature rose steeply following turning, then declined. The lowest temperatures occurred at the start (day 0), and the highest daily mean temperatures were reached on day 8 (74 ± 0.2, 71 ± 0.2, 68 ± 0.1 °C, for top, middle and bottom positions). Temperature varied significantly between weeks (p < 0.05) but not by position in the pile (table S2). Variability of temperature over time is well established in the literature [6, 32]; the composting process is understood as a series of discrete sub-processes (e.g. mesophilic, thermophilic) due to the discontinuity of shifts in temperature and in microbial communities [33]. Variability by location in the pile was observed in another study [34], but was not observed here, possibly due to the high relative lability of manure.
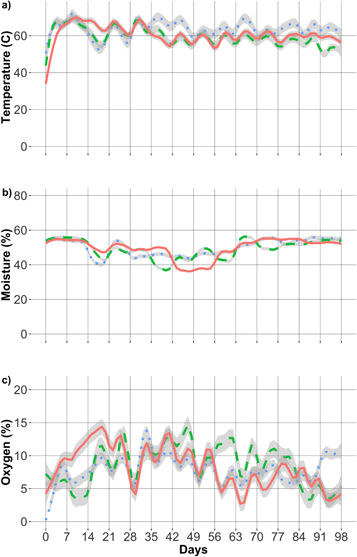
Figure 1. Smoothed daily mean (a) temperature (°C), (b) moisture (%), and (c) O2 (%) (± standard error shown in grey) during composting. Pile turning occurred approximately weekly (vertical lines signify turning events); watering events occurred on days 29, 50, 57, 64, 71, and 78. Solid (red) line = bottom, dashed (green) line = middle, dotted (blue) line = top.
Download figure:
Standard image High-resolution imageMoisture affects the composting rate and end-product characteristics. Model estimates and field data suggest that wet-weight moisture contents around 50% are best for O2 diffusion, water potential, and microbial growth rates during composting [35]. Moisture in the pile varied in response to water consumption and evaporation, and were controlled to keep conditions favorable for decomposition (figure 1(b)). Daily mean moisture varied between 36% ± 0.01% and 56% ± 0.04%. All positions showed moisture increases with pile turning and watering (figure 1(b)). Moisture differed significantly between weeks (p < 0.001), but not by position (table S2).
Oxygen concentrations affect microbial activity, nutrient mineralization, and greenhouse gas dynamics during composting [36]. In this experiment, O2 concentrations followed an oscillating pattern, with the lowest daily mean values occurring near the beginning and end of the experiment, and highest daily means occurring in the middle (figure 1(c)). Similar patterns have been measured in composting bioreactors [36], while field scale data are highly variable and dependent upon feedstock and management [37]. Daily mean O2 concentrations ranged from 0.95% to 15% over the 98 d study. The lowest daily mean values were 1.6 ± 0.06% (day 65), 2.3 ± 0.09% (day 87), and 0.95 ± 0.37% (day 0), and the highest daily mean values were 15 ± 0.29% (day 19), 15 ± 0.09% (day 48), and 14 ± 0.09% (day 34), for the bottom, middle and top positions. O2 level varied significantly by week (p < 0.05), and by the interaction between week and position (p < 0.05) (table S2). Estimated weekly mean O2 consumption rates ranged from 5.3 ± 0.002 mg O2 m−2 s−1 (week 1) to 0.39 ± 0.000 03 mg O2 m−2 s−1 (week 13). Declining O2 consumption is consistent with slower microbial decomposition, and declining availability of labile material.
Biogeochemical characteristics
The average pH values of the composting material ranged from 7.6 ± 0.07 to 9.3 ± 0.01. pH can be an important predictor of N mineralization rates and denitrification potential. However, N mineralization tends to be most sensitive at pH 7 or lower [38, 39]. pH values did not vary significantly by position, week, or whether samples were taken pre- or post-mixing (table S3a). Porosity varied between 0.59 ± 0.02 and 0.84 ± 0.01, and varied significantly by week (p < 0.001), position (p < 0.001), and the interaction between week and position (p < 0.05) (table S3b). Porosity provides an index of physical limitations on O2 diffusion [40, 41]; its value varied over space and time, reflecting feedstock heterogeneity.
The C:N ratio of composting material is an indicator of microbial degradability and the maturity of the composting process [6], and may predict CO2 and N2O emissions [20, 42]. The C:N ratio declined throughout the experiment, mostly due to lowering C concentrations. This decline is consistent with a well-functioning composting process [6]. The C:N ratio varied significantly by week (p < 0.001), and by the interaction between position and state of mixing (pre- or post-mixing) (p < 0.05) (table S4). The feedstock had initial an C:N of 26 ± 0.7 for all positions, consistent with best management practices (25–30) [6], and final values near 20 (21 ± 0.7, 21 ± 0.6, and 19 ± 0.6, for the bottom, middle, and top). Microbes preferentially utilize available forms of C in feedstocks, and emit CO2 (as they metabolize aerobically), or CO2 and CH4 (anaerobic decomposition) [6].
Potential net nitrification remained near zero throughout the experiment (table S5). Daily mean values ranged between −0.20 ± 0.06 and 0.02 ± 0.01 mg N g−1 compost, and weekly means varied from −0.14 ± 0.04 to 0.01 ± 0.06 mg N g−1. Potential net nitrification varied significantly with the interaction between position and week, with higher net NO3− consumption in the top position during the second half of the experiment (p < 0.05). The low rates of nitrification measured are consistent with high temperature inhibition of nitrification [43, 44].
Potential N mineralization values also bracketed zero, with daily means ranging from −0.15 ± 0.06 to 0.34 ± 0.02 mg N g−1 compost, and weekly means varying from −0.11 ± 0.04 and 0.22 ± 0.08 mg N g−1 compost. Mineralization declined throughout the experiment; values differed significantly by week (p < 0.05) (table S5). The highest compost N mineralization rates tend to occur during the thermophilic phase [43, 44].
Greenhouse gas emissions
Methane fluxes varied over time, with most emissions occurring over short periods early in the composting process. Daily mean CH4 fluxes ranged from 17 μg CH4 m−2 s−1 to 4.4 mg CH4 m−2 s−1. The highest CH4 emissions occurred during the first three weeks of composting, during which 75% of total CH4 was emitted. Half of the total CH4 emissions occurred in the first 10 d, and 36% occurred in the first week (figure 2(a)). Most fluxes measured were small, with few days contributing the majority of CH4 emissions. Integrating the daily mean flux curve, the total CH4 emitted was 1.7 ± 0.32 g CH4 kg−1 wet feedstock2 . This emission factor falls between the median (1.4 g CH4 kg−1), and mean (2.2 g CH4 kg−1) literature values found for windrow composting (figure 3, table S1).

Figure 2. (a) Daily mean methane fluxes (±standard error) (above), and cumulative methane emissions (below), over the composting period. (b) Daily mean CO2 fluxes (±standard error) (above), and cumulative CO2 emissions (below), over the composting period. Instrument detection limits, and thus error, were higher for CO2 than for CH4, leading to greater uncertainty in flux measurements.
Download figure:
Standard image High-resolution image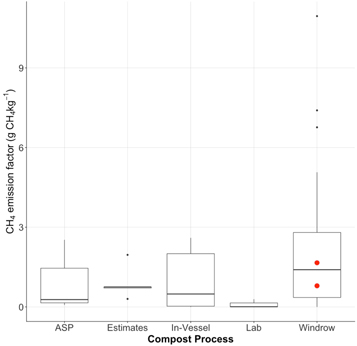
Figure 3. Meta-analysis of literature methane emission factors (g CH4 kg−1 wet feedstock) from composting. Values from this study are superimposed in larger red circles (experimental [1.7 ± 0.32 g CH4 kg−1 wet] and pilot[0.79 ± 0.21 g CH4 kg−1 wet] piles). 'ASP' are aerated static piles; 'Estimates' are not directly measured values; 'In-vessel' are closed systems; 'lab' are lab studies; 'windrow' are windrow composting systems. Where conversions were needed, a GWP of 34 was used for CH4; this value reflects a 100-year GWP, including climate-carbon feedbacks [4].
Download figure:
Standard image High-resolution image
Carbon dioxide fluxes were also variable. Daily mean CO2 fluxes ranged over two orders of magnitude (0.3–30 mg CO2 m−2 s−1) and were an indicator of the C lability of the feedstock. Similar to CH4, most CO2 emissions occurred early, with almost 50% emitted in the first three weeks (figure 2).
Because CO2 emissions from biological systems are considered to rapidly cycle, these biogenic emissions are usually considered to have no net global warming effect [26, 45–48]. Due to a low sensitivity of the analyzer to CO2, the net CO2 fluxes measured (19 ± 3.7 g CO2 kg−1 wet feedstock3 ) likely present an underestimation of this flux. Utilizing laboratory measurements of C content of the composting material over the course of the experiment to perform a C balance on the composting system, we found an upper limit on these emissions to be 100 g CO2 kg−1. The upper and lower estimates are within the range of the CO2 emissions factors found in the literature, as is the high proportion of C loss via CO2 versus CH4 (96% to 4% for the upper emissions factor in this study; other studies found even higher proportions lost as CO2) [49, 50]. From a greenhouse gas mitigation perspective, it is preferable that the C emitted from composting be emitted as CO2 rather than as CH4.
Nitrous oxide (N2O) concentration differences remained below the instrument detection limit (25 ppb + 0.05%), likely reflecting an inability to detect a small signal using micrometeorological methods. The equivalent fluxes of this detection limit (45 μg m−2 s−1) were lower than those observed in the literature (table S1; figure S4). Low emissions may be explained by the high C:N measured, above the threshold (25:1) associated with N2O emissions [20] for the first four weeks (and remaining above 20 throughout), during which decomposition is occurring most rapidly. Additionally, as NO3− is a precursor to N2O, the low NO3− concentrations and nitrification rates measured throughout support the lack of N2O production. Periodic anaerobic conditions and high temperatures likely inhibited nitrification.
Methane was the major contributor to non-biogenic greenhouse gas emissions from composting, and the majority of that CH4 was emitted early in the composting process. The timing of emissions suggests that efforts to further decrease direct emissions from composting should focus on increasing O2 availability in the early stages, when decomposition and C fluxes (as CH4 and CO2) are at their highest.
We identified 17 studies with 53 estimates of total emissions (emissions factors) from composting [5, 7, 10, 36, 49–61]; the studies spanned different composting processes and methods for emission measurement, feedstocks, and time scales (figure 3; table S1). Most studies used static chamber measurements, which yield periodic measurements of greenhouse gas concentrations at the surface of the composting pile. In the spatially heterogeneous and dynamic composting pile, using static chambers can underestimate fluxes. The measurements reported in the literature varied in duration, from 21 to 150 d. Most studies measured the composting of food and/or green waste; three studies [50, 52, 58] considered manure. The current study used methods to continuously measure whole-pile emissions, exceeded 90 d in duration, and used a high-emitting feedstock (manure); thus, we would expect emissions measured to exceed most of those in the literature. That the resulting emissions factor is near the literature's median value suggests that management may play a larger role than feedstock in predicting greenhouse gas fluxes.
Emissions patterns and environmental variables
Environmental variables in the composting pile—O2, moisture, and temperature—exhibited threshold effects on CH4 emissions (figures S5–S7). The breakpoints (thresholds) for CH4 emissions occurred at O2 concentrations of 3.3%, 5.7%, and 6.0% (p < 0.005); these represent O2 levels where the modeled relationship between O2 and CH4 change [25], with higher emissions occurring below, and lower emissions occurring above those thresholds (figure S5).
In low oxygen environments, CH4 emission is controlled by the balance between methanogenesis and methane oxidation. Methanogenesis is favored at low O2 concentrations. Methane oxidation rates vary as a function of CH4 production, O2, moisture, pH, temperature [62–67], and feedstock chemistry [15, 68] and are limited by diffusive transport [62]. While porosity, a physical control on O2 diffusion into the pile, declined over time in our experiment, so did CH4 emissions, suggesting that other factors, including declining temperatures and C availability, played a larger role in controlling emissions than did constraints on O2 diffusion. As expected, we observed the highest CH4 emissions at lower O2 concentrations, coupled with higher moisture, temperatures, and C:N.
Methane fluxes were found to increase more rapidly with temperatures above 65o C (p < 0.1) (figure S6). The moisture threshold was found to be 55% (p < 0.0001); CH4 emissions increased more rapidly with moisture as levels exceeded 55% (figure S7). Moisture between 40% and 60% is recommended for composting [6]; higher levels limit O2 diffusion into the pile [62], while lower levels preclude microbial activity. The patterns of greenhouse gas emissions from composting can also be sensitive to key biogeochemical characteristics, particularly the relative availability of C and N in the decomposing feedstock. However, here we found no clear predictive (linear or polynomial) relationships between CH4 emissions and other chemical or physical characteristics.
Carbon concentrations play an important role in understanding the emissions patterns; the biggest fluxes occur early in composting, and a disproportionate fraction of total emissions occur during the first three weeks, when the feedstock is fresh, and the organic C and N are likely more available to microbes. As composting progresses, the greenhouse gas fluxes decrease as the C and N become more complexed. During the beginning weeks of composting, as microbial degradation speeds up, temperatures and O2 consumption were at their highest; these conditions favor methanogenesis.
Consideration of the larger lifecycle emissions
Total direct greenhouse gas emissions from composting were 57 g CO2-e kg−1 (75–150 g CO2-e kg−1 including biogenic CO2). Direct emissions are one important, and the most uncertain, element of the lifecycle greenhouse gas emissions from composting. Two other major C fluxes include the avoided emissions—emissions that would have occurred under 'business as usual' waste management—and enhanced C sequestration from land application of compost. Using a system boundary that includes these three processes (figure S3), avoided emissions from the landfill (for green waste) and anaerobic lagoons (for manure) outweigh the direct emissions from composting (table 1). The net lifecycle emissions from composting manure and green waste and applying the compost to grasslands are negative (−690 g CO2-e kg−1 excluding biogenic CO2; between −590 and −670 g CO2-e kg−1 including the directly measured biogenic CO2 fluxes)4 , meaning that emissions are avoided on net. If all of California's dairy manure that is currently managed via anaerobic lagoon (7.4 MMT yr−1) [69] were instead composted, approximately 5MMT CO2-e yr−1 would be avoided; this is equivalent to 15% of California's agricultural greenhouse gas emissions.
Table 1. Net lifecycle greenhouse gas emissions from composting green waste and manure, g CO2-e kg−1 feedstock (wet). Net emissions are a sum of direct emissions, C sequestered, and a weighted sum of avoided emissions from anaerobic lagoons (for manure, 91% of mass) and landfills (for green waste, 9% of mass).
| Emission source | Value |
|---|---|
| Total direct emissions (no biogenic CO2) | +5.6 E + 01 |
| Avoided, anaerobic lagoon (manure) | −8.1 E + 02 |
| Avoided, landfill (green waste) | −3.3 E + 01 |
| Carbon sequestered from land application | −2.8 E − 01 |
| Net emissions | −6.9 E + 02 |
The biggest greenhouse gas benefit from composting is the elimination of anaerobic storage. Emissions avoided from anaerobic storage were greater than the direct emissions from composting. Though annual C sequestration from compost application is smaller in magnitude than direct and avoided emissions, its effects are potentially long-lasting. Avoided and direct emissions are a one-time phenomenon, while increased C sequestration from a single compost application can persist for several years [70]. Thus, while we modeled net C implications over one year (table 1), a longer time frame would increase the relative benefits of compost application.
Our results highlight the potential to effectively measure and minimize greenhouse gas emissions from commercial-scale composting. Managing composting piles to minimize methanogenesis—by maintaining sufficient O2 concentrations through aeration and bulking, and focusing on the first three weeks of decomposition when temperatures and decomposition rates are high—could potentially reduce direct greenhouse gas emissions. Low emissions from composting contribute to the climate change mitigation benefit of diverting high-emitting waste streams to compost and land applying for C sequestration.
Acknowledgments
In addition to the funding sources, the authors would also like to especially thank John Wick, Tyler Anthony, Heather Dang, Summer Ahmed, and Joseph Verfaillie for their support of this work, as well as Picarro Instruments, Gill Instruments, and NovaLynx Corporation. We would also like to thank the three anonymous reviewers for their thoughtful and valuable feedback.
Data availability statement
The data that support the findings of this study are available from the corresponding author upon reasonable request.
Author contributions
The manuscript was written through contributions of both authors. Both authors have given approval to the final version of the manuscript.
Funding sources
This work was supported by funding from California's 4th Climate Change Assessment, through the Berkeley Energy and Climate Initiative, and the Rathmann Family Foundation. Additional support was provided to WLS from the 11th Hour Foundation.
Footnotes
- 2
3.9 ± 0.74 g CH4 kg−1 dry.
- 3
44 ± 8.6 g CO2 kg−1 dry.
- 4
−1.6 kg CO2-e kg−1 dry (−1.4 to −1.5 CO2-e kg−1 dry including biogenic CO2).