

Abstract
The agro-food system satisfying human food demand releases heavy nitrogen (N) loads into the environment. The N footprint is an indicator of N loads from individual consumption of food as well as energy. A bottom-up approach called the 'N-calculator method' calculates the food N footprint using the N content in consumed foods, such that the N footprint of protein-free foods is treated as zero. This method underestimates the N footprint of protein-free foods, such as oil and sugar, when the source crops require N input in production. In this study, we propose a substitution factor, the virtual nitrogen factor for protein-free foods (VNFree), defined as the potential N load per unit weight of consumed food, to explicitly calculate the production N footprint. Oil palm and its products, palm oil (PO) and palm kernel oil (PKO), were chosen for this case study of protein-free foods. Global mean VNFree values of PO and PKO obtained by averaging national-scale data of the three countries with the largest production (Indonesia, Malaysia, and Thailand) were 0.0241 and 0.0037 kg N kg–1 oil, respectively. The 6.5-times difference in VNFree values was attributed to the difference in oil yield. The food N footprint of PO and PKO calculated here represented less than 2% of the previously reported total food N footprints of several countries. However, oil palm products are also used for industry, and the chemical fertilizer consumption for oil palm accounted for only 8%–12% of that of all oil and sugar crops. The protein-free N footprint of all these products will be much larger. We expect that the current N-calculator method as a bottom-up approach will be improved by expanding the VNFree concept, which enables the calculation of the concealed N footprint in protein-free products, including all uses of oil and sugar crops.
Export citation and abstract BibTeX RIS

Original content from this work may be used under the terms of the Creative Commons Attribution 3.0 licence. Any further distribution of this work must maintain attribution to the author(s) and the title of the work, journal citation and DOI.
1. Introduction
The current agro-food system requires chemical nitrogen (N) fertilizer to satisfy human food demand (Erisman et al 2008, Bouwman et al 2017). Artificial N fixation using the Haber–Bosch process has contributed to the creation of massive amounts of reactive N (i.e. N chemical species other than inert dinitrogen, N2), most of which is used as chemical fertilizer (Bouwman et al 2017, Erisman et al 2018). Haber–Bosch ammonia creation, which was 142 Tg N yr–1 in 2017 (USGS 2019), is now more than double the estimated terrestrial biological N fixation (BNF) of 60 Tg N yr–1 (Fowler et al 2013). The agro-food system causes a vast amount of reactive N to be released into the environment due to its low full-chain N use efficiency (NUE). Studies suggest that NUEs were approximately 47% in the world crop production over the last three decades (Lassaletta et al 2014) and 5%–20% in animal production in 2000 (Bouwman et al 2013, Leip et al 2014). There is serious concern that the increases in anthropogenic N loads to the environment have been perturbing the Earth's N cycle beyond the planetary boundary and inducing a variety of negative environmental impacts, such as climate change and eutrophication (Sutton et al 2011, Steffen et al 2015).
The agro-food system's NUE is affected by both food production and food consumption. With regard to food consumption, both food choice and unnecessary protein supply affect the agro-food NUE; the latter corresponds to food loss and protein overconsumption by consumers (Hayashi et al 2018). Consumer behaviors such as preferring livestock meat with a relatively low NUE (Smil 2002), increasing food waste/loss, and consuming more food protein than necessary to meet the nutritional demand all lower the NUE. Although food choices arise from individual decisions, they are affected by personal beliefs and actions, one's life course, and many societal factors, including subsidies and oversupply for specific commodities and public awareness (Furst et al 1996, Evans 2011, 2012).
A comprehensible effect indicator of individual food consumption on NUE is useful for investigating N loads, devising options for reducing the N loads, and evaluating the effectiveness of those options. One such indicator is the N footprint, which represents individual or institutional N loads to the environment based on consumption of food and energy (housing, transport, goods, and services) (Leach et al 2012). The N-calculator method is a bottom-up approach for calculating the N footprint that has the advantage of reflecting individual differences in consumption directly in the calculation (e.g. Leach et al 2012, Shibata et al 2014, Hayashi et al 2018, Oita et al 2018). The N-calculator method expresses the food N footprint as the sum of the N footprint of food production and that of food consumption; the former is derived by multiplying the consumed (ingested) food N by a virtual nitrogen factor (VNF) converting the consumed N to the amount of N released into the environment during production until just before consumption (Leach et al 2012).
A major problem with the current N-calculator method is that it cannot calculate the N footprint of protein-free foods such as oil and sugar because the VNFs of these foods become infinity by definition (e.g. Leach et al 2012); VNF has a dimension of kg N kg–1 N. However, the production of oil and sugar also inevitably induces environmental N loads because their source crops such as oil palm, soybean, and sugarcane also require N to grow. In recent years, chemical N fertilizer consumption for oil and sugar crops accounted for 10%–11% of the total consumption globally (Heffer 2013, Heffer et al 2017). Therefore, the current N-calculator method is likely to underestimate the total food N footprint because it omits N loads of protein-free foods.
The purpose of this study was to improve the current N-calculator method by proposing a substitution factor of VNF that enables the N footprint of protein-free foods to be calculated. In the present study, we focus on oil palm, which was the world's largest source of vegetable oil among oil crops from 2010 to 2014 (FAO 2019). Chemical N fertilizer consumption for oil palm accounted for 8%–12% of that used for oil and sugar crops (Heffer 2013, Heffer et al 2017). The main products of oil palm are palm oil (PO, oil from pulp) and palm kernel oil (PKO, oil from kernel); both are protein-free foods (USDA 2018). These products serve as food such as cooking oil and ingredients in various processed foods but are also used in materials like detergent and as biodiesel (WWF 2016). Although the present study focused on the food aspect of oil palm products, information on their industrial use is also provided in the supplementary information, which is available online at stacks.iop.org/ERL/15/035006/mmedia.
2. Materials and methods
2.1. Calculation of the N footprint
In many cases, the N footprint is calculated on a national scale (e.g. Leach et al 2012, Shibata et al 2014, Hayashi et al 2018, Oita et al 2018). The N-calculator method expresses the food N footprint of item i as:


where NF is the food N footprint of item i (kg N capita–1 yr–1), NFprod is the food-production N footprint of item i (kg N capita–1 yr–1), and NFcons is the food-consumption N footprint of item i (kg N capita–1 yr–1). VNF is VNF of item i (kg N kg–1 N), which is defined as the amount of N released into the environment per unit N consumption of item i from its production until just before consumption (Leach et al 2012) (figure 1). VNF incorporates the effects of international trade, that is, N loads within a target country and those in food-exporting countries (e.g. Leach et al 2012, Shibata et al 2014). ConsN is the N consumed in item i (kg N capita–1 yr–1), and Rdenit is the average conversion ratio of reactive N to N2 by complete denitrification during sewage treatment (kg N kg–1 N). N emission as N2 is excluded from N loads because of the inert nature of N2. For example, Rdenit in Japan is estimated to be 32% (Oda and Matsumoto 2006).
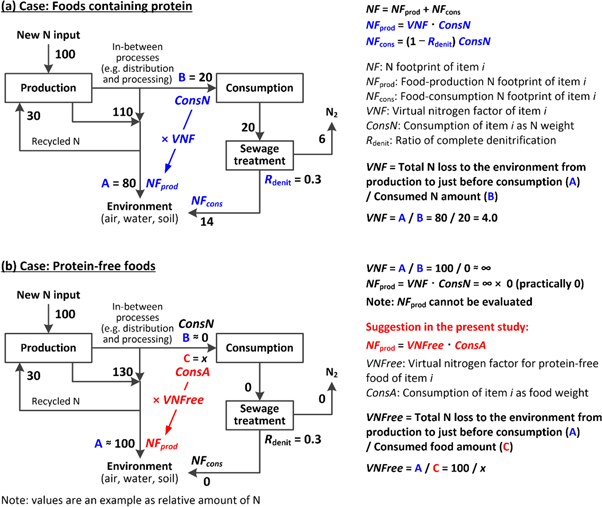
Figure 1. Schematic example of the nitrogen (N) footprint concept: (a) foods containing protein to which the current N-calculator method can be applied, (b) protein-free foods for which the current N-calculator method cannot calculate the production N footprint, with a methodological recommendation from the present study.
Download figure:
Standard image High-resolution imageFor protein-free foods such as oil and sugar, their VNF values become infinity by definition (figure 1), and the NFprod is therefore expressed as ∞ × 0 and, for practical purposes, is treated as zero. Note that NFcons of protein-free foods can be treated as zero because of its nonexistent N content.
The present study introduces a substitution factor for VNF, the VNF for protein-free foods (VNFree), to calculate NFprod of protein-free foods. Oil palm products are used as an example. VNFree is defined as the environmental N load from production until just before consumption per unit weight of consumed food (kg N kg–1 food). NFprod using VNFree is expressed as:

where VNFree is the VNFree of item i (kg N kg–1 food) and ConsA is the consumed amount of item i (kg food capita–1 yr–1).
We aimed to obtain the global mean VNFree values of PO and PKO because most oil palm production is concentrated in three tropical countries (Indonesia, Malaysia, and Thailand) and oil palm products are available worldwide via international trade (Dittrich et al 2012). Ideally, estimation of environmental N loads accompanying oil palm production should be validated with field data. However, the collection of such field data is still limited (e.g. Pardon et al 2016a, 2016b, 2017). Furthermore, a discrepancy between respective field data and world mean values is a source of uncertainty. Thus, estimating global VNFree values of PO and PKO using national-scale data is consistent with the aim of the present study.
According to the nitrogen mass balance, the total environmental N loads associated with oil palm products are approximated by the new N input to their production while assuming a steady-state, that is, no stock change in N pools (e.g. soil and biomass) relevant to the production. The new N input is calculated by subtracting recycled N (e.g. N in manure and crop residues as organic fertilizer) from the total input. Enhancing N recycling can reduce chemical fertilizer demand and thus reduce the new N input. In the present study, chemical fertilizer, BNF, and atmospheric deposition were considered as components of the new N input. The VNFree of oil palm products as the sum of PO and PKO (VNFreeoilpalm, kg N kg–1 oil) is expressed as:


where Nnew is the new N input to oil palm plantations (kg N ha–1 yr–1), Yoilpalm is the oil yield as the sum of PO and PKO (kg oil ha–1 yr–1), Nfert is the chemical fertilizer application rate (kg N ha–1 yr–1), NBNF is the BNF rate (kg N ha–1 yr–1), Ndep is the atmospheric deposition rate (kg N ha–1 yr–1), YPO and YPKO are the yield of PO and PKO (kg oil ha–1 yr–1), respectively. Factors such as unit price or production amount can be used as a weight to allocate VNFreeoilpalm to PO and PKO. In the present study, a production value (=oil yield × unit oil price) was chosen as the weight because we consider that the total N loss to the environment from each product should be proportional to its economic value. Using the production value as the weight, VNFree values of PO and PKO are obtained as follows:
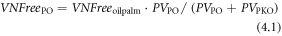


where VNFreePO and VNFreePKO are the VNFree of PO and PKO, respectively (kg N kg–1 oil); PVPO and PVPKO are the production value of PO and PKO, respectively (e.g. USD ha–1 yr–1); and PPO and PPKO are the unit price of PO and PKO, respectively (e.g. USD kg–1 oil).
2.2. Oil palm data
Oil palm is an arboreal crop suitable for the tropics and subtropics. African oil palm (Elaeis guineensis), native to West Africa, is used for large plantations in Southeast Asia (FAO 2002). Oil palm fruits can be harvested year-round for several decades, although the yield is subject to factors such as plantation life cycle, tree growth, solar radiation, temperature, water regime, nutrient availability, and farm management (Pardon et al 2016a, Woittiez et al 2017). Malaysia and Indonesia accounted for 70% of the world's harvested area and 82% of the fruit production of oil palm in 2014; the fruit production accounted for 86% when including Thailand as the third-largest producer (FAO 2019). Thus, we expect that mean data obtained from these three countries approximate a representative global value.
Table 1 shows the primary data used to calculate each term in equations (3) and (4), and table 2 lists the calculated terms in equations (3) and (4) using the primary data. Nfert was obtained as the mean application rate in 2010 or 2014 by dividing the total chemical fertilizer consumption for oil palm (Heffer 2013, Heffer et al 2017) by the total harvested area of oil palm in the three countries in the same year from two data sources (FAO 2019, USDA 2019). Two conditions of NBNF were set: either a plantation introduced leguminous cover on the forest floor to enhance BNF or it did not. NBNF of an oil palm planation using cover legumes was estimated to be 25.6 kg N ha–1 yr–1 by dividing the total BNF of leguminous cover for the first 6 years from initiation of the plantation, 640 kg N ha–1, by the mean plantation life span, 25 years (Pardon et al 2016a). NBNF of a plantation without leguminous cover was set as the value of non-leguminous crops, 4 kg N ha–1 yr–1 (Shindo and Yanagawa 2017). The mean atmospheric deposition rate (wet and dry) in each country in 2009 was obtained from an international atmospheric transportation model intercomparison study (Lamarque et al 2013). Note that 2009 was the latest year in the historical dataset. Ndep in 2010 or 2014 was estimated as the weighted-mean value using the area of oil palm harvested in each country in 2010 or 2014 (FAO 2019, USDA 2019). National production of PO and PKO in each country in 2010 and 2014 were obtained from two data sources (FAO 2019, USDA 2019). The oil yields, YPO and YPKO, were obtained using economic data by dividing the total production by the total area harvested for the three countries (FAO 2019, USDA 2019). The same data source was used in the calculation (i.e. FAO production was divided by FAO area harvested, and vice versa for the USDA data). Annual mean prices of PO and PKO in 2010 and 2014 were obtained from the price variation charts of crude oil as the cost insurance and freight (CIF)–Rotterdam (Palm Oil Analytics 2019).
Table 1. Primary data used to calculate VNFree (virtual nitrogen factor for protein-free foods) of oil palm products.
| Value | ||||||||
|---|---|---|---|---|---|---|---|---|
| Item | Unit | Year | Indonesia | Malaysia | Thailand | Total | Mean | Referencesc |
| Chemical fertilizer used for oil palm | Gg N yr–1 | 2010 | 548 | 374 | 41 | 963 | — | 1 |
| 2014 | 745 | 470 | 35 | 1 250 | 2 | |||
| Biological fixation: | kg N ha–1 yr–1 | |||||||
| With cover legumes | — | — | — | — | — | 25.6a | 3 | |
| Without legumes | — | — | — | — | — | 4 | 4 | |
| Atmospheric deposition | kg N ha–1 yr–1 | 2009 | 16.71 | 6.84 | 7.68 | — | — | 5 |
| Area harvested | 1000 ha | 2010 | 5780 | 4858 | 542 | 11 175 | — | 6 |
| 2010 | 7256 | 4202 | 600 | 12 058 | — | 7 | ||
| 2014 | 8150 | 4689 | 644 | 13 483 | — | 6 | ||
| 2014 | 9523 | 4689 | 710 | 14 922 | — | 7 | ||
| Production: | Gg oil yr–1 | |||||||
| 2010 | 21 958 | 16 994 | 1288 | 40 239 | — | 6 | ||
| Palm oil | 2010 | 23 600 | 18 211 | 1832 | 43 643 | — | 7 | |
| 2014 | 29 278 | 19 667 | 1854 | 50 799 | — | 6 | ||
| 2014 | 33 000 | 19 879 | 2068 | 54 947 | — | 7 | ||
| 2010 | 2363 | 2015 | 126 | 4504 | — | 6 | ||
| Palm kernel oil | 2010 | 2680 | 2072 | 245 | 4997 | — | 7 | |
| 2014 | 3329 | 2277 | 169 | 5775 | — | 6 | ||
| 2014 | 3780 | 2280 | 280 | 6340 | — | 7 | ||
| Unit oil priceb: | USD kg–1 oil | |||||||
| Palm oil | 2010 | — | — | — | — | 0.908 | 8 | |
| 2014 | — | — | — | — | 0.824 | 8 | ||
| Palm kernel oil | 2010 | — | — | — | — | 1.193 | 8 | |
| 2014 | — | — | — | 1.120 | 8 | |||
aCalculated by setting conditions of biological nitrogen fixation rate for cover legumes (see the text for details). bCrude oil price as CIF-Rotterdam (CIF, cost insurance and freight). cReferences: 1, Heffer (2013); 2, Heffer et al (2017); 3, Pardon et al (2016a); 4, Shindo and Yanagawa (2017); 5, Lamarque et al (2013); 6, FAO (2019); 7, USDA (2019); 8, Palm Oil Analytics (2019).
Table 2. Derived terms in equations (3) and (4) used to calculate VNFree (virtual nitrogen factor for protein-free foods) of oil palm products.
| Value | ||||||
|---|---|---|---|---|---|---|
| Item | Unit | Year | Mean | Palm oil (PO) | Palm kernel oil (PKO) | Referencese |
| Chemical fertilizer input (Nfert) = fertilizer use/area harvested | kg N ha–1 yr–1 | 2010 | 86.2 | — | — | 1, 6 |
| 2010 | 71.4 | — | — | 1, 7 | ||
| 2014 | 103.7 | — | — | 2, 6 | ||
| 2014 | 83.8 | — | — | 2, 7 | ||
| Biological fixation (NBNF): | kg N ha–1 yr–1 | |||||
| With cover legume | 2010, 2014a | 25.6b | — | — | 3 | |
| Without legumes | 2010, 2014a | 4 | — | — | 4 | |
| Atmospheric deposition (Ndep) = weighed mean using area harvested | kg N ha–1 yr–1 | 2010c | 12.0 | — | — | 5, 6 |
| 2010c | 12.8 | — | — | 5, 7 | ||
| 2014c | 12.8 | — | — | 5, 6 | ||
| 2014c | 13.2 | — | — | 5, 7 | ||
| Oil yield (YPO, YPKO) = production/area harvestedd | kg oil ha–1 yr–1 | 2010 | — | 3601 | 403 | 6 |
| 2010 | — | 3619 | 414 | 7 | ||
| 2014 | — | 3768 | 428 | 6 | ||
| 2014 | — | 3682 | 425 | 7 | ||
| Oil production value (PVPO, PVPKO) = oil yield × unit oil price | USD ha–1 yr–1 | 2010 | — | 3270 | 481 | 6, 8 |
| 2010 | — | 3286 | 494 | 7, 8 | ||
| 2014 | — | 3105 | 478 | 6, 8 | ||
| 2014 | — | 3034 | 476 | 7, 8 | ||
| Weight derived from oil production value (PVPO/[PVPO + PVPKO], PVPKO/[PVPO + PVPKO]) | — | 2010 | — | 0.872 | 0.128 | 6, 8 |
| 2010 | — | 0.869 | 0.131 | 7, 8 | ||
| 2014 | — | 0.866 | 0.134 | 6, 8 | ||
| 2014 | — | 0.864 | 0.136 | 7, 8 | ||
aSame value was applied to both 2010 and 2014. bCalculated by setting conditions of biological nitrogen fixation rate with cover legumes (see the text for details). cDeposition data was as of 2009. dA single data source was used for each FAO or USDA. eReferences: 1, Heffer (2013); 2, Heffer et al (2017); 3, Pardon et al (2016a); 4, Shindo and Yanagawa (2017); 5, Lamarque et al (2013); 6, FAO (2019); 7, USDA (2019); 8, Palm Oil Analytics (2019).
VNFree was calculated using the results of each term (table 2), for which the following 64 combinations were used: 2 years × 8 results of Nnew × 2 results of Yoilpalm × 2 results of the weight. As the representative value from 2010 to 2014, global mean VNFreePO and VNFreePKO values were derived by averaging the 64 combinations of VNFree values.
Five-year means of domestic production of PO and PKO and domestic consumption of PO and PKO for food, industry, and feed in each country in the world from 2010 to 2014 were calculated using statistics of the USDA (2019) which treat trade (import and export) separately. Five-year mean per capita consumption of PO and PKO for food, industry, and feed was also obtained by dividing the domestic consumption by the national population (UN 2017). These data are presented in the supplementary information.
3. Results and discussion
3.1. Oil palm VNFree values
As a global mean, VNFreePO was estimated to be 0.0241 ± 0.0032 kg N kg–1 oil (±SD, n = 64; range, 0.0188–0.0300 kg N kg–1 oil), and VNFreePKO was estimated to be 0.0037 ± 0.0005 kg N kg–1 oil (range, 0.0028–0.0047 kg N kg–1 oil). VNFreePO was 6.5 times larger than VNFreePKO because of the large difference in their yields: 3600–3800 kg oil ha–1 for PO versus 400–430 kg oil ha–1 for PKO (table 2). The price of PKO was 1.3–1.4 times higher than that of PO (table 1). The term that mostly contributed to Nnew was Nfert, accounting for 76% on average (65%–86%; table 2). VNFree decreases as oil yield increases (equation (3.1)), suggesting that the VNFree values of other oil crops are larger than those of oil palm for several reasons. First, oil palm has the highest oil yield per unit area among oil crops, with yields 5.5–6.2, 7.7–8.8, and 9.7–10.2 times those of rapeseed, sunflower, and soybean, respectively (Basiron 2007, Thomas et al 2015). Second, the oil yield per unit N input, which is calculated by dividing the world oil production (FAO 2019) by the world chemical N fertilizer consumption (Heffer 2013, Heffer et al 2017), for oil palm, soybean, and other oil crops was 49.1, 39.9, and 11.0 kg oil kg–1 N, respectively; here, oil palm also had a yield 1.2 and 4.5 times those of soybean and other oil crops.
Nfert, NBNF, Ndep, YPO, and YPKO calculated using the national-scale data were compared with other available information. Nfert ranged from 71 to 104 kg N ha–1 yr–1 (table 2) and was within the range of values reported previously (0–212 ha–1 yr–1; Pardon et al 2017) and comparable with actual or recommended fertilizer application rates (e.g. Goh and Po 2005, Comte et al 2012). For NBNF, the mean value between the NBNF with cover legume to enhance BNF (25.6 kg N ha–1 yr–1) and that without such enhancement (4 kg N ha–1 yr–1; table 2) was reflected in the mean VNFree. The collection of BNF data in oil palm plantations is needed because of the lack of field measurements. The annual mean wet deposition monitored at five sites in Indonesia, four sites in Malaysia, and six sites in Thailand in 2010 and 2014 was 8.0 kg N ha–1 yr–1 (EANET 2012, 2015). That value seems reasonable as compared with the Ndep as the sum of wet and dry deposition based on the dataset of an atmospheric model intercomparison study, which ranged from 12.0 to 13.2 kg N ha–1 yr–1 (table 2). Although the potential oil yield of oil palm is expected to be 9000–10 000 kg oil ha−1 yr−1, average productivity worldwide has stagnated at around 3000 kg oil ha−1 yr−1 (Woittiez et al 2017). An average oil yield of oil palm of 3680 kg oil ha−1 yr−1 was also reported (Basiron 2007). The mean oil yield (PO + PKO) in the three Southeast Asian countries, 4000–4200 kg oil ha−1 yr−1 (table 2), was higher than these world averages but still lower than the potential yield. In addition, the oil yields in the three countries were in the order Malaysia > Indonesia > Thailand, with values of 4500, 3900, and 3100 kg ha−1 yr−1, respectively.
3.2. Food nitrogen footprint of oil palm products
Figure 2 shows the top 20 countries of the food N footprint for oil palm products. Relevant data including oil palm products for industrial use are provided in the supplementary information. PO was the dominant component of the food N footprint; VNFreePO was 6.5 times that of VNFreePKO and PO showed higher food consumption than PKO (supplementary information). Indonesia, Malaysia, and Thailand, the three countries with the greatest oil palm production, were ranked within the top ten. African and Latin American countries were also included in the top 20.

Figure 2. Top 20 countries with regard to food nitrogen footprint of oil palm products.
Download figure:
Standard image High-resolution image
The food N footprint of oil palm products calculated in the present study was compared with previously reported N footprints of several countries and the world average (Gu et al 2013, Galloway et al 2014, Pierer et al 2014, Shibata et al 2014, Stevens et al 2014, Liang et al 2016, Oita et al 2016, 2018, Hutton et al 2017, Shindo and Yanagawa 2017, Hayashi et al 2018) (table 3). The food N footprint of oil palm products in these countries ranged from 0.07 to 0.18 kg N capita–1 yr–1, whereas their food N footprint ranged from 8.9 to 32 kg N capita–1 yr–1. Therefore, the food N footprint of oil palm products represented less than 2% of the food N footprint for these countries. Note that the reported N footprints using a bottom-up approach do not include the N footprint of protein-free products like oil palm products. Shindo and Yanagawa (2017), using a top-down approach based on the national and international statistics, estimated that the Japanese food N footprint attributed to oil crops was 0.5 kg N capita–1 yr–1. The Japanese food N footprint of oil palm products estimated in the present study corresponded to 20% of that, 0.1 kg N capita–1 yr–1 (table 3). On average, oil palm products accounted for 18% of vegetable oil consumption in Japan from 2010 to 2014 (USDA 2019). Thus, the percentages agree well, although it should be noted that the VNFree values of other oil crops might be different from those of oil palm products. The comparison of N footprint including other uses of oil palm is shown in the supplementary information.
Table 3. Comparison of nitrogen footprint of food, energy, and goods reported in the literature with the food nitrogen footprint of oil palm products estimated in the present study.
| Country | Previously reported nitrogen footprint (NF) (kg N capita–1 yr–1) | NF of oil palm products from this study (kg N capita–1 yr–1) | Ratio of oil palm products in food NF (%) | ||||||
|---|---|---|---|---|---|---|---|---|---|
| Food | Bub: B/(A + B),Tdc: B/A | ||||||||
| Food (A) | Energya | Goods | Total | Referencesf | PO | PKO | Total (B) | ||
| Australia | 32 | 11 | 4 | 47 | 1 (Bu) | 0.12 | 0 | 0.12 | 0.4 |
| — | — | — | 91 | 2 (TD) | |||||
| China | 22 | 4.6 | 5.1 | 32 | 3 (Td) | 0.07 | 0 | 0.07 | 0.3 |
| — | — | — | 28 | 2 (Td) | |||||
| EUd: | — | — | — | — | — | 0.17 | 0.003 | 0.18 | |
| Austria | 17.1 | 2.4 | 0.6 | 20 | 4 (Bu) | ||||
| — | — | — | 50 | 2 (Td) | 1.0 | ||||
| Germany | 19.6 | 3.4 | 0.7 | 24 | 5 (Bu) | ||||
| — | — | — | 44 | 2 (Td) | 0.9 | ||||
| Netherlands | 21.1 | 1.9 | 0.5 | 24 | 6 (Bu) | ||||
| — | — | — | 49 | 2 (Td) | 0.8 | ||||
| Portugal | 24 | 4.2 | 0.5 | 29 | 6 (Bu) | ||||
| — | — | — | 49 | 2 (Td) | 0.7 | ||||
| UK | 22.9 | 3.1 | 1.1 | 27 | 5 (Bu) | ||||
| — | — | — | 56 | 2 (Td) | 0.8 | ||||
| Japan | 25.6 | 1.5 | 1.0 | 28 | 7 (Bu) | 0.10 | 0.001 | 0.11 | 0.4 |
| 15.2 | — | — | — | 8 (Bu) | 0.7 | ||||
| 18.3 | — | — | — | 9 (Bu) | 0.6 | ||||
| 18.1 | — | — | — | 10 (Td) | 0.6 | ||||
| — | — | — | 40 | 2 (Td) | |||||
| Tanzania | 8.8 | 1.0 | 0.2 | 10 | 11 (Bu) | 0.17 | 0 | 0.17 | 1.9 |
| USA | 27 | 9.0 | 2.5 | 39 | 6 (Bu) | 0.07 | 0.001 | 0.07 | 0.3 |
| — | — | — | 62 | 2 (Td) | |||||
| Worlde | — | — | — | 27 | 2 (Td) | — | — | — | — |
aSum of housing and transport in the literature. bBu, bottom-up estimation not including nitrogen footprint of protein-free foods. cTd, top-down estimation based on the total nitrogen loads; dEuropean Union as of 2018. eWorld total/world population. fReferences: 1, Liang et al (2016); 2 Oita et al (2016); 3, Gu et al (2013); 4, Pierer et al (2014); 5, Stevens et al (2014); 6, Galloway et al (2014); 7, Shibata et al (2014); 8, Oita et al (2018); 9, Hayashi et al (2018); 10, Shindo and Yanagawa (2017); 11, Hutton et al (2017). PO, palm oil; PKO, palm kernel oil.
3.3. Conceptual discussion and future challenges
The nitrogen investment factor (NIF) (Leip et al 2014) is a similar factor as VNFree used in the present study. The NIF of a product is calculated by dividing the new N input to production by the product N content. However, the NIF of protein-free products is calculated by substituting the raw crop N content for the product N content, which corresponds to the NUE of the new input N to the harvested crop. When applying the NIF concept to a protein-free product in the N-calculator method, conversion of the final product consumption to raw crop consumption is necessary. The VNFree concept suggested in the present study is advantageous for calculating the N footprint of protein-free products directly if these consumption data are available.
The VNFree concept is applicable to several main products used for food and other uses and can be extended to byproducts and recycled materials by consistently using their values (e.g. monetary value in the present study) as the weight to allocate the total N footprint to each product or material. When recycling is costly, that recycled material can have a negative value. However, caution is needed when the main product(s) do not contain N but byproduct(s) and/or recycled material(s) do, as is typical of oil and sugar crops. The current N-calculator method allocates the production N footprint only to products containing N; this implies that protein-free main products do not contribute to N loads to the environment, whereas byproducts and recycled materials containing N are a source of the N loads. Thus, an objective and reasonable rule about how to allocate the N footprint to each main product, by-product, and recycled material is needed. Using available data, the present study employed a monetary value to allocate the total environmental N load for each product. Relative values among products and/or recycled materials vary with domestic and international supply and demand. As a next step, connecting a model of dynamic changes in value to the N footprint calculation would be an effective means of improving the VNFree concept.
Oil palm has the highest oil yield among oil crops both in per unit area and per N input. However, suitable production areas of oil palm are limited to pantropical regions (Pirker et al 2016). Changing pristine and secondary forests into oil palm plantations deteriorates biodiversity and ecosystem functions in these regions (e.g. Fitzherbert et al 2008, Dislich et al 2017). The expansion of oil palm plantations has progressed rapidly since the 1980s in Malaysia and the 1990s in Indonesia (Koh et al 2011, Sayer et al 2012). Ecological impacts are also a concern in Latin America and Africa, where oil palm production continues to expand (e.g. Furumo and Aide 2017, Strona et al 2018). Although the high yield of oil palm appears to be positive from the viewpoint of the N footprint, methodological development is necessary to better assess the benefits and costs of oil palm production and consumption by linking the N footprint concept with other indicators, such as biodiversity, ecological, carbon, and water footprints (Wackernagel and Rees 1998, Hoekstra and Chapagain 2007, Hertwich and Peters 2009, Hillier et al 2009, Hoekstra and Mekonnen 2012, Lenzen et al 2012, van Noordwijk and Brussaard 2014, Nishijima et al 2016). The present study provides a methodological basis to incorporate N loads to the environment towards sustainable oil crop production and consumption.
4. Conclusions
Calculation of the N footprint of protein-free products by a bottom-up approach is a tricky problem. N input is needed to produce raw materials, but their final products as a protein-free part do not contain N. The current N-calculator method estimates the food N footprint using the N content in consumed food. Although this is a logical perspective, it underestimates the N footprint of protein-free foods. To solve this problem, the present study introduced VNFree, the potential N load per unit weight of consumed food. Our methodological recommendation is that VNF of the current N-calculator is used as usual for foods containing protein N, and the VNFree concept suggested in the present study is used for protein-free foods. Using monetary values of products for allocation, the VNFree values of two oil palm products, PO and PKO, were estimated to be 0.0241 and 0.0037 kg N kg–1 oil, respectively. The 6.5 times larger VNFree of PO was ascribed to its higher yield relative to that of PO. The food N footprint of PO and PKO calculated here represented less than 2% of the previously reported food N footprints of several countries. Oil palm products are also widely used for industry, however, and the chemical N fertilizer consumption for oil palm accounted for only 8%–12% of that for oil and sugar crops. The total protein-free N footprint will be much larger, because other uses of oil palm products and products of other oil and sugar crops contribute to the total N footprint. Thus, calculation of the concealed N footprint in protein free-products using the VNFree concept will improve the N footprint estimation by a bottom-up approach. There are two next steps for future N footprint study. One is to expand the VNFree concept to protein-free products other than food use of oil palm. The other is to compare VNFree and VNF for products with protein to validate the VNFree concept.
Acknowledgments
We deeply appreciate Mr Mohd Zulhilmy Abdullah, Sarawak Tropical Peat Research Institute, Malaysia for providing information about N fertilizer management in oil palm plantations. This study was partly supported by Grants-in-Aid for Scientific Research (JP17H00794 and JP19K20496) provided by the Japan Society for the Promotion of Science.
Data availability statements
The data that support the findings of this study are available from the corresponding author upon reasonable request.