


Abstract
Nitrogen (N) footprints are one method to quantify consumer driven reactive nitrogen (Nr) emissions. Canada is a highly urbanized yet economically natural resource-dependent country, providing an illustrative case study to examine attribution of Nr emissions to per capita consumption, either domestically or abroad. Yet, considered only at the national scale, N footprints may obscure absolute and relative contributions of local drivers to Nr emissions. We apply a top-down N footprint approach drawing from national N budgets, emissions inventories, and agricultural statistics to estimate sub-national (provincial) drivers of Nr emissions across Canada. We calculate per capita provincial Nr footprints from four primary sectors in 2018: (a) crop production, (b) animal production, (c) wastewater treatment, and (d) fossil fuel burning. We estimate that Canada's total N footprint is 995.7 Gg Nr yr−1, which equates to an average per capita footprint nationally of 27.1 kg Nr capita−1 yr−1. The largest national contributions come from a few key (sub)sectors, including transport, beef consumption, and wastewater treatment. Provincial per capita N footprints vary widely, with the largest (Saskatchewan 50.3 kg Nr cap−1 yr−1) more than double the smallest (Ontario 22.0 kg Nr cap−1 yr−1). Most variation across provinces is due to the fossil fuels sector, including emissions from energy generation and the oil and gas industry. We therefore compare our top-down approach for the fossil fuels sector with bottom-up N footprints and territorial emissions methodologies. Per capita N emissions vary considerably across these approaches. For example, Alberta's per-capita fossil fuel Nr emissions are 45.9, 23.0, and 6.3 kg Nr cap−1 yr−1 using territorial, top-down and bottom-up footprint approaches, respectively. This analysis demonstrates the challenges of attributing Nr emission for export-oriented economies. Our study provides novel insights on sub-national drivers of Nr emissions, emphasizing the need to consider how heterogeneous geographic contexts contribute to national N footprints.
Export citation and abstract BibTeX RIS

Original content from this work may be used under the terms of the Creative Commons Attribution 4.0 license. Any further distribution of this work must maintain attribution to the author(s) and the title of the work, journal citation and DOI.
1. Introduction
Increasing the availability of reactive nitrogen (Nr, any form of nitrogen other than inert N2) has been essential in growing enough food for the global population (Smil 1991). However, excess Nr results in negative environmental impacts such as eutrophication, smog, and greenhouse gas emissions. Anthropogenic sources of Nr now outweigh natural flows, with major inputs coming from synthetic fertilizers, increased biological nitrogen fixation (BNF), and fossil fuel combustion (Erisman et al 2008, Fowler et al 2013). In Canada there has been a steady increase in NH3 emissions driven by fertilizer use and animal production (Environment and Climate Change Canada 2021a), agriculture accounts for 78% of national N2O emissions (Environment and Climate Change Canada 2021b), and elevated nitrogen concentrations remain a key water quality issue (Environment and Climate Change Canada 2012). While NOx emissions are trending downward in Canada, further reductions are needed to reach goals set in the Gothenburg Protocol for transboundary air pollution (Environment and Climate Change Canada 2021a). Accounting tools that enable better quantification of Nr flows and inventories can inform policy and track the progress of mitigation efforts in order to balance future increases in Nr demands while mitigating negative Nr effects on society (Houlton et al 2019, Galloway and Cowling 2021).
Nitrogen (N) footprints are one method to quantify and communicate about Nr emissions. N footprints are a consumption-oriented approach that determines an entity's contribution to Nr release due to activities within a defined boundary such as a country (Leach et al 2012), city (Dukes et al 2020), or institution (MacDonald et al 2020). Leach et al (2012) developed the first national-scale N footprint model for the United States, the N-calculator, in 2012, and recently updated their N footprint of food production (Leach et al (submitted). A number of national N footprints have been calculated for other countries using adapted versions of this model, including the UK, Australia, Austria, Egypt, Tanzania and Japan (Pierer et al 2014, Shibata et al 2014, Stevens et al 2014, Liang et al 2016, Hutton et al 2017, Elrys et al 2019). Other top-down models have been used to calculate national N footprints for China, the European Union, and Japan (Gu et al 2013, Leip et al 2014, Shindo and Yanagawa 2017), and the N footprint of global trade has also been estimated by using multi-region input-output models (Oita et al 2016). Key drivers identified in these N footprint studies include the disproportionate impacts of the production and consumption of animal products (particularly beef), wastewater treatment, and the use of coal as an energy source (Leach et al 2012, Shibata et al 2014, Liang et al 2016).
Based on the key drivers identified in past studies, N footprints are typically broken down into two main components: Nr emissions related to food production and consumption (including wastewater) and Nr emissions related to fossil fuels (including transportation and energy generation (Shibata et al 2014, Liang et al 2016). To account for Nr emissions associated with food production, N footprints include 'virtual' (or 'embodied') nitrogen: the total losses of Nr to the environment resulting from the production of food, but not contained in the consumed product (Galloway et al 2007). Estimating virtual N emissions as part of a food N footprint therefore commonly uses virtual nitrogen factors (VNFs): the ratio of Nr loss to the environment during the production and processing of a food item, compared to the weight of the final consumed product (kg N kg food−1, Leach et al 2012, Leip et al 2014). Since detailed VNFs are currently unavailable for many countries, some studies have used VNFs from the U.S. as proxies (Shibata et al 2014, Stevens et al 2014, MacDonald et al 2020). Estimating additional national and sub-national VNFs can therefore enable improved accounting of international food N footprints, for example, due to trade.
Previous country N footprints have typically been reported as national average per capita values. However, Nr flows and the relative importance of N footprint drivers (energy sources, food production and consumption patterns) can vary substantially across a nation (Liang et al 2018a). A single national average may obscure more local drivers of N footprints and therefore potential strategies to reduce Nr flows. Focusing on sub-national geographic contexts can highlight the differences in Nr production and consumption patterns within the same country, and is especially important to consider in large, geographically diverse nations, such as Canada.
Canada is therefore an illuminating case study to examine sub-national variation in both VNFs and the drivers of overall N footprints (figure 1). Canada has a highly urbanized population (>80% urban (World Bank 2019b)), and is the 2nd largest country in the world by area, yet one of the least densely populated. Agriculture and fossil fuel production are important economic drivers in Canada but differ in relative contribution to gross domestic product (GDP) by province. For example, the oil and gas industry is 25% of the province of Alberta's GDP, but only 5% of Canada's overall GDP (Statistics Canada 2021h). Similarly, agricultural production is not evenly spread across the country. For example, Saskatchewan produces over 50% (by weight) of several of Canada's major field crops (lentils, Canola, oats and wheat) (Statistics Canada 2021e), while 30% of the Canadian hog population is in Quebec (Statistics Canada 2021c). Canada is a major exporter of many of these agricultural products, but given its northern climate, also relies on imports for several types of foods, including tropical fruit and rice (Statistics Canada 2021a). In particular, Canada-U.S. food trade is one of the largest agricultural trade relationships in the world (MacDonald et al 2015).
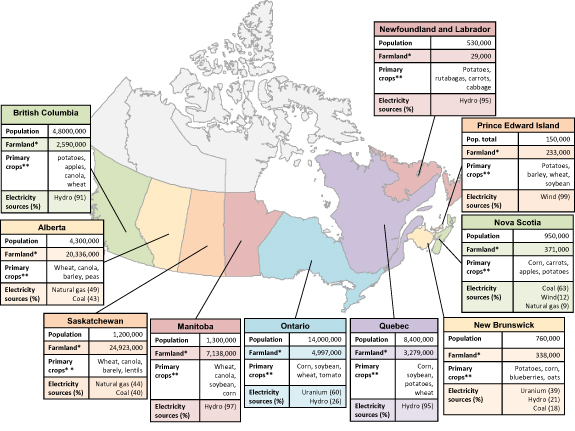
Figure 1. Overview of the ten Canadian provinces in terms of population, agricultural and energy characteristics that affect N footprints. Data from the 2016 Canadian Census (Government of Canada 2017), various Statistics Canada surveys and the National Energy Board of Canada (Canada Energy Regulator 2021). *Farmland is reported in hectares, including pasture and fallow. **Primary crops are listed by relative production (tonnes), excluding tame hay and corn for silage.
Download figure:
Standard image High-resolution imageCurrently, no large-scale N footprint studies have focused on the Canadian context. However, several previous national studies have conducted N accounting: for example, the residual soil nitrogen (RSN) indicator and indicator of risk of water contamination by nitrogen (IROWC-N) models developed by Agriculture and Agri-food Canada (AAFC) include mass-balance agricultural nitrogen budgets to estimate soil N losses from Canadian agriculture in 2001 (Yang et al 2007, De Jong et al 2009). Similarly, Karimi et al (2020) calculated an updated national agricultural N budget for Canada. A comprehensive Canadian N budget study was also conducted by Clair et al (2014), which included N flows for both natural and human-dominated ecosystems.
In this study we develop an N footprint model to account for Nr emissions released in Canada due to Canadian consumption and economic activities. We estimate the total (in Gg Nr yr−1) and per capita (kg Nr capita−1 yr−1) N footprints at the national scale for Canada and separately for each of Canada's ten provinces for a three-year average around 2018. Our N footprint follows a top-down approach that captures Nr emissions from a variety of economic activities and sectors, encompassing both individual consumption patterns and broader societal activities. We expected that the nitrogen footprint of each province would vary given different underlying geographies and contexts. The specific objectives of this study are to:
- (a)estimate domestic VNFs nationally and sub-nationally (provincially) for food produced in Canada as part of the food N footprint;
- (b)estimate a domestic N footprint comprising four major driver sectors for Canada and its ten provinces; and
- (c)compare variation in the drivers across N footprint sectors sub-nationally (by province).
2. Methodology
Our N footprint model accounts for Nr emissions (N2O, NOx , NH3, NO3 − −, NO2 −, standardized as kg N) related to Canadian consumption, as well as fossil fuel burning associated with domestic economic activities (table 1). Consumption activities include eating food, household utilities, and transportation. Emissions from economic activities that benefit Canadians include the oil and gas industry and manufacturing, although these subsectors may be export-oriented with final products consumed outside Canada (see section 2.6). We divided the N footprints into four driver sectors: Nr emissions from (a) crop production, (b) animal production, (c) wastewater treatment and (d) burning fossil fuels (figure 2). To account for temporal variation, each N footprint is the average of three years (2017, 2018 and 2019), which are also the most recent years with available data for all relevant sectors. Our model was written in R v.4.0.4 (R Core Team 2021) and all datasets used in this study, as well as related equations and code for the data preparation and analyses, are available online (Canadian Provincial N Footprints Supplementary Code 2021).
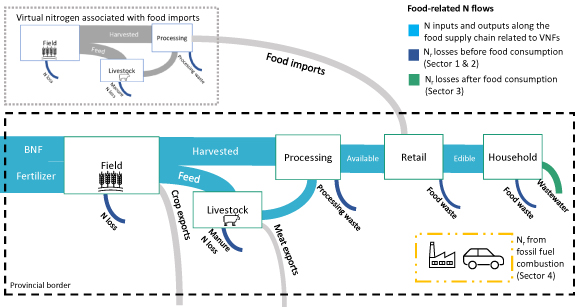
Figure 2. Diagram illustrating the key components of our top-down N footprint model. N footprints were estimated for each province, broken down into Nr losses due to food production (sector 1 crop production and sector 2 animal production), Nr losses after food consumption (sector 3 wastewater treatment) and Nr release from burning fossil fuels (sector 4). For food production, we estimated potential Nr losses at each step of the food supply chain (field, processing, etc.). To assess uncertainty around the impact of food trade, we performed a sensitivity analysis using different assumptions on origin of food consumed in a province (see figure 6).
Download figure:
Standard image High-resolution imageTable 1. Overview of N flow methodologies and data sources for the N footprint model in this study.
| Sector | N flows | Methods | Data and assumptions | Source |
|---|---|---|---|---|
| 1 and 2 VNFS | Fertilizer | Fertilizer sales, adjusted by crop recommended fertilizer rates and crop areas | Fertilizer shipments to Canadian agricultural markets; Crop areas; Provincially recommended fertilizer rates (RSN model) | Statistics Canada (2020b), Statistics Canada (2021d, 2021e, 2021f, 2021g), Yang et al (2007) |
| BNF | Crop area × crop BNF rate | Crop area and production Canadian BNF rates | Statistics Canada (2021e), Karimi et al (2020) | |
| N content of harvested crops | Crop production × N content of crop | Crop production N content of crops | Statistics Canada (2021d, 2021e, 2021f, 2021g), Karimi et al (2020) | |
| N content of livestock feed | Animal population × feed composition and rates × N content of feed | Livestock populations Provincial feed composition and rates (from farm livestock surveys) | Statistics Canada (2020c, 2020e, 2021c), Sheppard et al (2015) | |
| N content of slaughtered animals | Animal population × % slaughtered × N content of whole animal | Livestock populations Slaughter rate estimates Animal N content | Statistics Canada (2020c, 2020e, 2021c), Sheppard and Bittman (2015), Karimi et al (2020) | |
| N content of animal products | Milk and egg production × N content | Milk and egg production N contents | Statistics Canada (2021b, 2020d), Karimi et al (2020) | |
| N loss during manure storage | Manure N production × % animal populations on pasture × % N remaining after storage co-efficient Manure N production = N content of feed a − N content of animals slaughtered a and animal products a | Provincial animals on pasture and manure storage coefficients (from manure management surveys) | Huffman et al (2008) | |
| Denitrification & leaching | N applied to soil − denitrification × provincial leaching coefficients N applied to soil =(Fertilizer a + BNF a − N content harvested crops a ) + (N manure production a − N loss storage a ) | 10% of N to soil is denitrified, 1:1 ratio N20 to N2 Provincial leaching coefficients (IROWC-N model) | Yang et al (2007) De Jong et al (2009) | |
| Aquaculture | Feed weight = aquaculture production × feed conversion ratio | Aquaculture production Feed conversion ratio: 1.1 Feed is 70% soy N excretion rate: 32 g N kg−1 growth | Statistics Canada (2020b) Canadian Aquaculture Industry Alliance reports (2018) Reid (2007) | |
| Food processing and waste | (Unprocessed food production kg × N content) − (Processed consumed food weight × N content) Processed consumed food weight = unprocessed food production weight × food loss coefficients | Food loss coefficients N content unprocessed N content processed | USDA (2020), Karimi et al (2020) Canadian Nutrient File (Health Canada 2012), Lassaletta et al (2014) | |
| 1, 2 and 3 | Household food consumption | National food availability statistics adjusted by household food consumption | Food available in Canada Household food consumption from 24 h dietary recall | Statistics Canada (2021a) CCHS-N |
| 3 | Wastewater treatment | (N excreted × wastewater treatment N removal coefficients) + Nr emissions from incineration | Wastewater aqueous N removal coefficients Wastewater treatment coverage Nr emissions incineration | Wastewater Treatment Reports (S3) Statistics Canada (2021i) GHG and APEI |
| 4 | N from fossil fuels | N2O and NOx emissions | GHG and APEI |
a Estimated in a previous step. GHG: Canada's National Greenhouse Gas Inventory (Environment and Climate Change Canada 2020b), APEI: Canada's National Air Pollution Emissions Inventory (Environment and Climate Change Canada 2020a). CCHS-N: Canadian Community Health Survey—Nutrition (Statistics Canada 2007).
2.1. Food production and VNFs
We estimated VNFs at the national scale for Canada and separately for each of Canada's ten provinces (the three northern territories were excluded due to limited data). Our study encompasses 45 crops, which we aggregated into 5 crop groups: (a) grains, (b) fruits, (c) vegetables, (d) roots, and (e) legumes (see supplementary information S1, available online at stacks.iop.org/ERL/16/095007/mmedia, for food groups). Animal product VNFs were calculated for beef, pork, chicken, fish, milk, and eggs. We estimated VNFs as the sum of apparent Nr losses along the food supply chain from agriculture, processing, and food waste per kg of food consumed. Nr losses for crops include potential losses on agricultural fields and due to food processing and waste. Nr losses for animal products include the virtual N due to animal feed, manure Nr loss, and food processing and waste (figure 2).
At each step of the food supply chain, we estimated Nr release as the potential combined Nr losses to air and water (kg N). We estimated Nr losses as the difference between new Nr inputs and Nr outputs at a given step, and considered N recycling, leaching and denitrification (table 1). We subtracted inert N2 from our emissions since our focus is on Nr.
2.1.1. Agricultural field losses
To estimate Nr release that occurs in the field we estimated the difference between key inputs of new Nr and outputs at the field level. Inputs of new Nr were synthetic fertilizer and BNF while the output was N uptake from harvested crops. From this net-Nr applied to soils, we then estimated Nr leaching and denitrification (table 1). We did not include manure as an input in this step as it is a 'recycled' form of N, not new Nr, nor did we include atmospheric Nr deposition to avoid double-counting and Nr from other sources (e.g. fossil fuel emissions). Our handling of manure N and related losses is expanded on in section 2.2.2 on the animal VNFs below.
To estimate fertilizer N inputs by crop we followed the approach used by Yang et al (2007). We disaggregated total provincial N fertilizer sales for agricultural use based on crop areas in each province and the provincially recommended N application rate for each crop. While our study includes 45 individual crops, this may not capture every possible crop receiving a portion of the total fertilizer used in each province. As a result, the fertilizer N applied to our study crops is likely a slight overestimation. BNF was calculated by multiplying the N content of leguminous crops by the percentage that is fixed from the atmosphere. Values for N contents and BNF rates were taken from Karimi et al (2020). Crop N removal was estimated by multiplying crop dry-matter production from annual surveys from Statistics Canada (see table 1), by total crop N concentrations, including the harvested portion, residues, and root growth. Total crop N concentrations were taken from data published by Karimi et al (2020).
Estimates of denitrification and leaching at the national scale are uncertain due to high spatiotemporal variability. We therefore used the overall denitrification losses approach of Karimi et al (2020), and assumed that 10% of N contained in fertilizer and 10% of organic N remaining in soil from crop residues and roots are denitrified. Following the approach of AAFC's RSN model we assume that there is a 1:1 denitrification ratio of N20 to N2 (Yang et al 2007). We then estimated leaching values by applying an average provincial leaching co-efficient derived from AAFC's IROWC-N (De Jong et al 2009).
2.1.2. Animal feed and manure
For animal products, we accounted for N losses associated with feed production and the Nr released from manure during storage and once applied to soil. Virtual nitrogen for animal feed was estimated by multiplying the approximate weight and type of feed consumed per head of animal by the relevant crop VNF, including feed from forage and pasture (table 1). Data on Canadian livestock feed mix and amounts were taken from Canadian feed surveys and models by Sheppard and Bittman (2015). VNFs for feed crops and fertilized pasture were calculated assuming all Nr losses happen on the field. Forage VNFs were weighted by the ratio of managed to unmanaged pasture, given the disparities in N fertilizer use for these systems. There is potential overlap in how we attribute emissions from animals that produce both meat and other products (i.e. layer poultry and dairy cows). However, in their study of ammonia emissions from Canadian livestock, Sheppard and Bittman found that 97% of dairy cow emissions could be attributed to milk production, and 93% of layer emissions could be attributed to egg production (Sheppard and Bittman 2015). Therefore, we estimated beef VNFs using only beef cattle, milk from dairy cattle, chicken meat from broiler chickens, and eggs from layer chickens.
We assumed total manure Nr production for a given population of animals is equal to the difference between N consumed yearly through feed and the N contained in animals removed for slaughter (Puckett et al 1999). Only partial data is available at the provincial scale on number of animals slaughtered, so we applied estimates on the fraction of animal populations that are slaughtered annually (Sheppard and Bittman 2015) to provincial animal populations. We cross-checked our estimates with national slaughter statistics, and they were within 10% for cattle and 5% for hogs and chickens. Animals slaughtered were multiplied by average animal weight at slaughter (Sheppard and Bittman 2015), and animal N concentrations (Karimi et al 2020) to estimate N removal.
To estimate potential Nr losses from manure that is applied to soil, we assumed manure produced by pasture-grazed animals was deposited directly on pasture, and manure from housed livestock animals is stored before being applied to crops. Provincial distributions of manure management practices came from Huffman et al (2008). We multiplied our estimated manure production by coefficients for Canadian animal populations raised on pasture, and percentages of manure Nr remaining after storage (volatilization) losses for each management type (Huffman et al 2008). As with our crop VNFs, we assumed that 10% of N in manure applied to soil is denitrified (Karimi et al 2020) at a 1:1 N20 to N2 ratio (Yang et al 2007), and then applied average provincial leaching values (De Jong et al 2009). The remaining manure Nr is what we consider 'potentially recycled Nr', which is therefore omitted from losses.
Feed and manure N from farmed fish production were estimated using a slightly different method than other animal products. As 70% of aquaculture in Canada (by weight) is salmon (Statistics Canada 2020b), we used salmon as a proxy for all aquaculture production in Canada. To estimate virtual N associated with aquaculture feed, we used data from Canadian salmon farming reports, which suggested that approximately 70% of salmon feed is soy; we inferred that the remainder was from fish meal and oil from forage fish, which we assumed have negligible new anthropogenic Nr inputs and are therefore omitted from our VNFs. We used a feed conversion ratio of 1.1 to estimate amount of feed consumed by fish annually (Canadian Aquaculture Industry Alliance 2018) and an N excretion rate from farmed salmon of 32 g N kg−1 of growth (Reid 2007).
2.1.3. Food processing and waste
Statistics Canada's values for food waste are currently described as 'experimental' (Statistics Canada 2021a), so we used food loss coefficients for the United States from the USDA loss adjusted food availability tables (United States Department of Agriculture 2020). We estimated N from food loss and waste as the difference between the N in pre-processed crop or animal products and the N in the final consumed foods (i.e. the N in raw wheat harvested in the field and N consumed in wheat flour). N content values for consumed food came from the Canadian Nutrient File as well as Lassaletta et al (2014).
2.2. Food origin scenarios
We examined different scenarios to assess how assumptions and uncertainties about geographic food sourcing affect our provincial food N footprints. In our main analysis, we apply national weighted average VNFs based on the share of food production coming from each province. This assumes food is sourced nationally in proportion to provincial production. For example, the Canadian average VNF for beef is heavily weighted towards Alberta's beef VNF since this province produces the most beef in Canada. For context, Canada produces far more beef, pork and chicken domestically than it imports (imports account for 18%, 11%, and 13% respectively of the total supply of these foods) (Statistics Canada 2020a).
We applied two scenarios to examine uncertainty using alternative VNFs for each province. First, we used province-specific VNFs, assuming food is produced and consumed in the same province. If provincial VNFs were unavailable (e.g. provincial fruit VNFs could not be calculated for Newfoundland and Labrador due to data availability), we used the Canadian weighted average VNF. Second, because the United States is Canada's largest agricultural trading partner (FAOSTAT 2021b), we also estimated each provinces' food N footprint when using national weighted average VNFs for the U.S. from Leach et al (submitted), representing a scenario where food consumed in each province is sourced from the U.S.
2.3. Food consumption
Previous N footprint studies have typically used national average diets to estimate food intake, mainly from FAOSTAT (Leach et al 2012, Shibata et al 2014). For Canada, national food availability data from Statistics Canada (kg person−1 yr−1 adjusted for retail and household losses) (Statistics Canada 2021a) are available. Given the objectives of our study, we use a simple approach to incorporate variations in provincial diets into our model. First, to assess whether there are significant differences in food consumption patterns between provinces, we performed a Kruskal–Wallis statistical analysis using data from the 2015 Canadian Community Health Survey-Nutrition (CCHS-N). The CCHS is a national nutrition and health 24 h average food intake recall survey by Statistics Canada and Health Canada that included >35 000 respondents (Statistics Canada 2007). Several food groups, including beef, were consumed in significantly different quantities (p < 0.05) between provinces. However, when compared to national food availability data from Statistics Canada, the CCHS-N survey appeared to underrepresent absolute per capita meat consumption (in kg). Therefore, we scaled the national food availability values to the provincial level by using the relative provincial consumption values from the CCHS-N survey (see S2 for more detail). Consumed food weight was multiplied by the respective food N contents from the Canadian Nutrient File from Health Canada (2012) to estimate per capita N consumed.
2.4. Wastewater treatment
We estimated potential Nr loss during wastewater treatment as the sum of Nr released to water and air during and after treatment as well as Nr emissions from waste incineration. To estimate influent Nr to wastewater, we assumed all food N consumed by the population of each province is excreted (Liang et al 2018b). To estimate aqueous Nr removal we used Nr influent and effluent measurements from wastewater treatment plants representing the three treatment levels in Canada (primary, secondary, and tertiary) as proxies (see S3). Aqueous Nr removal was estimated as the difference between total Nr (total Kjeldahl nitrogen, nitrates, and nitrites) in influent and effluent. We therefore assume that 75% of influent Nr is released to surface waters or groundwater under primary treatment, 66% after secondary treatment and 30% after tertiary. In the case of no treatment, which includes septic tanks, we assume that 95% of consumed Nr is released to water (Brandes 1978). Aqueous Nr removal was then weighted by the percentage of the population in a province that is served by each of three wastewater treatment levels using data from Statistics Canada (Statistics Canada 2021i).
We estimated gaseous Nr released as N2O, NOx and NH3 emissions from wastewater treatment and waste incineration based on data from Canada's National Greenhouse Gas (GHG) Inventory, and from Canada's Air Pollutant Emissions Inventory (APEI). As with our agricultural estimates we assume a 1:1 N2O to N2 denitrification ratio. These atmospheric loss values include wastewater Nr from non-food sources (e.g. industry and other discharge), so they are likely proportionally larger than our estimates of Nr release to water, which are based on food N consumption.
The fate of remaining Nr after wastewater treatment (removed as biosolids or sludge and not incinerated) is uncertain. In our main analysis we assume 25% of this Nr is beneficially recycled. However, by some estimates, as much as 50% of wastewater biosolids may be recycled in Canada (Karimi et al 2020), with the rest being landfilled. Therefore, we performed a sensitivity analysis using a lower and upper bound of Nr recycling ranging from a low of 25% to a high of 50% 'beneficial' recycling to land (which lowers the N footprint).
2.5. Fossil fuels
To estimate fossil fuel-related Nr emissions we use a top-down approach, summing data on provincial N2O and NOx emissions (the forms of Nr released by burning fossil fuels). Data were obtained from greenhouse gas and air pollutant inventories, which account for N2O and NOx emissions, respectively. We then categorized these emissions into four subsectors based on their sources: (a) energy generation (emissions from public electricity and heat production, as well as commercial, institutional, and residential stationary combustion) (b) transportation (emissions from aviation, shipping, rail, trucks, and other vehicles), (c) the oil and gas industry, and (d) other industry sources (stationary energy generation and other emission sources from construction, mining, and other manufacturing industries). The oil and gas industry form a separate category because we expected them to be large sources of Nr emissions in Canada. However, for an N footprint, not all oil and gas industry emissions should be attributed to consumption in Canada since most of the oil is ultimately consumed abroad. Therefore, we only include 15% of the total sector emissions as approximately 85% of oil is exported (Statistics Canada 2016).
3. Results and discussion
We estimate that Canada's total N footprint is 995.7 Gg Nr yr−1, which equates to an average per capita footprint nationally of 27.1 kg Nr capita−1yr−1 for the period around the year 2018. There are clear differences in total N footprints, per capita N footprints, and the main sources of Nr between provinces. Provincial N footprints vary from 3.5 Gg Nr yr−1 (Prince Edward Island) to 311.8 Gg Nr yr−1 (Ontario) (figure 3(A)), the smallest and largest provinces by population, respectively. Saskatchewan has the largest per capita footprint at 50.3 kg Nr capita−1 yr−1, and Ontario the smallest at 22.0 kg Nr capita−1 yr−1 (figures 3(A) and (B)). Major drivers across all provinces include transport, beef consumption and wastewater treatment (figures 4(A) and (B)). The contributions of fossil fuels to the per-capita footprints are strongly influenced by the source of energy generation and the presence of the oil and gas industry.
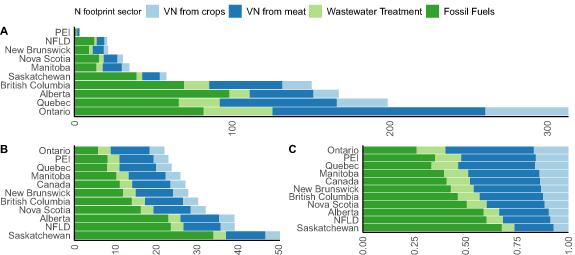
Figure 3. Total provincial N footprints by sector (A), per capita provincial N footprints by sector (B), and the relative contribution of each sector to a provinces' per capita footprint (C).
Download figure:
Standard image High-resolution image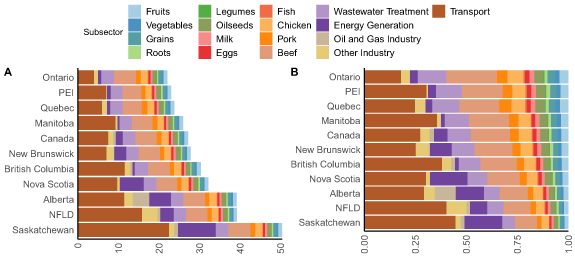
Figure 4. Per capita provincial N footprints by subsector (A), and the contribution of each subsector to each provinces' per capita footprint (B).
Download figure:
Standard image High-resolution image3.1. Food production and consumption
Diet is a major driver of N footprints in Canada. The average Canadian N footprint from food production is 12.9 kg N capita−1 yr−1, 50% of the total Canadian N footprint. However, in most provinces, other than Ontario and Quebec, less than 50% of the N footprint comes from food production. Ontario and Quebec are the two most populous provinces in Canada, and together account for nearly two-thirds of Canada's population (40% and 24% respectively). Therefore, the national weighted N footprint is disproportionately impacted by these provinces. Virtual nitrogen from meat production is a substantial contributor to Nr emissions across all provinces. Within the meat subsector, beef consumption is the largest driver. Beef consumption is the single largest overall driver of Ontario's, New Brunswick's, and Quebec's N footprints (5.4, 5.2, and 4.7 kg N capita−1 yr−1, respectively) and second largest in all other provinces except Alberta and Saskatchewan (figures 4(A) and (B)).
Our findings related to food production are broadly comparable to other N footprint studies. For example, Leach et al (submitted) estimated the food production N footprint for the U.S. to be ∼26 kg N capita−1 yr−1. Beyond differences in models, there are notable disparities in diets between the U.S. and Canada. For example, FAO estimates suggest Americans consume more meat than Canadians (e.g. the United States has a beef supply of 37.16 kg capita−1 yr−1 whereas Canada's is 26.78 kg capita−1 yr−1 (FAOSTAT 2021c)). The difference in beef consumption alone could explain ∼3 kg capita−1 additional N in the U.S. N footprint as compared to Canada. We discuss other differences related to VNFs in the next section.
3.1.1. Virtual nitrogen factors
Beef, pork, chicken, have the highest average VNFs of all food groups, which is common among other studies and mainly due to relatively lower efficiency of converting feed crops into edible protein (Metson et al 2020). Crops tend to have lower VNFs than animal products, although there is a large range between provincial values (figures 5 and S4). While differences in types of crops grown and farm N management affect the variability in provincial crop VNFs, environmental factors, such as leaching potential, also play a role. Wetter, colder provinces have higher leaching potential (De Jong et al 2009), which partially accounts for the higher VNFs for most crop groups in Newfoundland and Labrador, Nova Scotia, and New Brunswick .
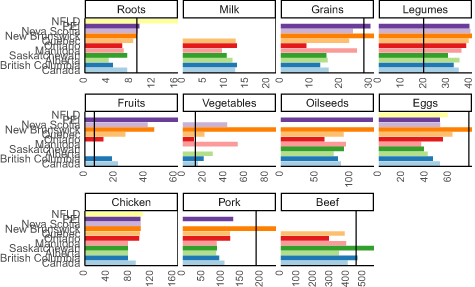
Figure 5. Provincial virtual nitrogen factors (VNFs, g N kg food−1) for different food groups. The Canadian average is a weighted average of provincial VNFs weighted by production. Provinces with no VNF for a food group have a small number of producers and are censored in Canadian agricultural surveys. Vertical lines indicate U.S. VNFs (Leach et al submitted) for comparison. Plots are organized from smallest to largest VNF, and horizontal axes vary accordingly. Our VNF for fish is 60 g N kg food−1, not shown here as it assumed to be the same across all provinces. NFLD: Newfoundland and Labrador, PEI: Prince Edward Island.
Download figure:
Standard image High-resolution imageWe compare our Canadian VNFs to findings for the U.S. from Leach et al (submitted) (see vertical lines in figure 5) and find that they are of comparable magnitudes for most food items, especially beef (our average weighted Canadian beef VNF is 401 g N kg food−1, the U.S. beef VNF is 456 g N kg food−1 . Our VNFs for pork and chicken are about 45% lower than those for the U.S., while our Canadian fruit and vegetable VNFs tend be higher (figure 5). These differences in the U.S. and Canadian VNFs are partly attributable to differences in crops considered in each food group (e.g. cereals in Canada include corn, rye, oats, triticale and wheat, whereas cereals in the U.S. include corn, wheat, and rice), and agricultural practices between the two countries, such as differences in crop fertilizer recommendation rates (e.g. Ontario, Canada recommends 135 lbs N acre−1 of corn (Ontario Ministry of Agriculture, Food and Rural Affairs 2018) whereas Minnesota, U.S. recommends 145–195 lbs N acre−1 (University of Minnesota Extension 2021)). Differences are also a reflection of methodologies, including data sources, Nr loss accounting, and livestock feed conversion efficiencies. For example, in our approach we use fertilizer sales data whereas Leach et al (submitted), used recommend fertilizer rates by crop and state mainly from university agricultural extension agencies.
Our VNF food origin scenarios resulted in a Canadian average food N footprint ranging from 12.4 kg N cap−1 yr−1 (using provincial VNFs) to 16.7 kg N cap−1 yr−1 (using U.S. VNFs) (figure 6). The Canadian average is heavily weighted towards Ontario, which has roughly half of Canada's total population. This province has relatively low provincial VNFs for most food groups (figure 5), resulting in a 37% increase in virtual nitrogen for the scenario assuming sourcing food from the United States (U.S. VNFs) over the scenario with local food sourcing (provincial VNFs) (figure 6). However, seven out of the ten provinces have their lowest relative food N footprints when assuming food is consumed proportionally to overall Canadian production (Canadian VNFs), which is the approach we use in our main results (figures 3–5). Since beef has a substantially higher VNF than other foods (four times that of pork, the next largest VNF), this was also strongly reflected in our food origin sensitivity analysis. In all scenarios and provinces 35%–40% of virtual nitrogen was from beef consumption.

Figure 6. Sensitivity analysis using different VNFs to estimate national and provincial virtual nitrogen footprints (N kg cap−1 yr−1) from consumption of crops and animal products. We used VNFs assuming (a) all food consumed in a province is sourced in a province (VNF provincial), (b) all food is sourced proportionally to overall Canadian production (VNF CAN weighted), and (c) food is sourced from the U.S. (VNF U.S.). Where a province did not have a VNF for a specific food group (figure 3), we used the Canadian weighted average for that food group instead.
Download figure:
Standard image High-resolution image3.1.2. Wastewater treatment
Nr release from wastewater treatment accounts for 3.1 kg N cap−1 yr−1 of the Canadian average N footprint, which makes it the third largest driver of the national and most provincial N footprints. Nitrates and nitrites are not regulated at a federal level across Canada, and ammonia regulation varies by province (Oleszkiewicz 2015). Geographical proximity to the ocean may be reflected in wastewater regulation for relatively low-population density coastal provinces (Nova Scotia, New Brunswick, Prince Edward Island and Newfoundland) as well as British Columbia, which discharge primarily to coastal waters and have generally lower N effluent standards than interior provinces (Ontario, Manitoba, Saskatchewan and Alberta) (Oleszkiewicz 2015). Only ∼30% of Canada's population is connected to municipal wastewater systems that receive tertiary treatment (the treatment level that may include biological nitrogen removal) (Statistics Canada 2021i).
Our wastewater treatment scenarios reflect the relatively low level of Nr removal in wastewater treatment across Canada: when using high (50%) and low (25%) N recycling scenarios, the average Canadian wastewater footprint decreases from 3.1 kg N cap−1 yr−1 to 2.7 kg N cap−1yr−1 (±13%). The largest variation was for Alberta (2.5–3.0 kg N cap−1yr−1, ±17%), which is the province with the highest tertiary treatment coverage (84%). Conversely, in British Columbia only 10% of the population is covered by tertiary treatment (McCourt Sibeal 2021), and it is also the province with the largest wastewater N footprint, varying between 3.1 and 3.2 kg N cap−1yr−1 (±3%) for the high/low scenarios (figure 7).

Figure 7. Wastewater sensitivity analysis examining different assumptions about recycling versus landfilling biosolids and sludge from wastewater treatment (N kg cap−1 yr−1). High recycling assumes 50% of N removed during wastewater treatment is recycled, and low assumes 25% recycling.
Download figure:
Standard image High-resolution image
3.2. Fossil fuels
Burning fossil fuels accounts for 11.1 kg N capita−1 yr−1, or 40% of the average Canadian N footprint. Larger provincial fossil fuel footprints mainly coincide with the makeup of energy grids and the presence or absence of fossil fuel or other natural resource extraction. The average energy N footprint in Canada is 1.8 kg N capita−1 yr−1 but varies considerably by province. In Nova Scotia, Saskatchewan and Alberta, 63%, 40% and 43% (Canada Energy Regulator 2021), respectively, of the energy grids are powered by burning coal (figure 1). These three provinces have a combined average energy N footprint of 6.9 kg N capita−1 yr−1, whereas other provinces are powered primarily by renewables and nuclear energy and have an average energy N footprint of 1.4 kg N capita−1 yr−1.
Nr emissions related to transport are the largest portion of the fossil fuel N footprint sector in Canada (7.4 kg N capita−1 yr−1 on average) and in six provinces (figure 4). Canada is one of the least densely populated countries on the planet, has large distances between cities, cold winters, and a strong natural resource sector. This means Canadians drive more than in many other nations (on average Canadians drive ∼15 200 km yr−1 (Natural Resources Canada 2008), Americans, by comparison, drive ∼13 500 km yr−1 (United States Department of Transportation 2018)). In addition, heavy-duty (>3.9 tonne) diesel vehicles are a major contributor to transport emissions in several provinces, typically associated with trucking, mining and other resource extraction activities (Environment and Climate Change Canada 2020a). While resource extraction contributes to a province's economy and thus indirectly benefits Canadians, these activities may be associated with foreign exports and thus consumption activities abroad.
3.3. Attributing top-down N footprint emissions from fossil fuels
Our top-down approach to N footprints (national and provincial territorial emissions divided by population) differs from bottom-up N footprint studies, which estimate N emissions using personal consumption data (e.g. household electricity use, and personal distances driven or flown), multiplied by emissions factors (Leach et al 2012, Pierer et al 2014, Shibata et al 2014, Liang et al 2016). Our top-down methodology, drawing from territorial N emission datasets, therefore captures additional N emissions when compared to a bottom-up approach, particularly in the case of fossil fuels. Since some territorial emissions may ultimately be attributed to consumption activities in other countries, they should be discounted from our N footprint. However, the specific amount to discount is uncertain. For example, the APEI and GHG territorial inventories report Nr emissions for 'aviation', which includes emissions associated with direct personal consumption (e.g. vacation flights), indirect consumption (cargo flights bringing in imports), and with exports (which should be excluded from an N footprint). A bottom-up approach only captures the emissions from direct personal consumption, whereas a top-down approach potentially captures emissions from all three areas.
To examine this uncertainty, we compared our fossil fuel N footprint results across these different approaches in our national N footprint, and for two resource-dependent provinces (table 2). These two provinces produce most (∼90%) of Canada's oil and gas (Statistics Canada 2016). Alberta alone produced 80% of Canada's total oil in 2019 (∼200 000 m3). We approximated a bottom-up fossil fuel N footprint by including only categories from the APEI and GHG inventories that were similar to those in the N-Calculator (a bottom-up N footprint model, Leach et al 2012), and a strictly territorial per capita N emissions estimate (including all categories with no adjustment for exports). The largest differences occur when discounting exports from the oil and gas industry in Alberta (the main approach we used in this study), and whether emissions from all forms of transport (like heavy machinery) are included in Saskatchewan.
Table 2. Per capita fossil fuel emissions from three methodologies, nationally and for two major oil and gas dependent provinces, Alberta and Saskatchewan.
| Region | Fossil fuel N-related emissions (kg capita−1 yr−1) | |||
|---|---|---|---|---|
| Sub-sector | Including all territorial emissions (from all stationary combustion, industries, heavy transport etc.) | Removing territorial emissions associated with oil exports (top-down footprint approach of this study) | Including only emissions from public energy generation, 'light' vehicles and aviation (similar to N-Calculator footprint approach) | |
| Alberta | Total | 45.9 | 23.0 | 6.3 |
| Energy | 5.4 | 5.4 | 4.9 | |
| Transport | 11.4 | 11.4 | 1.4 | |
| Saskatchewan | Total | 39.2 | 34.0 | 11.8 |
| Energy | 9.3 | 9.3 | 9.0 | |
| Transport | 22.5 | 22.5 | 2.9 | |
| Canada | Total | 14.5 | 11.1 | 2.7 |
| Energy | 1.8 | 1.8 | 1.5 | |
| Transport | 7.4 | 7.4 | 1.1 | |
In their top-down global input-output study of 188 countries, Oita et al estimated Canada's per capita N footprint to be ∼63 kg capita−1 yr−1, over twice our estimate of 27.1 kg capita−1 yr−1 (Oita et al 2016). The difference in scopes and methodologies of various N footprint studies means that comparisons need to be done carefully, however, valuable insights can still be gained. Oita et al accounted for a larger range of consumables than in our study, including non-food agricultural products like cotton. We plan to incorporate additional non-food agricultural goods in future assessments of Canada's N footprint, such as textile crops (e.g. hemp and flax), timber products and pet food (e.g. canary seed, of which Canada is the largest exporter in the world (FAOSTAT 2021a)).
3.4. Nr reduction policies and future research
Given the relative contribution of meat consumption and transport emissions to all provincial N footprints, moving towards more plant-based diets, and promoting the use of electric vehicles are among policy options that would be relevant across most of the country. Canada has already made strides in this direction by updating Canada's Food Guide in 2019 to encourage Canadians to eat a more plant-based diet (Health Canada 2021c). Furthermore, British Columbia and Quebec have passed legislation to ban the sale of new gas vehicles by 2040 (Canadian Press 2019) and 2035 (Lampert 2020), respectively, and both provinces already provide financial incentives for purchasing electric vehicles. Improving VNFs through better nitrogen use efficiency is also important, particularly for beef, as ammonia emissions from livestock are increasing in Canada (Environment and Climate Change Canada 2021a). Future research studying the change in N footprints over time, in relation to improved N use efficiency in agriculture, changing dietary patterns, and a general movement away from fossil fuels as an energy source, would also be insightful for policy recommendations to lower N emissions. Given the difference in our results between bottom-up and top-down N footprint approaches, additional case studies would be useful to examine how to equitably attribute emissions from transportation, manufacturing, and industrial sectors to a nations' N footprint.
4. Conclusions
Here we present the first estimate of Canadian and provincial average N footprints, using a top-down approach. Our results echo the findings of other studies in terms of the large contribution of meat production to N footprints, especially from beef. However, our work also shows variation in the relative importance of drivers of N footprints sub-nationally, particularly in relation to resource extraction. This study gives us a better understanding of the cumulative effect of individual consumption patterns, but also the challenges surrounding the attribution of other economic activities to Canada's N footprint. While uncertainty remains around the fate of Nr released to the Canadian environment as part of these footprints (e.g. Nr recycling from manure and wastewater), estimates of the relative magnitude of N footprint drivers provides a direction for us to begin to reduce them, whether through individual action or through policy intervention. Our study provides novel insights on drivers of Nr emissions at the sub-national scale, emphasizing the need to consider local geographic contexts when examining national Nr emissions.
Acknowledgments
The authors would like to thank A Leach, J Galloway, and A Oita for discussions on N footprints, and R Karimi, S Pogue and K Roland for discussions about nitrogen budgets in Canadian agriculture. A Leach and R Karimi also kindly shared data from their studies. This work was supported by the Trottier Institute for Science and Public Policy (TISPP) at McGill University and the Natural Sciences and Engineering Research Council of Canada (NSERC) Discovery Grants program (RGPIN-2016-04920).
Data availability statement
The data that support the findings of this study are openly available at the following URL/DOI: https://github.com/smccou/CAN_N_footprint.