

Abstract
Modeling of climate change impacts have mainly been focused on a small number of annual staple crops that provide most of the world's calories. Crop models typically do not represent perennial crops despite their high economic, nutritional, or cultural value. Here we assess climate change impacts on global tea production, chosen because of its high importance in culture and livelihoods of people around the world. We extended the dynamic global vegetation model with managed land, LPJmL4, global crop model to simulate the cultivation of tea plants. Simulated tea yields were validated and found in good agreement with historical observations as well as experiments on the effects of increasing CO2 concentrations. We then projected yields into the future under a range of climate scenarios from the Inter-Sectoral Impact Model Intercomparison Project. Under current irrigation levels and lowest climate change scenarios, tea yields are expected to decrease in major producing countries. In most climate scenarios, we project that tea yields are set to increase in China, India, and Vietnam. However, yield losses are expected to affect Kenya, Indonesia, and Sri Lanka. If abundant water supply and full irrigation is assumed for all tea cultivation areas, yields are projected to increase in all regions.
Export citation and abstract BibTeX RIS

Original content from this work may be used under the terms of the Creative Commons Attribution 3.0 licence. Any further distribution of this work must maintain attribution to the author(s) and the title of the work, journal citation and DOI.
1. Introduction
The impacts of global climate change on many agricultural systems remain uncertain, but modeling analyses indicate that, without adequate adaptation measures, crop yields are likely to decline overall by 2050 and more strongly towards the end of the century (Nelson et al 2014, Porter et al 2014, Meijl et al 2018). Both modeling and experimental climate change impact studies for the agricultural sector have largely focused on a small set of annual staple food crops such as wheat, maize, and rice, which are most relevant for global calorie supply and land use. However, perennial crops cover around 10% of the world's cropland (FAO 2019) and often have high nutritional and economic value (Yahia et al 2019). Tree and leaf crops differ from annual grain crops in physiology, environmental requirements, as well as management and therefore require dedicated modeling approaches. Including perennial and tree crops in climate impact analyses is essential to broaden our understanding of the manifold repercussions of climate change on the agricultural sector.
Tea is one of the world's most widely consumed beverages and the global tea market was recently valued at 15 billion dollars (FAO 2015). Tea cultivation requires specific agroclimatic conditions (Kabir 2002) and the major producing countries include China, India, Kenya and Sri Lanka. Given the geographic specificity of supply, climate induced changes to crop yields can quickly affect commodity markets and livelihoods of people dependent on the tea value chain. Despite the potential socioeconomic consequences, only a few studies have investigated the impacts of climate change on tea cultivation (Ahmed et al 2014, Hong and Yabe 2017). Earlier studies, based on simple climate envelope approaches, concluded that large areas in East Africa will no longer be suitable for tea cultivation (CIAT 2011a, 2011b). Another study using a 15 year time series of yield and weather data from Sri Lanka also extrapolated a decline in annual tea production under a high emissions scenario (Gunathilaka et al 2017). However, these statistical methods did not account for the effects of rising CO2 concentrations on the productivity and water use efficiency of plants. A process-based modeling approach accounting for the effects of temperature, water availability, CO2 fertilization and crop management (irrigation and harvest) is therefore needed to refine these assessments. Process-based models use representations of biogeochemical processes such as photosynthesis and transpiration to simulate plant growth and hence do not rely on observed statistical relationships that may differ under climate change (Cuddington et al 2013).
Here we introduce an extended version of the process-based dynamic global vegetation model with managed land LPJmL4 (Schaphoff et al 2018a, 2018b) capable of simulating tea plant growth under different climate and management scenarios at the global scale. We evaluate the new model features against observed tea yields at the national level from different world regions and at different sites, including two experimental sites that grow tea under elevated atmospheric carbon dioxide concentrations ([CO2]). Finally, we analyze the effects of future climate change on current tea cultivation by the end of the century using climate scenarios from five different Global Climate Models (GCMs) based on four representative concentrations pathways (RCPs) that describe alternative future greenhouse gas emission trajectories (van Vuuren et al 2011).
2. Methods
2.1. The LPJmL model
LPJmL is a process-based global crop model that provides an integrated framework to study the effects of climate and human land use on terrestrial ecosystems, the carbon and water cycle, and on agricultural productivity. The model simulates key ecosystem processes and services including net primary productivity, carbon stocks in vegetation and soils, as well as agricultural yields and irrigation demand (Schaphoff et al 2018a, 2018b). Growth and productivity of natural and agricultural vegetation are consistently linked through their water, carbon, and energy fluxes. This enables modeling of a broad range of impacts from land use change, CO2 fertilization, and climate change on the terrestrial biosphere as well as feedbacks within them. LPJmL represents the diversity of plant species based on a limited set of generic functional types, i.e. prototypes of plants representing groups of species with similar physiological and morphological traits. Currently, LPJmL uses 10 natural plant functional types (PFTs), 12 crop functional types (CFTs), and 3 bioenergy functional types (BFTs). PFTs are used to reduce the complexity of species diversity to a few generic types that represent groupings of plant species with similar structure, phenology, and physiology. Each PFT is defined by a number of parameters that define bioclimatic limits or decay rates of dead plant materials derived from observable characteristics such as species distribution or plant height. CFTs and BFTs use the same concept as the PFTs to represent a range of plant species used in agriculture, but with additional agro-ecosystem-oriented functions and parameters, e.g. vernalization requirements or harvest index range (Bondeau et al 2007, Beringer et al 2011). LPJmL has been validated against a broad range of observed data (Schaphoff et al 2018b).
Data on weather and soils are used to drive the model. Depending on the timeframe of the simulations either observed climate or scenarios from climate models are used. The soil consists of a fast and a slow organic matter pool and is divided into five hydrological active layers down to a depth of 3 m. For this study we used soil texture data from the Harmonized World Soil Database (HWSD) (FAO/IIASA/ISRIC/ISS-CAS/JRC 2012). Current land use was not considered in our modeling setup; instead we simulated tea plantations everywhere to compute possible productivity levels for fully irrigated and purely rainfed conditions on all land, i.e. also outside currently used areas, following the ISIMIP modeling protocol (Rosenzweig et al 2014, Frieler et al 2017).
2.2. Implementation of tea cultivation in LPJmL
Tea (Camellia sinensis) is an evergreen shrub or small tree native to East Asia, the Indian Subcontinent, and Southeast Asia. Cultivation occurs in tropical and subtropical regions across the world. Tea plants grow best under tropical and subtropical climates and require annual rainfall of at least 1250 mm yr−1 (FAO 2015). Plants can tolerate temperatures up to −17 °C, but annual mean temperatures should exceed 13 °C for optimal plant growth (Li et al 2012). Different varieties of tea have economic life spans between 40 and 100 years. When cultivated, Camellia sinensis is usually kept at waist height by pruning in order to facilitate easy access during leaf harvest (Carr 2018).
The further development of the model presented here is based on previous work that introduced a framework for simulating tree crops in LPJmL (Fader et al 2015). Agricultural trees, as implemented by Fader et al (2015), are established as larger saplings compared to trees in natural vegetation in order to reflect initial growth in nurseries. Agricultural trees require a few parameters not otherwise used for natural trees or annual crops. These include a country-specific planting density, and a pre-defined tree-specific parameter that determines the number of years over which the trees need to grow before they are harvested for the first time. After the pre-harvest phase, a fixed share of plant productivity is allocated to harvest, i.e. the harvest ratio. We make use of the same modeling principles for tea, which was not included in the set of agricultural trees presented by Fader et al (2015).
We parameterized the tea crop as a tropical broadleaved evergreen agricultural tree using initial parameters from the tropical broadleaved evergreen PFT (TrBE), as parameterized in the LPJmL for natural ecosystems. Several plant parameters were revised to represent physiological and morphological characteristics of the tea plant (table 1).
Table 1. Overview of CFT parameters that have been changed from their original values in the reference PFT (tropical broadleaved evergreen tree). For the full list of model parameters see Schaphoff et al (2018a).
| Parameter | Description | Value |
|---|---|---|
| allom1 | Allometry parameter 1 | 60 |
| allom2 | Allometry parameter 2 | 40 |
| allom3 | Allometry parameter 3 | 0.97 |
| hmax | Maximum height of tea trees (m) | 1.3 |
| kest | Tree density on plantation (trees/ha). | 12 000 |
| αa | fraction of photosynthetically active radiation (PAR) assimilated at stand level relative to leaf level (%) | 1.0 |
| topt | lower and upper limit of optimum temperature for photosynthesis (°C) | 20.36 |
| HR | Harvest ratio: share of net primary productivity harvested | 0.15 |
Tea trees are maintained at a low height on plantations to facilitate harvesting, i.e. shape and size of the tea plants develop differently compared to unmanaged plants in natural vegetation. Allometric rules in LPJmL prescribe carbon allocation to different plant compartments and hence their relative sizes (parameters allom1, allom2, allom3). For tea, these were adapted to account for the size and proportions of tea trees under plantation management to allow tea trees to develop relatively large crowns at small heights and stem diameters compared PFTs in natural vegetation. At the defined maximum height of 1.3 m (parameter hmax), the crown of tea trees reaches a maximum crown diameter of about 0.6 m in line with a plant spacing of 0.6 × 1.3 m for a planting density of 12 000 plants/ha (Kigalu 2007). Figure 1 shows the increase in crown diameter with tree height for tea and TrBE trees in LPJmL. Typical plant densities on tea plantations today range between 10 000 and 14 000 plants per hectare (Carr 2018). Here we use the intermediate value of 12 000 plants per hectare in all simulations and regions (parameter kest).
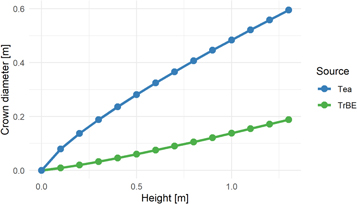
Figure 1. Development of crown diameter in simulated tea trees (Tea) and the tropical broadleaved evergreen tree PFT (TrBE) in LPJmL for low tree heights.
Download figure:
Standard image High-resolution imageIn natural ecosystems, leaf-level photosynthesis is scaled to stand-level with the parameter αa, which can reach 1.0 in intensely managed agricultural ecosystems (Haxeltine and Prentice 1996). Regular spacing and low heights of tea trees on plantations reduce mutual shading and increase the amount of incoming solar radiation available for individual plants. Consequently, we set αa to one for tea plantations (table 1). Matthews and Stephens (1998) report an optimal temperature range for photosynthesis in tea plants of 20 °C–36 °C which we also adopt in the model (parameter topt).
We used tea yield data from the Kericho area in Kenya, provided by Unilever, to determine a value of 0.15 for the harvest ratio so that simulated yields levels were comparable to observed yields (parameter HR). During the parameterization procedure, the harvest ratio was only determined for a single grid cell which corresponds to the location of the Kericho plantations. The 0.15 value was then used globally in all simulations presented here.
LPJmL expresses simulated yields in units of carbon. For the comparisons with the yield statistics we have therefore converted simulation results into units of dry matter assuming a carbon content of 45%.
2.3. Model evaluation
To validate the model performance under current climate, we used gridded daily mean temperature and cloud cover information from the CRU TS 3.23 climatology dataset (Harris et al 2014) and precipitation data from the GPCC Full Data Monthly Product Version 7 (Schneider et al 2015).
We evaluated the version of LPJmL presented here against observed tea yields published by the Rainforest Alliance (2019). This data set provides a list of 426 certified individual farms and groups in 21 countries including tea production areas and volumes from which we calculated yields per hectare. Locations for farms and groups within countries are not given so we aggregated available yields to the country level. For the comparison with LPJmL we only used data from countries for which at least 15 different observations are available to minimize the potential effect of outliers on country averages. We assumed that certified plantations are generally well managed, and yields are likely to be in the range of potential yields under local growing conditions with a small yield gap.
For comparison with yield statistics from Rainforest Alliance (2019), we aggregated the gridded yield simulations from LPJmL to area-weighted national means in current tea cultivation areas using data on harvested areas for the year 2005 from the Spatial Production Allocation Model 2005 version 3.2 (SPAM) (IFPRI and IIASA 2019). Yields from LPJmL were also averaged over a 20 year period (1991–2010) to calculate a representative, average yield level under current climate conditions.
We used data from Wijeratne et al (2007) for assessing the effects of elevated [CO2] on tea yields.
2.4. Projections of yields into the future
For the simulations of tea productivity under climate change we used climate scenarios from the Inter-Sectoral Impact Model Intercomparison Project (ISIMIP) fast track initiative as in the ISIMIP fast track simulations (Rosenzweig et al 2014, Warszawski et al 2014). This dataset provides daily, bias-corrected, gridded climate data at 0.5° resolution from five different GCMs (Hempel et al 2013): HadGEM2-ES (Jones et al 2011), IPSL-CM5A-LR (Dufresne et al 2013), MIROC-ESM-CHEM (Watanabe et al 2011), GFDL-ESM2M (Dunne et al 2013a, 2013b), and NorESM1-M (Bentsen et al 2013, Iversen et al 2013). From each GCM we used climate scenarios based on all four RCPs (van Vuuren et al 2011) corresponding to mean changes in global surface air temperature of 1 °C (RCP2.6), 1.8 °C (RCP4.5), 2.2 °C (RCP6.0) and 3.7 °C (RCP8.5) by 2081–2100 relative to the 1986–2005 reference period (IPCC 2013).
Our analysis of climate impacts on future tea production focuses on the Worlds' ten major producer countries which comprise about 90% of all tea cultivation areas and global tea production (IFPRI and IIASA 2019).
3. Results
3.1. Evaluation of the tea model
Figure 2 shows a comparison of simulated and observed tea yields in major producer countries averaged over the 1991–2010 period. Yield values from LPJmL agree well the observations and also capture different yield levels in different countries. From these countries, Sri Lanka is the only exception where LPJmL is not able to reproduce the observed yield level. When excluding Sri Lanka from the data set, we find that simulated yields correlate significantly with observed yields (R2 0.9, root-mean-square error (RMSE) 0.2 t/ha/yr). Including Sri Lanka the correlation between observations and simulation is reduced to 0.54 (RMSE 0.3 t/ha/yr).

Figure 2. Comparison of simulated and observed tea yields (tons of dry matter per hectare per year) from different countries shown as averages for the years 1991–2010. Country values based on LPJmL simulations are area-weighted national averages using cultivation areas within a country taken from the SPAM land use data (IFPRI and IIASA 2019). Observed tea yields are from Rainforest Alliance (2019). We show only countries for which at least 15 observations are available in the Rainforest Alliance (2019) dataset.
Download figure:
Standard image High-resolution imageLPJmL is also able to reproduce the variability of tea yields over time at the plantation level. Figure 3 shows interannual yield changes between 2012 and 2015 in the Kericho region of Kenya simulated by LPJmL versus those observed at Unilever's Kericho tea plantations. The Unilever plantations are not irrigated and yield variations are therefore largely driven by differences in weather conditions during this period.
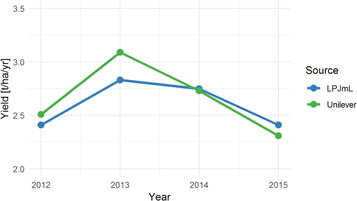
Figure 3. Comparison of simulated and observed annual tea yields between 2012 and 2015 in the Kericho region in Kenya. Data from Kericho were provided by Unilever. Yields are given in tons of dry matter per hectare per year.
Download figure:
Standard image High-resolution imageFigure 4 shows the effects of increased [CO2] on simulated tea yields in current plantation areas averaged over 1991–2010. The comparison of a simulation with 600 ppm with a simulation under observed [CO2] for this period shows a positive effect on yields in all regions with yield increases between 20% and 50%. The green line in figure 4 represents the results from open-chamber experiments at two locations in Sri Lanka that observed around 35% higher tea yields under 600 ppm [CO2] (Wijeratne et al 2007). Yield changes from elevated [CO2] in Sri Lanka simulated by LPJmL are similar to the experimental results, as well as to the average change in all countries shown in figure 4. We also calculated changes in simulated yields at the exact locations of the experiments described in Wijeratne et al (2007) and found that yields in LPJmL increase by 36.1% on average at the two test sites, close to the measured increase of 35% (supplementary figure 1 is available online at stacks.iop.org/ERL/15/034023/mmedia).
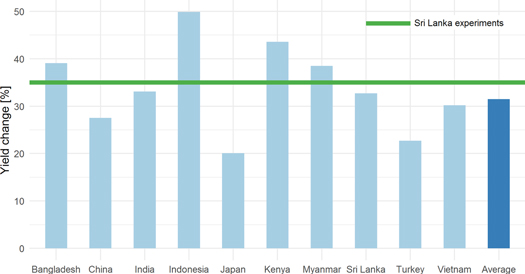
Figure 4. Changes in simulated tea yields under 600 ppm [CO2] in major producer countries on current cultivation areas relative to yields under current [CO2]. The green line indicates the results from open-top chamber experiments in Sri Lanka under 600 ppm (Wijeratne et al 2007). The list of countries was compiled to cover 90% of global tea cultivation areas in 2005 (IFPRI and IIASA 2019).
Download figure:
Standard image High-resolution image3.2. Tea yields under projected climate change scenarios
Figure 5 shows simulated changes in mean tea yields over all climate scenarios between 1971–2000 and 2069–2099 on current cultivation areas (IFPRI and IIASA 2019) in major producer countries assuming no irrigation water constraints on current irrigation areas. The simulations include CO2 fertilization and assume no change in irrigated areas or management in the future. Generally, yield reductions occur under the weakest climate change scenario RCP2.6 whereas tea yields increase under more extreme climate change scenarios in most regions. In China, Japan, Turkey, and Vietnam increased yields are projected under all climate change scenarios. On average across all regions, yields increase by 2%, 14%, 20%, and 27% under RCP2.6, RCP4.5, RCP6.0, and RCP8.5, respectively. The stronger CO2 fertilization effect in RCP6.0 and RCP8.5 often overcompensates for the negative effects of climate change (supplementary figures 2–5). Indonesia, Kenya, Sri Lanka and to some extent Bangladesh are projected to see substantial yield declines under some climate scenarios but all countries are also projected to see increasing tea yields under other climate scenarios.
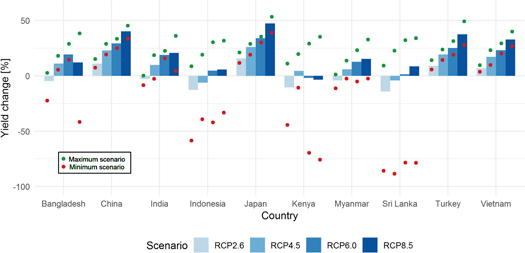
Figure 5. Relative changes in tea yields in percent on current cultivation areas by the end of the century under the four greenhouse gas emissions pathways. Changes are calculated from the difference between average values from the baseline (1971–2000) and future (2069–2099) periods relative to the baseline period. Simulations include CO2 fertilization and assume constant (current) shares of irrigated areas (4% of current cultivated tea) and no irrigation water constraints over time. Minimum and maximum values from different climate models are presented as red and green dots for each RCP and country. Blue bars are averages over all climate models per RCP.
Download figure:
Standard image High-resolution imageThere are large differences in the results from different climate models. Results for China, India, Japan, Turkey, and Vietnam show relatively low model uncertainty. Results are consistent between models both in terms of direction and size. For other countries, the range of results from different climate models varies between large negative and large positive changes, mostly as a result of differences in projected changes in rainfall patterns as we assume no change in irrigation.
We performed additional simulations with LPJmL under constant [CO2] to determine the significance of the effect for the results. Without elevated CO2 fertilization, we find that both rainfed and irrigated yields decline in all countries under all climate scenarios over the simulation period (supplementary figures 2–5).
Figure 6 shows long-term changes in tea yields under the assumption that all cultivated areas are fully irrigated without limits to water availability for irrigation. Avoiding water stress would fully offset the negative impacts of climate schange projected for some countries in the RCP2.6 scenario.

Figure 6. Relative changes in yields assuming fully irrigated cultivation of tea in current growing areas up to the end of the century under the four greenhouse gas emissions pathways and averaged over all climate models. Changes are calculated from the difference between the baseline (1971–2000) and future (2069–2099) period averages relative to the baseline average. Simulations include CO2 fertilization and assume that all tea plantations are fully irrigated without limitations to irrigation water supply.
Download figure:
Standard image High-resolution image
4. Discussion
This work contributes to addressing gaps in our understanding of potential climate change impacts on valuable perennial crops. The extended version of LPJmL suitable for simulating tea cultivation performs relatively well in comparison to reference data from tea plantations in different countries. However, since the model does not account for nutrient limitations, pests and diseases, or sub-optimal management we expect that yield levels could be overestimated in regions with low intensity, smallholder production. This possibly explains why observed yields in Sri Lanka are substantially lower than simulated yields (figure 2). Yield levels in other countries are also often slightly underestimated, suggesting that other parameters may implicitly better represent sub-optimal management. These primarily include the parameterization of planting densities and the diversion of NPP to harvest. In the absence of more specific regional information, we use single global parameters here, but acknowledge that these parameters will likely vary, reflecting regional differences in management practices and environmental conditions. The model simulation shows good agreement with experimental data generated under increased [CO2]. As described above, our model is not able to accurately reproduce observed yields in Sri Lanka (overestimation of reported national average yields by 1 tDM/ha or 76%). Therefore, it would have been better to use data from another country to evaluate the reaction of LPJmL to higher [CO2]. However, we use the information from Wijeratne et al (2007) here because we are not aware of any alternative study that investigated the influence of increased [CO2] on tea productivity. In general, data are scarce and more data would be desirable for more robust model evaluation. We also use historic climate data based on the spatial interpolation of data from weather stations with limited coverage in some regions. It is therefore likely that these data do not reflect local climate conditions well in all locations, exacerbating differences between simulated and observed yields noted in the evaluation of LPJmL.
The selection of GCMs available from the ISIMIP archive represents only a subset of all models available from the Coupled Model Intercomparison Project (CMIP). According to McSweeney and Jones (2016) data from ISIMIP cover only 75% of the full range of future projections for temperature and 55% for precipitation. Future assessments should therefore aim to capture the full plausible range of future climate change by using data from additional GCMs. Furthermore, extreme events are expected to become more frequent in the future (Sillmann et al 2013), but these events at local- to regional-scale are not well represented in GCMs (Maraun 2016).
Our analysis shows that the projected effects of climate change on currently important tea-growing regions will vary. According to our simulations, growing conditions for tea will improve in some countries, such as China and India, reflected in robust yield increases across most climate change scenarios assuming no expansion of irrigated areas from the current level and no water limitations on existing irrigated areas. However, projected climate impacts in Kenya, Sri Lanka, and Indonesia are more uncertain and strongly depend on the manifestation of changes in precipitation under climate change. While average changes over all climate scenarios indicate small yield decreases under limited climate change and small yield gains under stronger climate change, some climate scenarios lead to large yield losses of above 50%.
Climate change effects on tea yields are strongly mitigated by rising [CO2]. It is possible that acclimation of photosynthesis that drives down productivity (Bagley et al 2015) and increasing nutrient limitations that constrain productivity (Reich et al 2006) may reduce the CO2 effect in the longer term. An analysis of tropical trees found no stimulation of tree growth from rising [CO2] over the past 150 years, but only higher water use efficiencies indicating that vegetation models may overestimate the size of the CO2 effect (Kolby Smith et al 2016). Effects of elevated [CO2], other than on productivity, such as on chemical composition of the crop as observed in other crops (e.g. Myers et al 2014) and possible effects on taste or insect damage also observed for other crops (e.g. Dermody et al 2008, Zavala et al 2008), could potentially be important for the economic profitability of tea production. Even though the impacts of projected changes in tea productivity on markets cannot be assessed with our simulations, we expect that these projections will help to better assess agricultural market dynamics and commodity diversity, which so far often assumes that crops not directly modeled will see similar climate change impacts as the main staple crops (Müller and Robertson 2014).
There are hardly any projections for changes in tea productivity under climate change available in the literature and our results are thus not well-embedded in other estimates that allow for a discussion of model-based uncertainties in the projections. This is also true for perennial crops in general, where very few studies are available which often look at very specific cases only (e.g. Lobell and Field 2011). Our overall results for Kenya are consistent with an earlier study that concluded that the suitability for tea cultivation on current Kenyan farmland will decline by the middle of the century (CIAT 2011a). Against this background, the authors of that study discussed the question of whether a relocation of cultivated areas to higher altitudes would provide an option for adaptation. However, the authors warned that relocation could primarily affect protected and valuable natural ecosystems at higher elevations and hence cause environmental degradation. For this reason, relocation needs to be avoided and irrigation could become an important adaptation strategy in some regions (CIAT 2011a). While our stylized simulations assuming full irrigation and permanent water availability indicate that irrigation may counterbalance yield losses from climate change these simulations do not account for local water availability. This would require a different set of simulations in which the water consumption of other users within the relevant watersheds are also considered (e.g. Heinke et al 2019). Extreme events may further affect the availability of irrigation water to maintain production levels. Assessments of future irrigation water availability would also need to consider the efficiency of irrigation water techniques employed (Jägermeyr et al 2015), water regulation and land-use changes that may affect precipitation and water flow (Bonsch et al 2015).
Additional assessments of climate impacts on tea productivity using different crop models are also required to reduce uncertainties as crop models add a substantial share to the overall uncertainties of climate impact studies (e.g. Müller et al 2015). Here we can only show that the uncertainty from climate models is large but are unable to investigate how simulation results would differ when using an alternative crop model.
In addition to the influence of climate change on the annual productivity of tea plantations, potential changes in quality are also of central importance. Some chemical compounds of tea related to its health benefits are reduced under higher temperatures or shifting monsoon seasons (Kowalsick et al 2014, Nowogrodzki 2019). These effects cannot be represented with the current modeling approach in LPJmL.
5. Conclusion
Worldwide tea demand is projected to increase further and climate change will affect the world's most important producers differently. While some regions are likely to benefit from changes in temperature, precipitation, and elevated [CO2], other regions need to invest in adaptation measures. Cultivation of drought and heat resistant varieties, implementation of agroforestry systems, or additional irrigation may become necessary to stabilize and increase yield levels in the future.
We here present the first—to our best knowledge—process-based model for tea productivity, implemented in a well-established dynamic global vegetation, hydrology and crop model. Although assessments of climate impacts on crop productivity are characterized by large uncertainties, the model evaluation showed promising good agreement with measured historical data. Our global analysis suggests that if no adaptation measures are put in place, most tea producing regions will be negatively affected under the mildest climate change conditions (RCP2.6) while Kenya will also be negatively affected under stronger climate change. If water limitations are addressed all regions are expected to profit from increased yield productivity. These findings support and accentuate the case for investment in climate change adaptation measures by major tea producers, especially efficient irrigation and water supply systems.
Acknowledgments
We would like to thank two anonymous reviewers for very helpful comments on the manuscript. The work was funded by grants from Unilever Research and Development. The publication of this article was funded by the Open Access Fund of the Leibniz Association.
Data availability
The data that support the findings of this study are openly available at https://mygeohub.org/resources/agmip.