

Abstract
The semi-arid ecosystems dominate the inter-annual variability of the global carbon sink and the driving role of semi-arid ecosystems is becoming increasingly important. However, the impacts of climate change on the dynamics of carbon and water fluxes in global semi-arid ecosystems are still not well understood. We used a data-driven (or machine learning) approach, along with observations from a number of FLUXNET sites and spatially continuous satellite and meteorological data, to generate gridded carbon and water flux estimates for semi-arid regions globally, and then examined the magnitude, spatial patterns, and trends of carbon and water fluxes and their responses to climate change during the period 1982–2015. The average annual gross primary productivity (GPP), net ecosystem productivity (NEP), evapotranspiration (ET), and water use efficiency (WUE) were 628.6 g C m−2 yr−1, 9.6 g C m−2 yr−1, 463.1 mm yr−1, and 1.60 g C Kg−1 H2O, respectively. The climate conditions during the period 1982–2015 enhanced gross and net carbon uptake in global semi-arid regions. The spatially-averaged annual GPP, NEP, ET, and WUE in semi-arid regions showed significant increases both globally and regionally (Asia, Africa, and Australia). As with GPP and ET, WUE significantly increased in North America, Asia, Africa, and Australia. Australia was the most sensitive semi-arid region in terms of changes in carbon and water fluxes and their responses to climate. Semi-arid forests, shrublands, and savannas were net carbon sinks; croplands were minor carbon sources; grasslands were nearly carbon neutral. Overall, precipitation was the most important climate factor influencing the carbon and water fluxes; WUE in 40.9% of the semi-arid region was significantly influenced by precipitation. The global climate change is expected to influence global semi-arid ecosystems in many ways and our findings have implications for semi-arid ecosystem management and policy making.
Export citation and abstract BibTeX RIS

Original content from this work may be used under the terms of the Creative Commons Attribution 4.0 licence. Any further distribution of this work must maintain attribution to the author(s) and the title of the work, journal citation and DOI.
1. Introduction
Semi-arid regions constitute around 15% of the global land area and are estimated to be the home of approximately 15% of the global human population [1]. Semi-arid regions, defined as areas with an aridity index (the ratio of precipitation to potential evapotranspiration) of between 0.2 and 0.5 [2], are mainly covered by grasslands, scattered trees (savannas) and shrublands. Water is an important limiting factor for plant growth in these regions [3], and semi-arid ecosystems are particularly vulnerable to climate variability and change. The intermittent water shortages during the growing season could lead to severe droughts and thereby lower GPP and food production [4]. Semi-arid ecosystems play an important role in the carbon-climate system due to the tremendous extent of these ecosystems [4]. A recent study indicated that the trend and inter-annual variability of the global carbon sink are dominated by semi-arid ecosystems, although the mean sink is dominated by highly productive lands (mainly tropical forests) [5]. Among the global semi-arid ecosystems, the southern hemisphere vegetation, especially Australian ecosystems, contributed largely to the global carbon sink anomalies [6, 7]. In addition, among the dryland ecosystems, semi-arid regions experienced the largest expansion and accounted for nearly half of the total dryland expansion [8]. The driving role of semi-arid ecosystems is therefore becoming increasingly important [7]. However, few studies have assessed the impacts of climate change on the long-term trends of carbon uptake in global semi-arid ecosystems.
In semi-arid ecosystems, water is the main limit to ecosystem productivity and human settlement. The inter-annual variations of vegetation productivity in semi-arid areas are closely related to drought and inter-annual variability of precipitation [9, 10], and vegetation dynamics in turn exerts a strong controlling effect on regional water circulation [11]. Consequently, the terrestrial carbon and water cycles are strongly coupled in the semi-arid regions [12]. Understanding the relationship between plant production and water usage is critical for projecting the dynamics of semi-arid ecosystems and their responses to climate change. Water use efficiency (WUE), defined as the amount of carbon fixed per unit of water transpired, measures the trade-off between carbon gain and water loss of terrestrial ecosystems [13], and has been used as a key indicator of the coupling of ecosystem carbon and water cycles. However, the variability of WUE and its controlling factors in semi-arid regions are not well understood [12, 14].
A growing number of eddy covariance flux towers has provided continuous measurements of carbon, water, and energy exchange between ecosystems and the atmosphere. Data-driven (or machine learning) approaches have been developed to integrate flux tower data with remotely sensed data (e.g., the normalized difference vegetation index (NDVI), leaf area index (LAI)) and environmental variables (e.g., solar radiation, temperature) for quantifying terrestrial carbon fluxes at regional to global scales [15–17]. These methods aim to establish empirical relationships between carbon fluxes and explanatory variables through training based on abundant data, and the resulting predictive models are used to estimate carbon fluxes on a per-pixel basis at regional to global scales. The upscaling of FLUXNET measurements is effective for providing spatially and temporally gridded estimates of vegetation productivity and carbon fluxes [18]. Although the data-driven models do not explicitly incorporate biogeochemical processes, and thus differ from mechanistic models that are based on plant physiological responses and ecosystem processes, the upscaled flux estimates can reveal valuable information on the conditions under which plant productivity is strongly influenced. For example, previous upscaling studies examined the dynamics of carbon fluxes and responses to extreme events for the conterminous United States [19], the prairie regions of North America [20], and northern China [21, 22]. However, upscaled flux data have not been used to examine long-term trends in carbon and water fluxes in global semi-arid regions.
Here we used the FLUXNET2015 dataset and a data-driven upscaling approach to investigate the long-term trends of carbon and water fluxes of semi-arid ecosystems and their responses to climate change at the global scale. The recently available FLUXNET2015 dataset extended flux measurements to 2014 for a large number of sites and also improved data quality. These flux observations have a longer duration and can better capture the inter-annual variability and long-term trends in fluxes. We first used a data-driven approach along with flux observations from 79 FLUXNET sites, a new generation satellite-derived NDVI dataset—GIMMS NDVI3g, and meteorological data to generate gridded carbon flux and evapotranspiration (ET) estimates for the period from 1982 to 2015. We then analyzed the long-term trends of carbon fluxes, ET, and WUE for global semi-arid ecosystems and the impacts of climate change. Our study has implications for informing management of semi-arid ecosystems and understanding the carbon-climate feedbacks.
2. Materials and methods
2.1. Model inputs
We used flux and meteorological data from the tier-1 sites in the FLUXNET2015 database (https://fluxnet.fluxdata.org/data/fluxnet2015-dataset/). The dataset contains 212 sites, and 166 of these sites are tier-1 sites that are free and open for scientific analysis. These tier-1 sites are distributed across North America, Central and South America, Europe, Asia, Africa, and Australia and encompass a wide range of vegetation types and climate zones. Of the 79 sites in our study, 31 sites are forests, 7 are shrublands, 13 are savannas (SAV), and 19 are grasslands (GRA) (figure 1, table S1 is available online at stacks.iop.org/ERL/15/034022/mmedia). Forests include evergreen needleleaf forests, evergreen broadleaf forests, deciduous broadleaf forests, and mixed forests. Shrublands include both open and closed shrublands (OSH/CSH), and savannas consist of woody savannas and savannas (WSA/SAV). For each of these site-years, we aggregated the daily GPP, NEP, and ET data to 15-day intervals. We excluded the bi-weekly data if the percentage of gap-filled data was more than 20%. The resulting 15-day GPP, NEP, and ET data were then used for model development and accuracy assessment.

Figure 1. Global distribution of semi-arid ecosystems determined by the UNEP classification system [2] and flux tower sites used in this study. The colored gridded cells indicate semi-arid regions, and the vegetation types of these regions are identified from the MODIS land cover map (MCD12Q1, IGBP, 500 m).
Download figure:
Standard image High-resolution imageWe also used the GIMMS NDVI3g dataset (http://ecocast.arc.nasa.gov/data/pub/gimms/, Pinzon and Tucker [23]) from 1982 to 2015. The GIMMS NDVI3g dataset provides global NDVI maps with 15-day intervals and 1/12 degree spatial resolution, which is currently the longest NDVI dataset and is suitable for many long-term analyses [3, 24]. To minimize the effects of sensor changes among the NOAA satellites and orbital decay on the quality of the AVHRR data, calibration was performed using Bayesian methods and high quality, well-calibrated NDVI data from the sea-viewing wide field-of-view sensor (SeaWiFS). The GIMMS NDVI3g dataset has better quality and a much longer record than its predecessor, namely the GIMMS NDVI dataset (1981–2006).
We used gridded climate data from the MERRA-2 (modern era retrospective analysis for research and applications) [25] from NASA's global modeling and assimilation office (GMAO) (http://gtnao.gsfc.nasa.gov/research/merra/). MERRA was developed utilizing the Goddard earth observing system (GEOS) atmospheric model and data assimilation system (DAS) and makes use of conventional observations and satellite radiance data from both operational and research instruments. The conventional observations include measurements of standard atmospheric variables made by instrumentation on weather stations, balloons, aircraft, ships, buoys, and satellites. MERRA reduces the uncertainty in precipitation and inter-annual variability by improving the representation of the water cycle in reanalyses. The long-term MERRA-2 reanalysis dataset (1979–present) provides meteorological data with a spatial resolution of 0.5° × 0.625°. In this study, daily precipitation, temperature, and photosynthetically active radiation (PAR) data from MERRA for the period 1982–2015 were used. To match the spatial and temporal resolutions of the GIMMS NDVI3g dataset, the daily climate data were resampled to 8 km and then aggregated to a 15-day time step.
According to the MODIS land cover map (MCD12Q1, 500 m spatial resolution), we identified the five dominant vegetation types in the global semi-arid regions: forests (5.3%), shrublands (22.6%), savannas (15.3%), grasslands (33.6%), and croplands (21.1%) (figure 1). The percentage that each broad vegetation type accounted for the semi-arid region of each continent is summarized in table S2. Grasslands are the major land cover type in semi-arid regions of North America (51.9%), Asia (43.0%), Africa (29.3%), and Oceania (Australia) (23.1%).
2.2. Predictive models for GPP, NEP, and ET
In this study, we used a data-driven upscaling approach to estimate gross primary productivity (GPP), net ecosystem productivity (NEP), evapotranspiration (ET), and water use efficiency (WUE) for each grid cell at 8 km spatial resolution and bi-weekly time step for global semi-arid regions over the period 1982–2015. The upscaling models were established using a boosting-like regression-tree ensemble technique. This approach has been used to quantify terrestrial CO2 exchange at multiple spatio-temporal scales [16, 17, 20].
For each of the fluxes (GPP, NEP, and ET), we first developed a set of models with different input variables. The flux tower data were used for model training and validation, while remote sensing and climatic data sets were used as explanatory (or predictive) variables. We then identified the most important explanatory variables and determined their empirical relationships with each flux. For each flux, the final predictive model was composed of five committee models, and each committee model consisted of several rule-based models each of which assigned higher weights to the outliers of the previous model, which help generate smooth flux maps by encouraging variations in the regression stratification thresholds among models.
We used ten-fold cross-validation to evaluate the accuracy of the predictive model for each flux. Specifically, the flux data were partitioned into ten equally-sized subsamples; one subsample was retained for model validation, while the remaining nine subsamples were used to train the model; this process was then repeated nine times. We compared the model-estimated fluxes with the tower fluxes using the Pearson correlation coefficient (r) and root mean square error (RMSE). The models estimated the carbon and water fluxes fairly well, with r values of 0.89, 0.75, and 0.85 for GPP, NEP, and ET, respectively, and RMSE values of 1.13 g C m−2 d−1, 0.78 g C m−2 d−1, and 0.72 mm d−1 for GPP, NEP, and ET, respectively (figure 2).
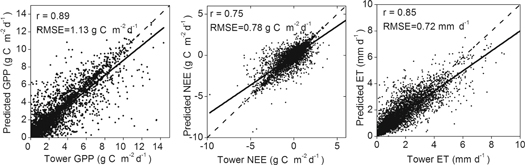
Figure 2. Cross-validation of GPP, NEE, and ET estimated using our data-driven upscaling approach (p < 0.001 for all cases). The solid line represents the regression line and the dashed line represents the 1:1 line.
Download figure:
Standard image High-resolution image2.3. Data analysis
We used the final predictive models to map GPP, NEP, and ET globally at 8 km spatial resolution and 15-day time step for semi-arid regions over the period 1982–2015. For each grid cell and each 15-day time step, the final prediction of a given flux was the average of the estimates from all committee models. We also calculated WUE (the ratio of GPP/ET) globally based on our GPP and ET estimates.
We aggregated the 15-day GPP, NEP, ET, and WUE estimates to the annual scales. We first calculated the spatial means of annul GPP, NEP, ET, and WUE by averaging the annual values of each variable across the study region (continents and biomes) for each year over the period 1982–2015. We then analyzed the magnitude and spatial patterns of annual GPP, NEP, ET, and WUE at the global scale and across different continents and vegetation types. For each grid cell, we also examined the long-term trends in GPP, NEP, ET, and WUE during the 34-year period with the linear regression method. For each variable, a positive slope (b > 0) indicates an increasing trend, while a negative slope (b < 0) indicates a decreasing trend. Finally, we assessed the effects of climate factors (precipitation, temperature, PAR) and atmospheric CO2 on GPP, NEP, ET, and WUE using correlation analyses.
3. Results
3.1. Carbon and water fluxes and their long-term trends
The global semi-arid annual GPP averaged over the period 1982–2015 was 628.6 ± 24.6 g C m−2 yr−1 (8.03 ± 0.31 Pg C yr−1) (table S3). The total GPP of the northern hemisphere accounted for 71.2% of the total GPP of global semi-arid ecosystems; the total productivity in the southern hemisphere was relatively low, although the forests in the semi-regions in the southern hemisphere showed high productivity on a per-unit-area basis (>1600 g C m−2 yr−1) (figure 3(a)). The long-term mean GPP was 569.02 g C m−2 yr−1 (equivalent to 6.21 Pg C yr−1) and 865.90 g C m−2 yr−1 (equivalent to 2.51 Pg C yr−1) in the northern and southern hemispheres, respectively (figure 4(a)). During the 34-year period, the annual NEP of semi-arid regions varied from –163.1 to 343.6 g C m−2 yr−1 globally (figure 3(b)). Higher NEP was mainly observed in the central and southern portions of North America and croplands in Russia. Central Africa and northern Australia were generally carbon neutral, and eastern Australia was a weak carbon source. The global semi-arid regions had a net carbon uptake (NEP) of 9.6 g C m−2 yr−1 (0.11 Pg C yr−1) (table S3). The annul NEP was –1.22 ± 11.8 g C m−2 yr−1 and 52.60 ± 10.24 g C m−2 yr−1 for the northern and southern hemispheres, respectively (figure 4(b)).
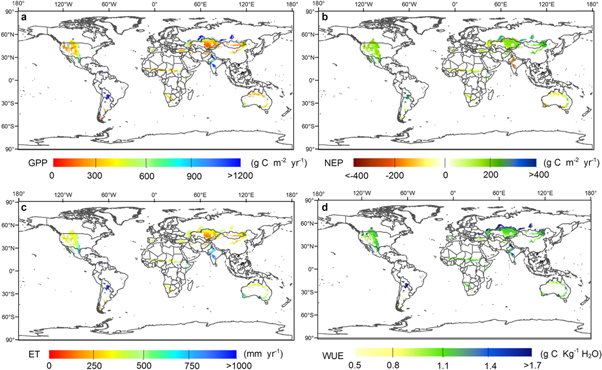
Figure 3. Annual (a) GPP, (b) NEP, (c) ET, and (d) WUE averaged over the period 1982–2015 for global semi-arid ecosystems. Positive sign for NEP denotes carbon uptake, and negative sign denotes carbon release.
Download figure:
Standard image High-resolution image
Figure 4. Trends of annual (a) GPP, (b) NEP, (c) ET, and (d) WUE in the semi-arid ecosystems of global, northern hemisphere (NH), and southern hemisphere (SH) during the period 1982–2015. Positive sign for NEP denotes net carbon uptake, and negative sign denotes net carbon release.
Download figure:
Standard image High-resolution imageDuring the 34-year period, annual ET varied from 110 to 1100 mm yr−1 (figure 3(c)). Generally, ET was higher in the areas with larger GPP. For example, the ET in the forests of central South America and croplands in India exceeded 1000 mm yr−1. The long-term mean annual ET of global semi-arid regions was 463.1 ± 10.5 mm yr−1 (5934.77 ± 134.4 km3 yr−1) (table S3). In the northern hemisphere, the ET was relatively high (about 800 mm yr−1) in the east of the Great Plains dominated by grasslands and relatively low (∼100–400 mm yr−1) in other regions, especially in central Asia (figure 3(c)). The annul ET was 440.1 mm yr−1 (equivalent to 4806.56 km3 yr−1) and 554.37 mm yr−1 (equivalent to 1609.16 km3 yr−1) for the northern and southern hemispheres, respectively (figure 4(c)). The long term mean annual WUE (annual GPP/annual ET) varied from 0.5 to 4 g C kg−1 H2O (figure 3(d)). The long term mean WUE of global semi-arid regions was 1.60 ± 0.02 g C kg−1 H2O (table S3). As with annual GPP and ET, the annual WUE was the highest in croplands of the northern hemisphere and subtropical forests in the southern hemisphere.
Annual GPP increased at the rate of 1.96 g C m−2 yr−1 (p < 0.001) (figure 4(a)), especially in Europe (slope = 2.80, p < 0.001), Oceania (Australia) (slope = 2.81, p < 0.001), and Asia (slope = 3.09, p < 0.001) (table S3). The GPP increased (p-value < 0.001) by 2.19 g C m−2 yr−1 and 1.06 g C m−2 yr−1 in the northern and southern hemispheres, respectively (figure 4(a)). The areas with significant increasing and decreasing GPP accounted for about 31.2% and 6.5% of the global semi-arid regions, respectively (figure 5(a)). In the northern hemisphere, the areas with significant increasing and decreasing GPP accounted for 30.9% and 5.9% of semi-arid regions, respectively (figure 5(a)). In the southern hemisphere, 16.7% and 12.0% of the semi-arid regions exhibited significant increasing and decreasing GPP, respectively (figure 5(a)). The annual NEP showed large variations with a significant increase of 0.78 g C m−2 yr−1 (p < 0.001) (figure 4(b)). The grid cells with significant increasing and decreasing trends in NEP accounted for 29.4% and 6.5% of the global semi-arid regions, respectively (figure 5(b)). The annul NEP increased by 0.82 and 0.65 g C m−2 yr−1 in the northern and southern hemispheres, respectively (figure 4(b)). In the northern hemisphere, 30.0% and 4.5% of the semi-arid regions had significant increasing and decreasing NEP, respectively; in the southern hemisphere, 17.9% and 10.9% of the semi-arid regions showed significant increasing and decreasing NEP, respectively (figure 5(b)).
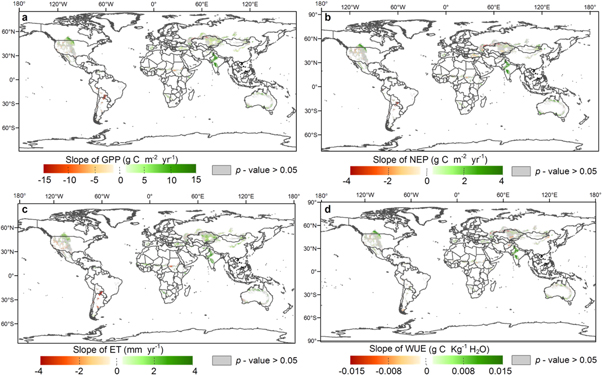
Figure 5. Spatial distributions of trends in annual (a) GPP, (b) NEP, (c) ET, and (d) WUE for global semi-arid regions during the period 1982–2015.
Download figure:
Standard image High-resolution imageOver the 34 years (1982–2015), the globally-averaged annual ET showed a significant increase at the rate of 0.75 mm yr−1 (figure 4(c)). The annul ET increased by 0.78 mm yr−1 (p-value < 0.001) and 0.62 mm yr−1 (p-value = 0.09) for the northern and southern hemispheres, respectively (figure 4(c)). The areas with significantly increasing ET accounted for 21.4% of global semi-arid regions that are mainly distributed in the Mongolia prairie, grasslands in Africa and North America, croplands in Russia, Kazakhstan, and northern China, while areas with significantly decreasing ET only accounted for 8.3% of global semi-arid regions, such as the south of North America and central South America (figure 5(c)). The globally-averaged annual WUE showed a significant increase in the same direction as GPP and ET (figure 4(d)). 21.8% and 6.8% of the global semi-arid regions showed significant increasing (e.g., croplands of North America and India) and decreasing (e.g., Asia) trends in WUE, respectively (figure 5(d)).
3.2. Carbon and water fluxes by continent and biome
Overall, South America had the highest carbon sink (NEP) (0.24 Pg C yr−1 or 274.4 g C m−2 yr−1), the second largest total GPP (1.43 Pg C yr−1, or 1625.9 g C m−2 yr−1), and the fourth largest total ET (710.0 km3 yr−1, or 809.6 mm yr−1) (figure 6). The total GPP and ET in South America accounted for 17.8% and 12.0% of the total GPP and ET of the global semi-arid ecosystems, respectively. North America had the second highest annual NEP (0.05 Pg C yr−1, or 27.2 g C m−2 yr−1) and the third highest annual GPP (1.08 Pg C yr−1, or 537.5 g C m−2 yr−1). The other four continents were weak carbon sources or were nearly carbon neutral. The mean annual WUE was 1.25, 1.15, 1.09, and 1.08 g C kg−1 H2O for Asia, Australia, Africa, and South America, respectively.
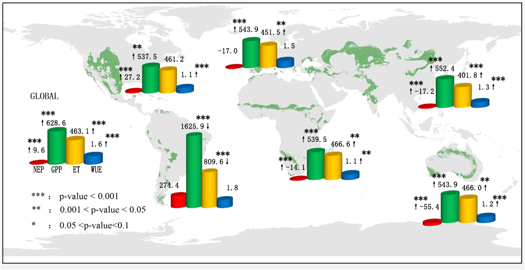
Figure 6. Annual GPP (g C m−2 yr−1), NEP (g C m−2 yr−1), ET (mm yr−1), WUE (g C kg−1 H2O) and their trends during the period 1982–2015 for the semi-arid ecosystems on six continents. The numbers stand for the annual fluxes and WUE averaged over the 34-year period. The symbols ***, **, and ** indicate that the trends of fluxes and WUE are statistically significant (*** denotes p-value < 0.001; ** denotes 0.001 < p-value < 0.05; * denotes 0.05 < p-value < 0.1).
Download figure:
Standard image High-resolution imageOver the 34-year period, the total annual GPP, NEP, and ET showed significant increases for Asia, Africa, and Australia; both GPP and ET significantly increased for Europe; both GPP and NEP had significant increases for North America; both GPP and ET exhibited decreases for South America (figure S1). The annual WUE significantly increased in North America, Asia, Africa, and Australia by 0.0019, 0.0023, 0.0012, and 0.002 g C kg−1 H2O (p < 0.001), respectively. In the croplands of northeastern North America and India, annual WUE increased at a slightly higher rate (>0.015 g C kg−1 H2O). In contrast, annual WUE showed decreasing trends in some areas of central Asia grasslands and northeastern China grasslands. Although the trend in WUE was not statistically significant in most areas, the globally-averaged annual WUE significantly increased (0.0018 g C kg−1 H2O) (figure 4).
Among the five land vegetation types, the forests had the highest annual GPP (1670.34 ± 22.62 g C m−2 yr−1, or 1.72 Pg C yr−1) which accounted for 21.4% of global semi-arid GPP (figure 7). Forests also had the highest carbon sink (271.61 g C m−2 yr−1 or 0.28 Pg C yr−1). The GPP and NEP of forests showed insignificant trends over the 34-year period (figure S2). The savannas had the second highest annual GPP (964.4 g C m−2 yr−1) which accounted for 10.1% of global semi-arid GPP (figure 7). The NEP, GPP, and ET of savannas all significantly increased (figure S2). Croplands had intermediate GPP and ET (figure 7). The NEP, GPP, and ET of croplands all significantly increased (figure S2). The annual mean GPP of shrublands was 0.30 Pg C yr−1 (or 512.18 g C m−2 yr−1) and only accounted for 3.7% of the total annual GPP of the global semi-arid areas (figure 7). The shrublands were weak carbon sinks (40.46 g C m−2 yr−1, equivalent to 0.02 Pg C yr−1). Both NEP and GPP of shrublands significantly increased (figure S2). Among the five land vegetation types, grasslands had the lowest annual GPP (360.39 ± 11.67 g C m−2 yr−1) on a per-unit-area basis, while the total annual GPP of grasslands (∼2.31 Pg C yr−1) accounted for 28.8% of the global semi-arid GPP (figure 7). The GPP, NEP, and ET of grasslands increased by 0.78 g C m−2 yr−1, 0.30 g C m−2 yr−1, and 0.78 mm yr−1, respectively (figure S2). The grasslands were nearly carbon neutral with a mean annual NEP of –5.51 g C m−2 yr−1 (equivalent to –0.04 Pg C yr−1). The grasslands area accounted for 59.9% of the semi-arid area in the Great Plains (US and Canada), 23.1% in Australia, 66.5% in Central Asia, and 43.0% in Central Africa and were weak carbon sinks (Central Asia, Great Plains, Central Africa) or sources (Australia) (figure S3).

Figure 7. Box plot of annual GPP, NEP, ET and WUE for forests, shrublands, savannas, grasslands, and croplands in global semi-arid ecosystems and six continents during the period 1982–2015.
Download figure:
Standard image High-resolution imageThe WUE differed among vegetation types in the semi-arid regions (figure 7). On average, forests had the highest annual WUE (2.39 g C kg−1 H2O), followed by savannas (1.50 g C kg−1 H2O), croplands (1.33 g C kg−1 H2O), and shrublands (1.13 g C kg−1 H2O); grasslands had the lowest WUE (0.95 g C kg−1 H2O). The WUE of shrublands, savannas, grasslands, and croplands significantly increased (figure S2). In the four typical grassland regions (i.e., Great Plains, Australia, Central Asia, and Central Africa), the WUE was relatively stable (figure S3) because both GPP and ET significantly increased. The WUE significantly increased for Australian grasslands.
3.3. Climate impacts on carbon and water fluxes
The influences of climate factors on carbon and water fluxes varied among regions (figure 8). Overall, precipitation had positive influences on GPP, NEP and WUE, but had a negative influence on ET. Temperature and PAR mainly had positive influences on NEP, but mainly negative influences on GPP, ET and WUE. The influences of PAR on GPP and ET showed similar spatial patterns.
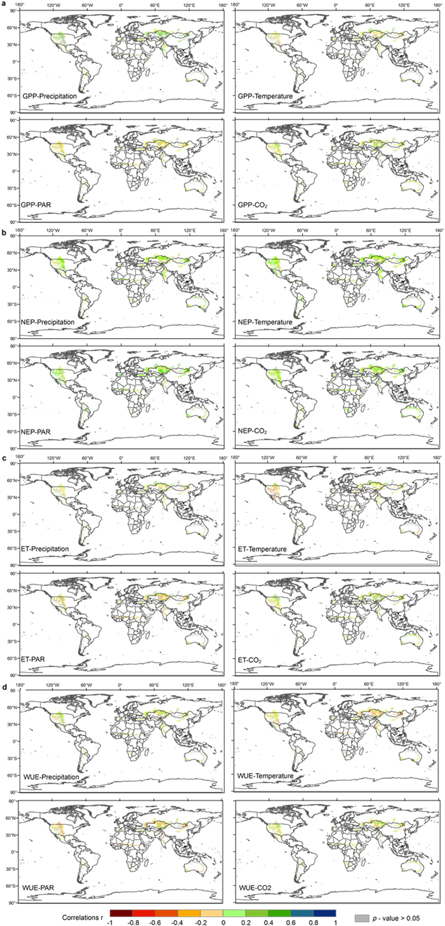
Figure 8. Spatial distributions of correlation coefficient (r) between annual (a) GPP, (b) NEP, (c) ET and (d) WUE and environmental factors: precipitation, temperature, PAR, and atmospheric CO2 for global semi-arid regions.
Download figure:
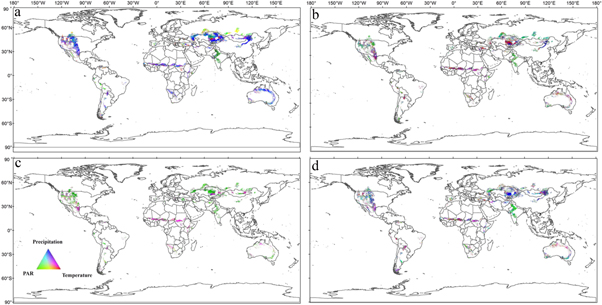
Standard image High-resolution imageWe further examined the integrated effects of three climate variables on GPP, NEP, ET, and WUE across the global semi-arid regions (figure 9). Precipitation was the most important variable influencing GPP (figure 9(a), table 1). About 50.2% of the semi-arid region was significantly influenced by precipitation, and precipitation alone affected 16.4% of the region. The semi-arid regions in Australia, and most grasslands in Africa, China, Mongolia and Kazakhstan, were significantly affected by precipitation. PAR was the second most important factor affecting GPP. About 38.0% of the semi-arid region was significantly influenced by PAR, and PAR alone affected 9.6% of the region. The PAR-influenced regions were mainly distributed in parts of South America (forested areas between 0° and 30 °S) and western and central Asia (especially in India dominated by cropland), and the influence of PAR on GPP was mainly negative (figure 8(a)). Temperature affected GPP for 33.4 % of the global semi-arid regions, while temperature alone affected only 5.7% of the regions. Temperature mainly positively influenced GPP in croplands and forests of Russia and the western portions of Asia and Europe. The combined effects of precipitation and temperature, precipitation and PAR, temperature and PAR, and the three factors together accounted for 8.9%, 9.8%, 3.6%, and 15.2% of the semi-arid regions, respectively. The combined influence of temperature and PAR was prominent in the north of Asia, while the combined influence of precipitation and temperature was prominent in most regions of Australia. In North America, eastern Europe and central Africa, the combined influence of the three factors was relatively complex likely due to the diversity of vegetation types. In general, besides precipitation, GPP in the northern hemisphere was more affected by PAR, while GPP in the southern hemisphere was more affected by temperature.
Figure 9. Integrated influence of climate factors (i.e., temperature, PAR, and precipitation) on (a) GPP, (b) NEP, (c) ET, and (d) WUE. The grey areas indicated that none of the three climate factors had significant effects (p-value > 0.05).
Download figure:
Standard image High-resolution image
Table 1. Correlation coefficients (r) for the relationships of annual GPP, NEP, ET, and WUE with climatic factors for semi-arid regions of six continents during the period 1982–2015.
| Region | GPP | ET | NEP | WUE | ||||||||||||
|---|---|---|---|---|---|---|---|---|---|---|---|---|---|---|---|---|
| Precipitation | Temperature | PAR | CO2 | Precipitation | Temperature | PAR | CO2 | Precipitation | Temperature | PAR | CO2 | Precipitation | Temperature | PAR | CO2 | |
| North America | 0.46** | 0.29 | −0.10 | 0.40* | 0.14 | 0.32 | 0.16 | 0.67*** | 0.71*** | −0.04 | −0.25 | 0.02 | 0.11 | 0.43 | 0.10 | 0.72*** |
| Europe | 0.13 | 0.29 | 0.33 | 0.60** | 0.00 | 0.06 | 0.37* | 0.09 | 0.46** | 0.23 | 0.18 | 0.33 | 0.18 | 0.20 | 0.19 | 0.24 |
| Asia | 0.44** | 0.21 | 0.15 | 0.82** | 0.20 | 0.04 | 0.29 | 0.68*** | 0.60*** | 0.23 | 0.07 | 0.77*** | 0.21 | 0.06 | 0.19 | 0.67*** |
| South America | 0.19 | −0.08 | 0.23 | −0.57** | 0.23 | −0.12 | 0.39* | −0.30 | 0.17 | 0.03 | 0.33 | −0.56** | −0.14 | −0.007 | −0.10 | −0.03 |
| Africa | 0.69** | −0.18 | −.506** | 0.58** | 0.55** | −0.18 | −0.22 | 0.53** | 0.75*** | −0.25 | −0.47** | 0.50** | 0.57*** | −0.25 | −0.48** | 0.43** |
| Oceania (Australia) | 0.79** | −0.46** | −0.64** | 0.47** | 0.58*** | −0.28 | −0.42* | 0.74*** | 0.86*** | −0.61*** | −0.65*** | 0.41* | 0.23 | −0.06 | −0.23 | 0.65*** |
Note: *** p-value < 0.001; ** 0.001 < p-value < 0.05; * 0.05 < p-value < 0.1.
Overall, the three climate factors had almost equally important effects on NEP (figures 8(b), 9(b), table 1). Precipitation, temperature, and PAR affected 28.5%, 27.7%, and 25.8% of the semi-arid regions, respectively. Both each factor alone and the three factors combined together affected about 10% of the global semi-arid regions. In India, Russia, most areas of North America, and southern Australia, PAR alone had a significant impact on NEP by affecting 10.6% of these regions. PAR and temperature had positive effects on NEP in most regions and negative effects in the eastern part of North America and the grasslands of northern Kazakhstan. In the grasslands of northern China, precipitation had strong independent positive influence, while in the grasslands of Kazakhstan, the independent influence of temperature and precipitation was dominant. In the Great Plains, the forested areas in central South America, and the northern parts of Australia, the combination of temperature and precipitation affected NEP for 7.7% of these regions.
PAR was the most important variable influencing ET (figures 8(c), 9(c), table 1). 44.6% of the global semi-arid regions was significantly influenced by PAR; PAR alone affected 23.2% of the regions. ET was significantly affected by PAR alone in most semi-arid regions in Asia and Europe (table 1), most grasslands in North America, eastern Australia, and most forests of South America. The combined influence of temperature and precipitation was also important and affected 12.6% of the global semi-arid regions such as forests of central South America and parts of grasslands in Mongolia, Kazakhstan, Africa, and North America. The combined effect of temperature, precipitation and PAR on ET accounted for 21.3% of the global semi-arid regions.
Overall, precipitation had the largest impact on WUE (figures 8(d), 9(d), table 1). 40.9% of the global semi-arid regions was positively influenced by precipitation, and precipitation alone affected 12.7% of the regions mainly including grasslands of Kazakhstan and North America. The influence of PAR and temperature alone accounted for about 30.2% and 27.5% of the global semi-arid regions, respectively, and the effects were mainly negative. In India and western Russia, PAR alone had a significant effect on WUE. In the central portions of South America and Africa, the combined influence of temperature and precipitation was prominent. The combined influence of precipitation and temperature was mainly distributed in the north of Australia, while the combined influence of PAR and precipitation was mainly observed in the south of Australia. The combined influence of precipitation and temperature, precipitation and PAR, temperature and PAR and the three factors together accounted for 7.7%, 8.1%, 2.3%, and 10.6% of the global semi-arid regions, respectively (figure 9(d)).
Atmospheric CO2 had mainly positive effects on carbon fluxes and WUE, especially on NEP (figure 8, table 1). The negative effects of CO2 on GPP and ET were mainly observed in South America and some areas of central and southern North America, western edge of Asia, and central Africa. The influence of PAR and CO2 on ET was generally consistent with that of temperature. Atmospheric CO2 had negative effects on WUE in some parts of central Asia (figure 8(d)).
4. Discussion
Overall, the climate conditions during the period 1982–2015 was conducive to photosynthesis and net carbon uptake in global semi-arid regions. The global semi-arid regions overall exhibited increasing trends in GPP over the 34-year period. The increasing GPP in Europe and Asia (especially India), southern Africa, central North America, and some areas of Australia, was consistent with the increasing trend in satellite-based vegetation greenness [26]. Previous studies also showed that GPP increased in Asia [27] and Africa [28]. However, in other parts of semi-arid Africa, such as the Sub-Saharan Africa, GPP decreased likely due to reduced rainfall, changed species composition [29], and human disturbance [28]. South America was the only continent with declined GPP, which was likely to be related to the widespread drought events [30] or increased vapor pressure deficit (VPD) [31].
The net carbon uptake (NEP) of global semi-arid regions (0.11 ± 0.14 Pg C yr−1) was much lower than that of highly productive forest ecosystems (2.4 ± 0.4 Pg C yr−1) [32]. However, the annual NEP of global semi-arid regions showed a significant increase, suggesting that the carbon sink capacity of semi-arid regions had been increasing over the 34-year period. Increases in NEP were mainly found in croplands of India and China, most areas of savannas and shrublands in North America, some grasslands and shrublands of Australia and forests of Russia. A previous study showed that the increased above-ground biomass carbon associated with wetter conditions in the savannas of northern Australia and southern Africa reversed global above-ground biomass carbon loss and led to an overall global biomass gain [13]. The semi-arid ecosystems in the southern hemisphere particularly ecosystems in Australia played an important role in controlling the global carbon sink anomaly [6, 7]. The Australian semi-arid ecosystems exhibited increased carbon uptake due to both asymmetry in the inter-annual distribution of rainfall (extrinsic forcing), and asymmetry in the response of GPP to rainfall change (intrinsic response) [6]. Over the period of 1982–2015, all the vegetation types except forests showed significant increases in GPP, NEP, ET, and WUE.
Similar to GPP, ET significantly increased in all the continents except South America. A previous study [15] showed that the global ET increased by 7.1 ± 1.0 mm yr−1 during the period 1982–1997 and did not increase any more since then till 2008 mainly due to the moisture limits in the southern hemisphere (especially in Africa and Australia). Our study also showed similar behavior in ET in the southern hemisphere: ET increased before 1998 (slope = 1.02 mm yr−1, p-value = 0.49) but stabilized during the period 1999–2008 (p-value = 0.18).
Savannas support one fifth of the world's human population and are one of the most important ecosystems [33]. Savannas contributed 17% of global average above-ground biomass carbon over the period 1998–2002 [13]. Our results showed that savannas accounted for 10.1% of global semi-arid GPP, and had significant increases in NEP, GPP, and ET. If savannas were to be protected from fire and grazing, most of them would accumulate substantial carbon and the sink would be larger [34, 35]. Quantifying the magnitude of savanna GPP is essential for understanding ecosystem responses to increasing atmospheric CO2 concentrations and climate change [36].
The carbon uptake of semi-arid ecosystems is affected by climate in a complex way. In general, GPP was most sensitive to and positively correlated with precipitation in semi-arid regions. The key environmental drivers controlling vegetation productivity included water and nutrient availability, VPD, solar radiation, and fire [37]. Our results showed that the GPP of Australian savannas significantly increased and Australia was the only continent that GPP was significantly impacted by all climate factors. Similar to China's ecosystems, the annual carbon and water fluxes were mainly driven by annual temperature, precipitation, and growing season length [38]. Enhanced precipitation variability decreased and increased GPP for grasslands and shrublands, respectively, and their different responses to precipitation were likely due to the contrasting root distributions of grasses and shrubs and competitive interactions among plant types [39]. In addition, precipitation variability had a negative effect on above-ground net primary production of global drylands, but the effect of precipitation varied from positive to negative along a precipitation gradient [40].
The future climate will likely induce large but contrasting ecosystem responses that differ among biomes and are independent of changes in mean precipitation alone [6]. In North America, grassland productivity was projected to increase under future climate scenarios despite rising aridity [41]. In a semi-arid savanna ecosystem in West Africa, the carbon budget was strongly affected by water availability and rainfall distribution, and GPP was negatively affected by temperature [42]. In the Australian savannas, however, GPP was not strongly correlated with precipitation, likely because rainfall influenced savanna vegetation structure, composition and function on plant successional timescales which in turn altered biophysical factors regulating the productivity of savannas [36].
The increased carbon sink of semi-arid regions may also be attributed to higher concentrations of atmospheric CO2 [43]. Elevated CO2 may increase productivity in semi-arid regions by increasing plant water use efficiency [44–46]. Our results showed that the increasing atmospheric CO2 was positively correlated with GPP and NEP globally, especially in Asia and Australia. The increases in atmospheric CO2 enhanced dryland vegetation greenness [26] and WUE [47]. The direct CO2 effect on vegetation was more evident in warm, arid environments where water was the dominant limiting factor to vegetation growth [47]. The elevated CO2 effect mainly depended upon the balance between summer and autumn/spring rainfall, and therefore the seasonal rainfall determined grassland biomass response to carbon dioxide [48].
In addition to the climate factors, other factors such as land use changes, management practices, and changes in species composition could also affect the productivity in semi-arid regions [43]. For example, large-scale semi-arid afforestation can enhance precipitation and carbon sequestration potential through enhanced ET, surface cooling and modification of the latitudinal temperature gradient [49]. Furthermore, alteration of NPP can be expected in the future as plant species respond to climate change through range shifts or local population dynamics [50], altered plant functional types [51], prolonged drought [21, 22, 51], and thus widespread altered hydroclimatic conditions [52].
Similar to globally-averaged GPP and ET, globally-averaged WUE significantly increased. The strong relationships between annual GPP and ET demonstrated the close coupling of the carbon and water cycles. The WUE in South America and Europe was almost stable, implying that the change rate of GPP was similar to that of ET. As with other terrestrial ecosystems [38], semi-arid ecosystems had varying WUE with vegetation type. The WUE of the semi-arid forest (2.39 g C Kg−1 H2O) fell within the range of WUE for the forest ecosystems in eastern China (1.88∼2.55 g C Kg−1 H2O) [53]. The semi-arid ecosystems are sensitive to climate change and drought. The WUE variability in semi-arid ecosystems was primarily controlled by precipitation [13, 54]; the increase in precipitation often induced a larger increase in NPP than in ET, leading to an increase in annual WUE [13]. Besides, physical processes (i.e., evaporation), biological processes (i.e., assimilation), and soil water content may regulate WUE variability [14, 55]. Our results showed that WUE was relatively stable in the three grassland regions: Great Plains, Central Asia, and Central Africa with the increase in both GPP and ET. Garbulsky et al [56] showed that the annual functioning of vegetation was more constrained by water availability than by temperature and the spatial variability of annual rain use efficiency could be largely explained by annual precipitation. Contrasting to WUE of arid ecosystems, WUE in semi-arid regions was mostly regulated by biological processes (i.e., carbon assimilation) and decreased with drought [14]. Future drought events coupled with an increase in climate variability, will bring further threats to semi-arid ecosystems and potentially result in biome reorganization, especially in low-productivity and high water-sensitivity grasslands [14]. In addition, the responses of rainfall use efficiency to drought is complicated due to the legacy effect of precipitation changes in both wet and dry years and the resilience of the biomes in the dry years [21, 22].
Although the data-driven (or machine learning) upscaling model can simply and effectively estimate carbon dynamics over time and space, this approach has several sources of uncertainty and limitations. First, the distribution and the number of sites can affect the accuracy of the resulting gridded flux estimates. Papale et al[57] explored the effects of spatial sample selection for carbon flux estimation and demonstrated that the distribution and number of sites had significant influences on the uncertainty of regional GPP estimation and its inter-annual variability. The climate and ecosystem representativeness of sites can also influence the accuracy of the gridded flux estimates [19, 58, 59]. Second, the errors or uncertainty of satellite data and other explanatory variables (e.g., GIMMS3g, MERRA) could propagate through the upscaling and lead to uncertainty in the gridded flux estimates [60]. Third, it remains a challenge to explicitly incorporate management and disturbance information into the model and to consider the legacy effects [18]. Fourth, like other methods (e.g., process-based modeling), the data-driven approach faces the challenge of fully quantifying the uncertainty of the regional or global flux estimates. Finally, future efforts are needed to improve the capability of the data-driven approach in capturing the inter-annual variability of carbon and water fluxes.
5. Conclusions
We used a data-driven (or machine learning) upscaling approach along with FLUXNET observations, GIMMS NDVI3g, and meteorological data to estimate carbon and water fluxes on a per-pixel basis for the global semi-arid regions over the period 1982–2015. The resulting gridded flux estimates were then used to examine the long-term trends of carbon and water fluxes (GPP, NEP, and ET) as well as the WUE of global semi-arid ecosystems and their responses to climate. The climate conditions during the study period 1982–2015 was conducive to gross and net carbon uptake in global semi-arid regions. Spatially-averaged GPP, NEP, ET, and WUE showed significant increases for the globe, almost all the continents except South America, and all the biomes except forests. Australia was the 'hot spot' regarding significant changes in carbon and water fluxes and their sensitivity to climate factors. Precipitation was the main controlling factor for carbon and water fluxes and promoted the net carbon uptake. The integrated influence of the three climate factors (precipitation, temperature, PAR) on GPP, NEP, ET, and WUE accounted for 15.2%, 7.1%, 21.3% and 10.6% of the semi-arid regions, respectively. Similar to GPP and ET, annual WUE showed significant increases. The areas with significant increases in WUE accounted for 21.8% of the global semi-arid regions. The WUE in the 40.9% of the semi-arid region was positively influenced by precipitation. Atmospheric CO2 had mainly positive effects on WUE and positive effects on GPP, NEP, and ET. In most of the semi-arid ecosystems, vegetation productivity increased together with water use efficiency. Our results can improve our understanding of the magnitude and long-term trends of carbon and water fluxes over global semi-arid regions and have implications for ecosystem management and climate policy making in semi-arid regions.
Acknowledgments
The study was supported by the National Natural Science Foundation of China (Grant No. 41771392) and the Strategic Priority Research Program of the Chinese Academy of Sciences (Grant No. XDA19030302). We are grateful for the work done to provide Fluxnet2015 datasets and the flux tower investigators. This work used eddy covariance data acquired and shared by the FLUXNET community, including the networks: AmeriFlux, AfriFlux, AsiaFlux, CarboAfrica, CarboEuropeIP, CarboItaly, CarboMont, ChinaFlux, Fluxnet-Canada, GreenGrass, ICOS, KoFlux, LBA, NECC, OzFlux-TERN, TCOS-Siberia, and USCCC. The ERA-Interim reanalysis data are provided by ECMWF and processed by LSCE. The FLUXNET eddy covariance data processing and harmonization was carried out by the European Fluxes Database Cluster, AmeriFlux Management Project, and Fluxdata project of FLUXNET, with the support of CDIAC and ICOS Ecosystem Thematic Center, and the OzFlux, ChinaFlux and AsiaFlux offices. We thank the anonymous reviewers for their constructive comments on the manuscript.
Data availability statements
The data that support the findings of this study are available from the corresponding author upon reasonable request.