

Abstract
The time taken for ecosystems to recover from drought (drought recovery time) is critically important for the ecosystem state. However, recent literature presents contradictory conclusions on this feature: one study concludes that drought recovery time in the tropics and high northern latitudes is shortest (<4 months) but another concludes that it is longest (>12 months) in these regions. Here we explore the reasons for these contradictory results and revisit assessments of drought recovery time. We find that the study period, drought identification method and recovery level definition are main factors contributing to the contradictory conclusions. Further, we emphasize that including droughts that did not decrease ecosystem production or using a period of abnormal water availability to define ecosystem recovery level can strongly bias drought recovery time estimates. Based on our refined methods, we find the drought recovery time is also longest in some tropical regions but not in high northern latitudes during 1901–2010. Our study helps to resolve the recent controversy and provides insight for future drought recovery assessments.
Export citation and abstract BibTeX RIS

Original content from this work may be used under the terms of the Creative Commons Attribution 3.0 licence. Any further distribution of this work must maintain attribution to the author(s) and the title of the work, journal citation and DOI.
1. Introduction
Drought recovery time is particularly important for ecosystem resilience and stability (Lenton et al 2008). If the frequency of droughts increases, areas with long drought recovery time are more likely to suffer a new drought event before full recovery, and thus could experience plant mortality and transition to a new state (Luo et al 2015). As terrestrial ecosystems offset about one quarter of anthropogenic carbon dioxide emissions globally (Le Quere et al 2018), a better understanding of the areas that are vulnerable to droughts can help to manage future climate change risks (Seneviratne and Ciais 2017).
Recent studies have begun to investigate drought recovery time globally (Schwalm et al 2017, Yu et al 2017). However, they came to contradictory conclusions about the spatial pattern and length of drought recovery time. Specifically, Yu et al (2017) (hereafter referred to as Y17) report drought recovery time to be shortest in the tropics and high northern latitudes. In contrast, Schwalm et al (2017) (hereafter referred to as S17) found an opposing pattern with the longest recovery times in these regions. Moreover, drought recovery time is less than 4 months across most land areas in Y17, but longer than 12 months across considerable land areas in S17. These contradictory results may be linked to differences in methods and data used in Y17 and S17. However, the specific reasons causing the differences in reality remain unknown and it is also unclear which conclusion is more reliable.
Several steps in drought recovery time estimation are prone to methodological uncertainties. On the one hand, there are different ways to define the (drought) recovery level, i.e. the level of ecosystem production used to determine the end of drought recovery. One way to determine recovery level is the averaged ecosystem production in a pre-drought period. However, the length of the pre-drought period is often determined subjectively and varies largely across studies (Gazol et al 2017, Schwalm et al 2017, He et al 2018). In addition, previous global-scale studies only used a single metric to identify drought events, and almost all identified drought events are used to assess drought recovery. However, even if the drought event identified by a drought index is a statistical climate extreme, it may not induce an ecosystem response (Reichstein et al 2013, Stocker et al 2018).
In this study, we aim to (1) explore reasons for these contradictory results, and (2) revisit current methods to assess drought recovery, using multiple global gross primary production (GPP) datasets and drought indices. We further provide a summary of the advantages and limitations of the different applied methods as well as recommendations for future drought recovery assessments.
2. Data and methods
2.1. GPP
Model-based monthly GPP is obtained from the Multiscale Synthesis and Terrestrial Model Intercomparison Project (MsTMIP) version 1, spanning the years from 1901 to 2010, with a 0.5° spatial resolution (Huntzinger et al 2013). We use data from the BG1 simulation, which includes time-varying nitrogen deposition, atmospheric CO2, and land use history. The ensemble mean of five models is used (table S1 is available online at stacks.iop.org/ERL/14/114028/mmedia); all models follow the same simulation protocol.
Satellite-based monthly and 8 d MODIS GPP is obtained from the University of Montana, spanning the years from 2000 to 2011, with a 1 km spatial resolution (bilinearlly resampled to 0.5° for this study). This data set was calculated using the MOD17 GPP algorithm based on the fraction of absorbed photosynthetically active radiation, leaf areas index and climate data from NCEP/NCAR Reanalysis 2 (Running et al 2004, Zhao and Running 2010).
Flux-tower-based monthly upscaled GPP is obtained from the Max Planck Institute for Biogeochemistry, spanning the years from 1982 to 2008, with a 0.5° spatial resolution. The flux tower data are upscaled to global scale using machine leaning and model tree ensembles accompanied with satellite indices, climate data and land use data (Jung et al 2011).
2.2. Drought indices
The standardized precipitation evapotranspiration index (SPEI) is a multi-scale drought metric, calculated from precipitation and potential evapotranspiration (PET) data. Monthly SPEI is obtained from the digital Institutional Repository of the Spanish National Research Council (Vicente-Serrano et al 2010, Begueria et al 2014).
The drought severity index (DSI) is calculated using 8 d normalized difference vegetation index and actual evapotranspiration and PET from MODIS. The DSI data is obtained from the University of Montana (Mu et al 2013).
2.3. Drought recovery analysis
Considering the climate change risks, we focus on the negative impacts of droughts on ecosystem production. Generally, ecosystem production declines during drought, and subsequently rises to the recovery level after the termination of the drought event. Drought recovery analysis is often carried out as follows:
- 1.A drought index is used to identify drought events and the associated start and end time of drought;
- 2.The recovery level is defined as ecosystem production in a specific period;
- 3.Drought recovery time is estimated starting from the drought ending time until post-drought ecosystem production returns to the recovery level.
Additionally, factors such as the study period and ecosystem production data set also need to be determined.
The methodological choices in the steps outlined above imply a large number of degrees of freedom in drought recovery assessments. For instance, both Y17 and S17 follow these steps but differ in specific methodological choices, including, for example, drought identification (DSI versus SPEI) and recovery level definition (averaged GPP in a non-drought period versus averaged GPP in a pre-drought period) (see table S2).
To systematically isolate the impact of each methodological choice on drought recovery time, we test the sensitivity of drought recovery time to these choices with several experiments (table 1, ExpY17, ExpS17, Exp1–6). For each factor, there are two experiments where the only difference in the experimental design is the given factor. As an example, the comparison of Exp2 with ExpS17 can isolate the impacts of the study period on drought recovery time. Following Schwalm et al (2017), the average estimates from four SPEI time scales (1, 6, 12 and 24 month SPEI) are mainly used here.
Table 1. Experiments used to test the sensitivity of drought recovery time to each factor.
| Time period | Drought identification | Recovery level | GPP data set | GPP processing method | |
|---|---|---|---|---|---|
| ExpY17 | 2000–2011, growing season | 8 d DSI | Non-drought | 8 d MODIS GPP | Standardized |
| ExpS17 | 1901–2010 | Monthly SPEI | Pre-drought | Monthly 3 types of GPP | Detrended |
| Exp1 | 2000–2010 | 8 d DSI | Non-drought | 8 d MODIS GPP | Standardized |
| Exp2 | 2000–2010 | Monthly SPEI | Pre-drought | Monthly 3 types of GPP | Detrended |
| Exp3 | 2000–2010 | 8 d DSI | Non-drought | 8 d MODIS GPP | Detrended |
| Exp4 | 2000–2010 | 8 d DSI | Pre-drought | 8 d MODIS GPP | Detrended |
| Exp5 | 2000–2010 | Monthly DSI | Pre-drought | Monthly MODIS GPP | Detrended |
| Exp6 | 2000–2010 | Monthly SPEI | Pre-drought | Monthly MODIS GPP | Detrended |
Note. Exp1 versus ExpY17 and Exp2 versus ExpS17 (Time period); Exp1 versus Exp3 (GPP processing method).Exp2 versus Exp6 (GPP data set); Exp3 versus Exp4 (Recovery level); Exp5 versus Exp6 (Drought identification).
3. Sensitivity of drought recovery time to methodological choices
Drought recovery time derived from recovery levels based on non-drought period versus pre-drought period are largely different (figures 1(a) and (b)). Non-drought based recovery level is the averaged GPP in the periods exclude drought conditions while pre-drought based recovery level is the averaged GPP in a number of months before the start of drought. The number of pre-drought months is the same as the drought duration. Specifically, drought recovery time from non-drought based recovery level is much longer than that from pre-drought based recovery level in East Brazil, Southern Africa, Australia, but shorter in some tropical and northern high latitude regions. This is because the much lower pre-drought recovery level would largely shorten the recovery time, as illustrated in an example grid cell in Southern Africa (figure S1). It is also interesting to investigate the reasons for the large differences in recovery level values. We found it could be explained by two factors: (1) the differences in water availability in pre-drought versus non-drought period; (2) the correlation between water availability (indicated by DSI) and GPP. For instance, in the tropics and some northern high-latitude regions, combining the negative correlation between DSI and GPP (figure S2(a)) and the negative or positive DSI values (i.e. dryness or wetness) in pre-drought or non-drought period (figures S2(b) and (c)), pre-drought recovery level would be positive and high, but non-drought based recovery level would be negative and low (figures S1(b) and (c)).

Figure 1. Spatial pattern of drought recovery time from (a) non-drought and (b) pre-drought based recovery level (Exp3 and Exp4); (c) DSI based and (d) SPEI based drought identification (Exp5 and Exp6) during 2000–2010. Details of experiments are listed in table 1. Regions with sparse vegetation and regions that did not experience any relevant drought events were masked in white.
Download figure:
Standard image High-resolution imageThe choice of different drought identification methods (DSI versus SPEI) also induce differences in drought recovery time in several regions (figures 1(c) and (d)), such as Canada, Eastern Europe and Central Australia. This may be related to the differences in the correlations with GPP, identified drought events and associated different pre-drought recovery levels (figure S3). Using more extreme thresholds for drought identification (i.e. DSI < −1.5 and SPEI < −2) cannot resolve the differences in drought recovery time estimates (figure S4). The drought recovery time estimates could be also impacted by the difference in drought type, which may not be captured by SPEI and DSI (e.g. other aspects of meteorological (McKee et al 1993), agricultural (Wells et al 2004), or hydrological droughts (Tallaksen and Van Lanen 2004)). Furthermore, the parameters of the drought indices may have significant effects. For example, SPEI with a short time scale is likely to reflect other mechanisms than SPEI with a long time scale (Geyaert et al 2018, M. Zhao et al 2017), and consequently the drought recovery time estimated from SPEI at short and long time scales are different (figure S5). Besides, satellite-based drought indices, like DSI, are inevitably limited by the short-term satellite records. As a consequence, DSI may underestimate some very extreme events, such as the 2000s millennium Australia drought, in the context of long-term climatology, which will also impact drought recovery time estimates.
Large differences in the time period (2000–2010 versus 1901–2010) can also impact the derived drought recovery time, because the spatial pattern changed a lot over time (figures S6(c) and S17). Differences in GPP data sets and GPP processing methods have little impacts on drought recovery time, because the spatial pattern and length of drought recovery time derived from different GPP processing methods and three GPP data sets or one MODIS GPP are very similar across most regions (figure S6). Overall, the drought identification, recovery level definition and study period are found to be the main factors contributing to the reported differences in drought recovery time estimates.
4. Revisiting current drought recovery assessment methods
In the previous section, we showed how different methodological choices influence drought recovery time. Is there room for improvements in current methods? In particular, we focus on the two steps with large uncertainties: the drought identification and the recovery level definition. Another reason we focus on these two factors is that the choice of study period is highly dependent on different research objectives.
4.1. Drought identification
To characterize ecosystem recovery from drought, it is necessary to identify drought events that actually decrease ecosystem productivity. Drought indices are a simple way to identify drought events and are widely used in assessing drought impacts on ecosystem production (Vicente-Serrano et al 2013, Ma et al 2015, Huang et al 2016, Liu et al 2018a, 2018b). Climate-based drought indices, such as the Standardized Precipitation index (SPI) and SPEI, are easy to calculate, as they only need climate data as input and can be used for long-term drought recovery analysis. Satellite-based drought indices, such as the Vegetation Health Index and DSI, have a higher spatial resolution and often include information from vegetation greenness (Kogan 1997, Mu et al 2013).
However, drought indices are not always tightly correlated with ecosystem production. Drought events identified by the drought index are usually just statistical extremes and do not necessarily decrease ecosystem production (Reichstein et al 2013). If these events that do not decrease ecosystem production are included in the analysis (as done in some previous studies), this would bias the estimate of the drought recovery time. Furthermore, only including drought events that decrease ecosystem production to estimate drought recovery time can also reflect ecosystem drought resilience well. A simple method to examine whether GPP is actually decreased during drought events is to compare GPP during drought periods to the GPP climatology. A large and negative anomaly indicates the drought event can produce strongly negative impacts on GPP. Note that the non-response of ecosystem production to droughts can also be caused by the high ecosystem drought resistance (Gazol et al 2017), but these cases are not considered here.
We thus use the aforementioned three monthly GPP data sets, as well as monthly DSI and SPEI to examine the response of GPP during drought periods in the common time period (2000–2010). In arid and semi-arid regions, most drought events tend to decrease GPP (figures 2(a)–(f) and S7). However, in some tropical and northern high latitude regions, more than 80% of drought events do not decrease GPP. Most likely because ecosystem productivity is not limited by water but temperature or radiation in these regions (Nemani et al 2003, Liu et al 2018b), and the droughts identified may not be severe enough to limit plant photosynthesis. Uncertainties in using DSI to identify droughts could be related to the included vegetation greenness information (NDVI). The generally higher temperature and solar radiation during drought periods can even increase NDVI in temperature- and/or radiation limited regions. For instance, Dong et al (2019) found NDVI increase at high latitudes and high elevations of California during the 2012–2016 drought. Similarly, the negative GPP-DSI correlations were found in the tropics and high latitudes (figure S2(a)). NDVI may also not be able to capture drought-induced tree mortality if the mortality events event exposes a green understory (Dong et al 2019). Further, in the tropics and high latitudes or elevations, satellite-based vegetation greenness are affected by cloud, aerosol contamination and snow (Beck et al 2006, Hilker et al 2014, Zhou et al 2014). Including the drought events that do not decrease ecosystem production in the analysis will lead to an underestimation of the drought recovery time length (figure 2(g)), about 1 month in the global average. Therefore, it is important to only include drought events that decrease ecosystem production, to reduce biases in drought recovery time estimates.
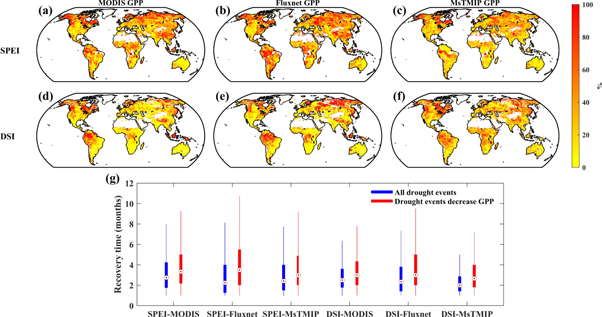
Figure 2. Spatial distribution of the percentage of drought events that cause positive GPP anomalies (a)–(f) relative to the climatology using different combinations of drought indices and GPP data sets over the period of 2000–2010. Regions with sparse vegetation and regions that did not experience any relevant drought events were masked in white. Box plot of drought recovery time estimated from all drought events (blue) and drought events that decrease GPP (red), using non-drought based recovery level (g). Lines reach the 5th and 95th percentiles; and boxes cover the interquartile range.
Download figure:
Standard image High-resolution imageFurther, the degree of GPP's response to droughts differs between drought indices regionally, including the magnitude of the anomaly and percentage of drought events that negatively impact GPP (figures 2 and S7). Because the algorithms and input data sets used to develop these drought indices are largely different. Soil moisture is more related to the drought impacts on ecosystems (Seneviratne et al 2010, Stocker et al 2019), because soil moisture is the direct water pool of vegetation. Unfortunately, data availability of global root-zone soil moisture is limited. Besides, our current ability to simulate soil moisture limitations on ecosystem production remains limited, especially concerning the parameterization of plant root characteristics (Kleidon and Heimann 1998, Feddes et al 2001). Recent progress in realistic root-zone soil moisture and plant rooting depth could help address these limitations (Fan et al 2017, Mohanty et al 2017).
4.2. Recovery level
When post-drought ecosystem production returns to the recovery level, drought recovery ends. The recovery level is often defined as the averaged ecosystem production in a specific period. Pre-drought based recovery level, i.e. the averaged ecosystem production in a period before the start of the drought, is most commonly used (Wolf et al 2016, Schwalm et al 2017, He et al 2018). Recovering to the level of ecosystem production before the drought is closely linked to the concept of 'drought recovery', and it is easy to calculate. However, the pre-drought time horizon is often determined subjectively. Another alternative way to define the recovery level is based on the non-drought period. Non-drought based recovery level, i.e. the averaged ecosystem production in the non-drought period, relies on the drought indices to determine the non-drought period (Yu et al 2017).
We propose that the recovery level should be close to the ecosystem production in normal climate conditions. This definition is also applied in a recent study to investigate the drought recovery of forests in US and Europe (Kolus et al 2019). Note that drought is a relative term; the discussion of drought already includes the information of normal climate conditions (Seneviratne et al 2012). Normal climate conditions refer to the mean climate conditions in the specific period at here, but the choice of period depends on the research objectives and available data records. For pre-drought recovery level, the pre-drought water availability could be related to the defined pre-drought time horizon, because the drought severity often increases gradually and thus the water availability during a short pre-drought period is likely to be low (Mukherjee et al 2018). Hence, would a short pre-drought period underestimate the water availability to derive recovery level and thus bias drought recovery time? Non-drought recovery level, on the other hand, is largely based on wet conditions, would it overestimate the water availability to derive recovery level and thus drought recovery time?
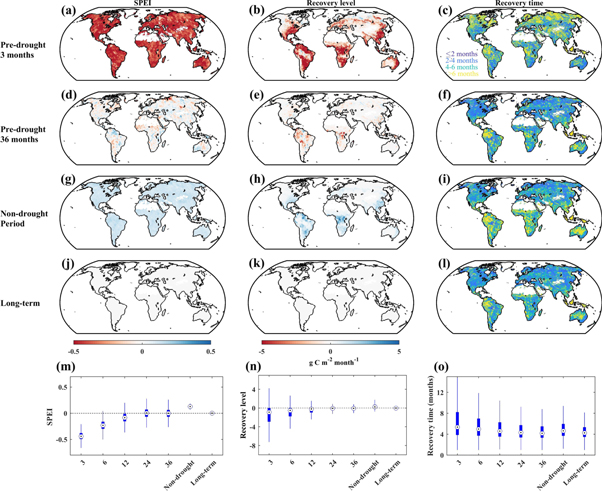
To test our hypotheses, we use five fixed pre-drought time horizons (3, 6, 12, 24 and 36 months), the non-drought period, and the climatology, to define the recovery level. Since we want to test a pre-drought time horizon of up to 36 months, we use long-term SPEI and DGVM GPP during 1901–2010. Figure 3 shows the water availability (indicated by SPEI) during the period used to calculate the recovery levels, recovery levels as well as the drought recovery time. As SPEI is a standardized drought index and GPP is detrended and deseaonalized, their long-term means approximate zero (figures 3(j) and (k)). For the short time horizon (3 months), water availability is especially low relative to the climatology. However, water availability in the long time horizon (36 months) is close to the climatology (figures 3(a), (d), (j), and (m)). The variability of averaged pre-drought based recovery level also decrease and tend to be close to the climatology (figures 3(b), (e), (k), and (n)). Note that despite the averaged pre-drought recovery level is below zero, since the correlation between SPEI and MsTMIP GPP is not very high, using the short pre-drought time period would derive recovery levels with large variability, i.e. very high and low recovery levels (figure S8), thus possible very high and low recovery time. Consequently, the spatial pattern and length of drought recovery time based on short pre-drought period are largely biased (figures 3(c), (l) and (o)), with an overestimation of about 2.7 months in global average relative to normal climate approach. By contrast, recovery time based on long pre-drought period capture the similar spatial pattern and length as the drought recovery time based on normal climate conditions (figures 3(f), (l) and (o)). Therefore, it is important to examine the water availability in pre-drought periods and is suggested to use a long pre-drought time horizon for analysis without long-term data.
Figure 3. Spatial distribution of averaged SPEI (a), (d), (g), (j), recovery levels (b), (e), (h), (k) and recovery time (c), (f), (i), (l) based on pre-drought time horizons of 3 months, 36 months, non-drought period, and long-term climate conditions respectively (1901–2010). Regions with sparse vegetation and regions that did not experience any relevant drought events were masked in white. Box plot of averaged SPEI (m), recovery levels (n) and recovery time (o) based on pre-drought time horizon of 3, 6, 12, 24, 36 months, non-drought period and long-term climate conditions. Lines reach the 5th and 95th percentiles; and boxes cover the interquartile range.
Download figure:
Standard image High-resolution image
In addition, the water availability in non-drought period is higher than in normal climate conditions (figure 3(g)). Therefore, it can overestimate recovery time relative to normal climate approach to some degree (figures 3(h), (i), (l) and (o)), about 0.6 months globally. A lower percentage of non-drought based recovery level could be useful to reduce this overestimation. We also acknowledge that the non-drought based recovery level could also be an alternative definition for recovery level in some cases with different objectives. In addition, it is also important to mention that the non-drought period identified by the drought index could be not suitable sometimes. For instance, since DSI is negatively correlated with GPP in the tropics, the drought period identified by DSI would induce much larger GPP than long-term mean of GPP (figure S1). It is therefore important to examine the relationship between ecosystem production and drought index first.
The pre-drought mirror window approach (i.e. pre-drought time horizon mirrors drought duration) is used to derive recovery level in S17. We found the averaged water availability in the mirror pre-drought period is below the normal climate conditions and thus bias the drought recovery time (figure S9). Using the normal climate based recovery level, we found the drought recovery time is also longest in some tropical regions, but not in northern high latitudes during 1901–2010 (figure 3(l)). Using pre-drought mirror window approach can overestimate recovery time by an average of 1.5 months globally relative to the normal climate approach. Combining MODIS and Fluxnet GPP data and including drought events that do not decrease GPP production results similar results (figure S10).
The non-drought approach is used to derive recovery level in Y17. The water availability in non-drought period is high than normal climate conditions as expected (figure S2(b)). Further, using normal climate based recovery level, we find the spatial patterns are similar in 2000–2010, but non-drought approach overestimate recovery time about 1 month globally (figures S11 and 1(a)).
5. Conclusions
This study investigates the sensitivity of drought recovery time to different methodological choices and helps to resolve the contradictory conclusions about drought recovery in current literature (Schwalm et al 2017, Yu et al 2017). We find that both, the method for drought identification as well as the drought recovery level definition, can induce large differences in drought recovery time estimates. Large differences in the study period can also impact drought recovery time estimates and partly explain the differences in spatial pattern and length of drought recovery. GPP data sets and GPP processing methods can not explain the differences in recent drought recovery estimates well.
We further revisit two steps with large uncertainties: the drought identification and the recovery level definition, in current methods for assessing drought recovery and provide suggestions for future analysis of drought recovery time. We found that a large percentage of drought events did not decrease ecosystem production, especially in the tropics and northern high latitudes. Including drought events with no negative impacts on GPP in the analysis does lead to an underestimation of the drought recovery time. It is thus of crucial importance to examine whether the identified drought events actually decrease ecosystem production. In addition, we propose that the recovery level should be close to the ecosystem production in the normal climate conditions (climatology). The water availability in a short pre-drought period is lower than the normal climate conditions and, oppositely, the water availability in non-drought periods is higher, which can bias recovery levels and thus also drought recovery time. Therefore, it is essential to examine the water availability in the defined period to derive the recovery level. Different from the previous analysis using the pre-drought mirror approach that biased the recovery time, we find the drought recovery time is also longest in tropics but not in northern high latitudes during 1901–2010. In table 2, we provide a synthesis of the advantages, limitations and recommendations for the two steps.
Table 2. Summary of the advantages, disadvantages and recommendations in the drought identification and the recovery level definition.
| Name | Main parameters | Advantages | Disadvantages | Recommendation | References | ||
|---|---|---|---|---|---|---|---|
| Drought identification | Climate-based | Example: Standard precipitation evapotranspiration index | Climate data (such as precipitation and potential evapotranspiration) | Only need climate data as input and easy to calculate | Not linked to plant available water directly | Identify drought events could decrease ecosystem production | Vicente-Serrano et al (2010) |
| Highly suitable for long-term analysis | Another alternative approach is to identify GPP extremes firstly and attribute it to drought (Zscheischler et al 2013) | ||||||
| Soil moisture | Soil moisture | Directly linked to plant available water | Limited availability of root-zone observations globally | Seneviratne et al (2012) | |||
| Satellite-based | Example: Drought severity index | Energy radiances at several wavelengths of the electromagnetic spectrum (such as normalized vegetation difference index) | High spatial resolution; Often include vegetation greenness information | Highly dependent on satellites; Short-term data set available | Mu et al (2013) | ||
| Recovery level | Pre-drought based recovery level: | Ecosystem production | Easy to calculate | Subjective determination of pre-drought time horizon | Examine water availability in pre-drought period | Schwalm et al (2017) | |
| Averaged ecosystem production during pre-drought period | Pre-drought time period | Highly suitable for analysis without long-term data | Use long pre-drought time horizon | ||||
| Non-drought based recovery level: | Ecosystem production | Rely on drought index to define period (relatively objective to pre-drought approach) | Highly dependent on drought index | Examine water availability in pre-drought period | Yu et al (2017) | ||
| Averaged ecosystem production during non-drought period | Non-drought time period | Suitable for both short-term and long-term analysis | Use a certain lower percentage of recovery level | ||||
| Normal climate based recovery level: | Ecosystem production | Highly suitable for analysis with long-term data | Need long-term data sets | Remove the trend in ecosystem production in long-term analysis | This study | ||
| Averaged ecosystem production during long-term time period | Long-term time period | Kolus et al (2019) | |||||
Based on the refined methods (excluding droughts inducing positive GPP anomalies and using ecosystem production close to the level at the normal climate conditions to define recovery level), we find drought recovery time is shortest in the tropics and some regions at northern high latitudes for 2000–2010 (figure S11). This agrees to Y17 but differs to S17. For 1901–2010, we find the drought recovery time is longest in some tropical regions but shortest in northern high latitudes (figure 3(l)). This is similar to S17 for the tropics but not for the northern high latitudes. The changes of recovery time over time and space could be linked to the differences in post-drought and background climate conditions, drought severity and other factors (Gazol et al 2017, 2018, Schwalm et al 2017), and requires detailed mechanistic investigations in the future.
Some limitations also exist in this study. Some of the employed datasets, such as the GPP datasets, are partly based on merged observations and may suffer from algorithmic uncertainties. Reliable ecosystem production data are required in future analysis. Results in regions with rugged topography could be biased, because aggregating data sets to the coarser spatial resolution can mask some information in these regions (Dong et al 2019). Our estimates of drought recovery time can be biased by anthropogenic activities and the possible shifts in species composition (Engelbrecht et al 2007, Tong et al 2018). Currently, drought recovery is tracked from drought ending time, but the drought legacy effects are reported to be prevalent in dry ecosystems (Liu et al 2018b), which could bias the drought recovery time. An alternative approach that may be worth to explore in future is to identify GPP extremes first (Zscheischler et al 2013) and track the drought recovery from the maximum negative GPP magnitude (He et al 2018).
In summary, this study contributes to resolving recent contradictory results from the literature about drought recovery time globally and revisits current methods to evaluate ecosystem drought recovery.
Acknowledgments
This work was supported by National Natural Science Foundation (Grant No. 41590843). Laibao Liu was funded by the China Scholar Council fellowship. Data supporting the conclusions of this study are properly cited and publicly available. We thank the MsTMIP project and MsTMIP modelers for contributing to the model outputs (https://nacp.ornl.gov/MsTMIP.shtml). We thank Numerical Terradynamic Simulation Group for contributing MODIS GPP and DSI products (http://ntsg.umt.edu/project). We thank the MPI-BGC for contributing Flux-tower upscaled GPP (https://bgc-jena.mpg.de/geodb/projects/Home.php). SPEI data set is available from digital Institutional Repository of the Spanish National Research Council (http://spei.csic.es/index.html). The authors have no conflicts of interest to declare.
Data availability
The data that support the findings of this study are available from the corresponding author upon reasonable request. The data are not publicly available for legal and/or ethical reasons.