


Abstract
Low-latitude areas generally experience relatively large precipitation totals, but droughts/dry spells do occur periodically and are potentially hazardous in these regions - especially within rapidly developing urban settlements. These areas typically have high water demand and therefore may potentially be subjected to water scarcity. Effective local water resource management lowering risks and vulnerabilities to drought is thus paramount, and these policies may be affected in regions with national borders sharing a common transboundary water resource. In this study, we (a) quantify and identify drought episodes using the Palmer Drought Severity Index in the neighbouring equatorial regions of Singapore and Johor, Malaysia, and (b) qualitatively examine each region's drought impacts and consequent responses through archival research over the past fifty years. The data indicate that both frequencies and intensities of drought episodes in both Singapore and Johor have increased over time, suggesting greater exposure to this hazard. However, there are distinct variations in drought impacts in Singapore and Johor, and how each region addresses water resource management to drought with varying degrees of success. Despite the close geographical proximity, significant variations in regional adaptive capacities suggest that different drought vulnerabilities exist. We discuss the efficacy of drought responses over different time scales, and suggest that a combination of demand- and supply-side policies, especially in the long-term, should be considered to reduce vulnerability to this hazard.
Export citation and abstract BibTeX RIS

Original content from this work may be used under the terms of the Creative Commons Attribution 3.0 licence.
Any further distribution of this work must maintain attribution to the author(s) and the title of the work, journal citation and DOI.
1. Introduction
The hazard of drought, through accumulated deficits in precipitation (meteorological), streamflow (hydrological), and soil moisture (agricultural), poses a major risk across numerous regions affecting natural and human sectors [1, 2]. Investigating risks associated with changing drought frequencies and intensities is prevalent globally, especially under contexts of climate change [3]. A comprehensive analysis of these risks is fraught with complications, such as varying levels of confidence and likelihood over (a) global- and regional-scale drought trends, as well as (b) on attribution of human influence to recent droughts [4], and (c) from complex interplay in regional/local scale distinctions of demographic sensitivity and socio-economic adaptive capacities directly influencing vulnerability to drought [5].
In the rapidly developing Southeast Asian region, scant assessment exists of drought risk (i.e. the potential for consequences where something of value is at stake and where future outcomes are uncertain, recognizing the diversity of values) and vulnerability (i.e. the propensity to be adversely affected arising from the interactions of exposure, sensitivity, and adaptive capacity to hazards) on coupled natural-human systems [1]. Apart from increased risks to water (and food) shortages directly arising from reductions in precipitation and streamflow, concern also exists over increasing vulnerability of lowland dipterocarp forests from the confluence of drought and human activities (e.g. logging, fragmentation, and fire) [6–11]. This vulnerability is also compounded by slow drought recovery in low tropics relative to other regions [12]. Further, agricultural drought conditions enhances surface wildfire and generation of smoke aerosols observed regionally, resulting in heightened mortality and morbidity especially in the islands of Borneo and Sumatra [13, 14].
Concerns over current and future drought risks in Southeast Asia are justified given the synergistic regional projections of future urbanisation patterns and climate change. Rapid urban growth rates, coupled with uncertainties in precipitation distribution, affect future development and consequent policies within Southeast Asia vis-à-vis droughts e.g. the complications arising from transboundary water issues within the Mekong basin [15, 16]. Such drought policy dilemmas are also present between the city-state of Singapore and the state of Johor, Malaysia. A complex water policy relationship exists between these two entities, which manifests in the politics underpinning the 1962 Water Agreement entitling Singapore to draw, treat, and import water from a Johor catchment until 2061, while providing a fraction of the treated water (2% of supply) in return for Johor's municipal use. While there is much discussion examining the political aspect on this transboundary issue [17], little emphasis exists on examining how historical climate affects drought in this part of Southeast Asia, and its impact on ensuing policies with respect to past and present urban vulnerability.
As such, this paper examines temporal trends of drought, specifically arising from changes in climate over Singapore and Johor, and discusses how past variations in urban drought vulnerability affects municipal water policy within and between these areas. We examine changes to drought exposure, sensitivity and adaptive capacity within both regions through assessing climate and archival data related to drought risks. We conclude by examining varying vulnerabilities with respect to anticipated urban resilience, defined as how settlements effect policies that anticipate, absorb, accommodate, or recover from the effects of drought [4]. Analyses of regional drought vulnerability can be complicated by a dearth of data, especially on socio-economic aspects of coupled human-natural systems, and this study illustrates a potential approach to integrating data to dynamically assess vulnerability.
2. Study area
2.1. Geographical context
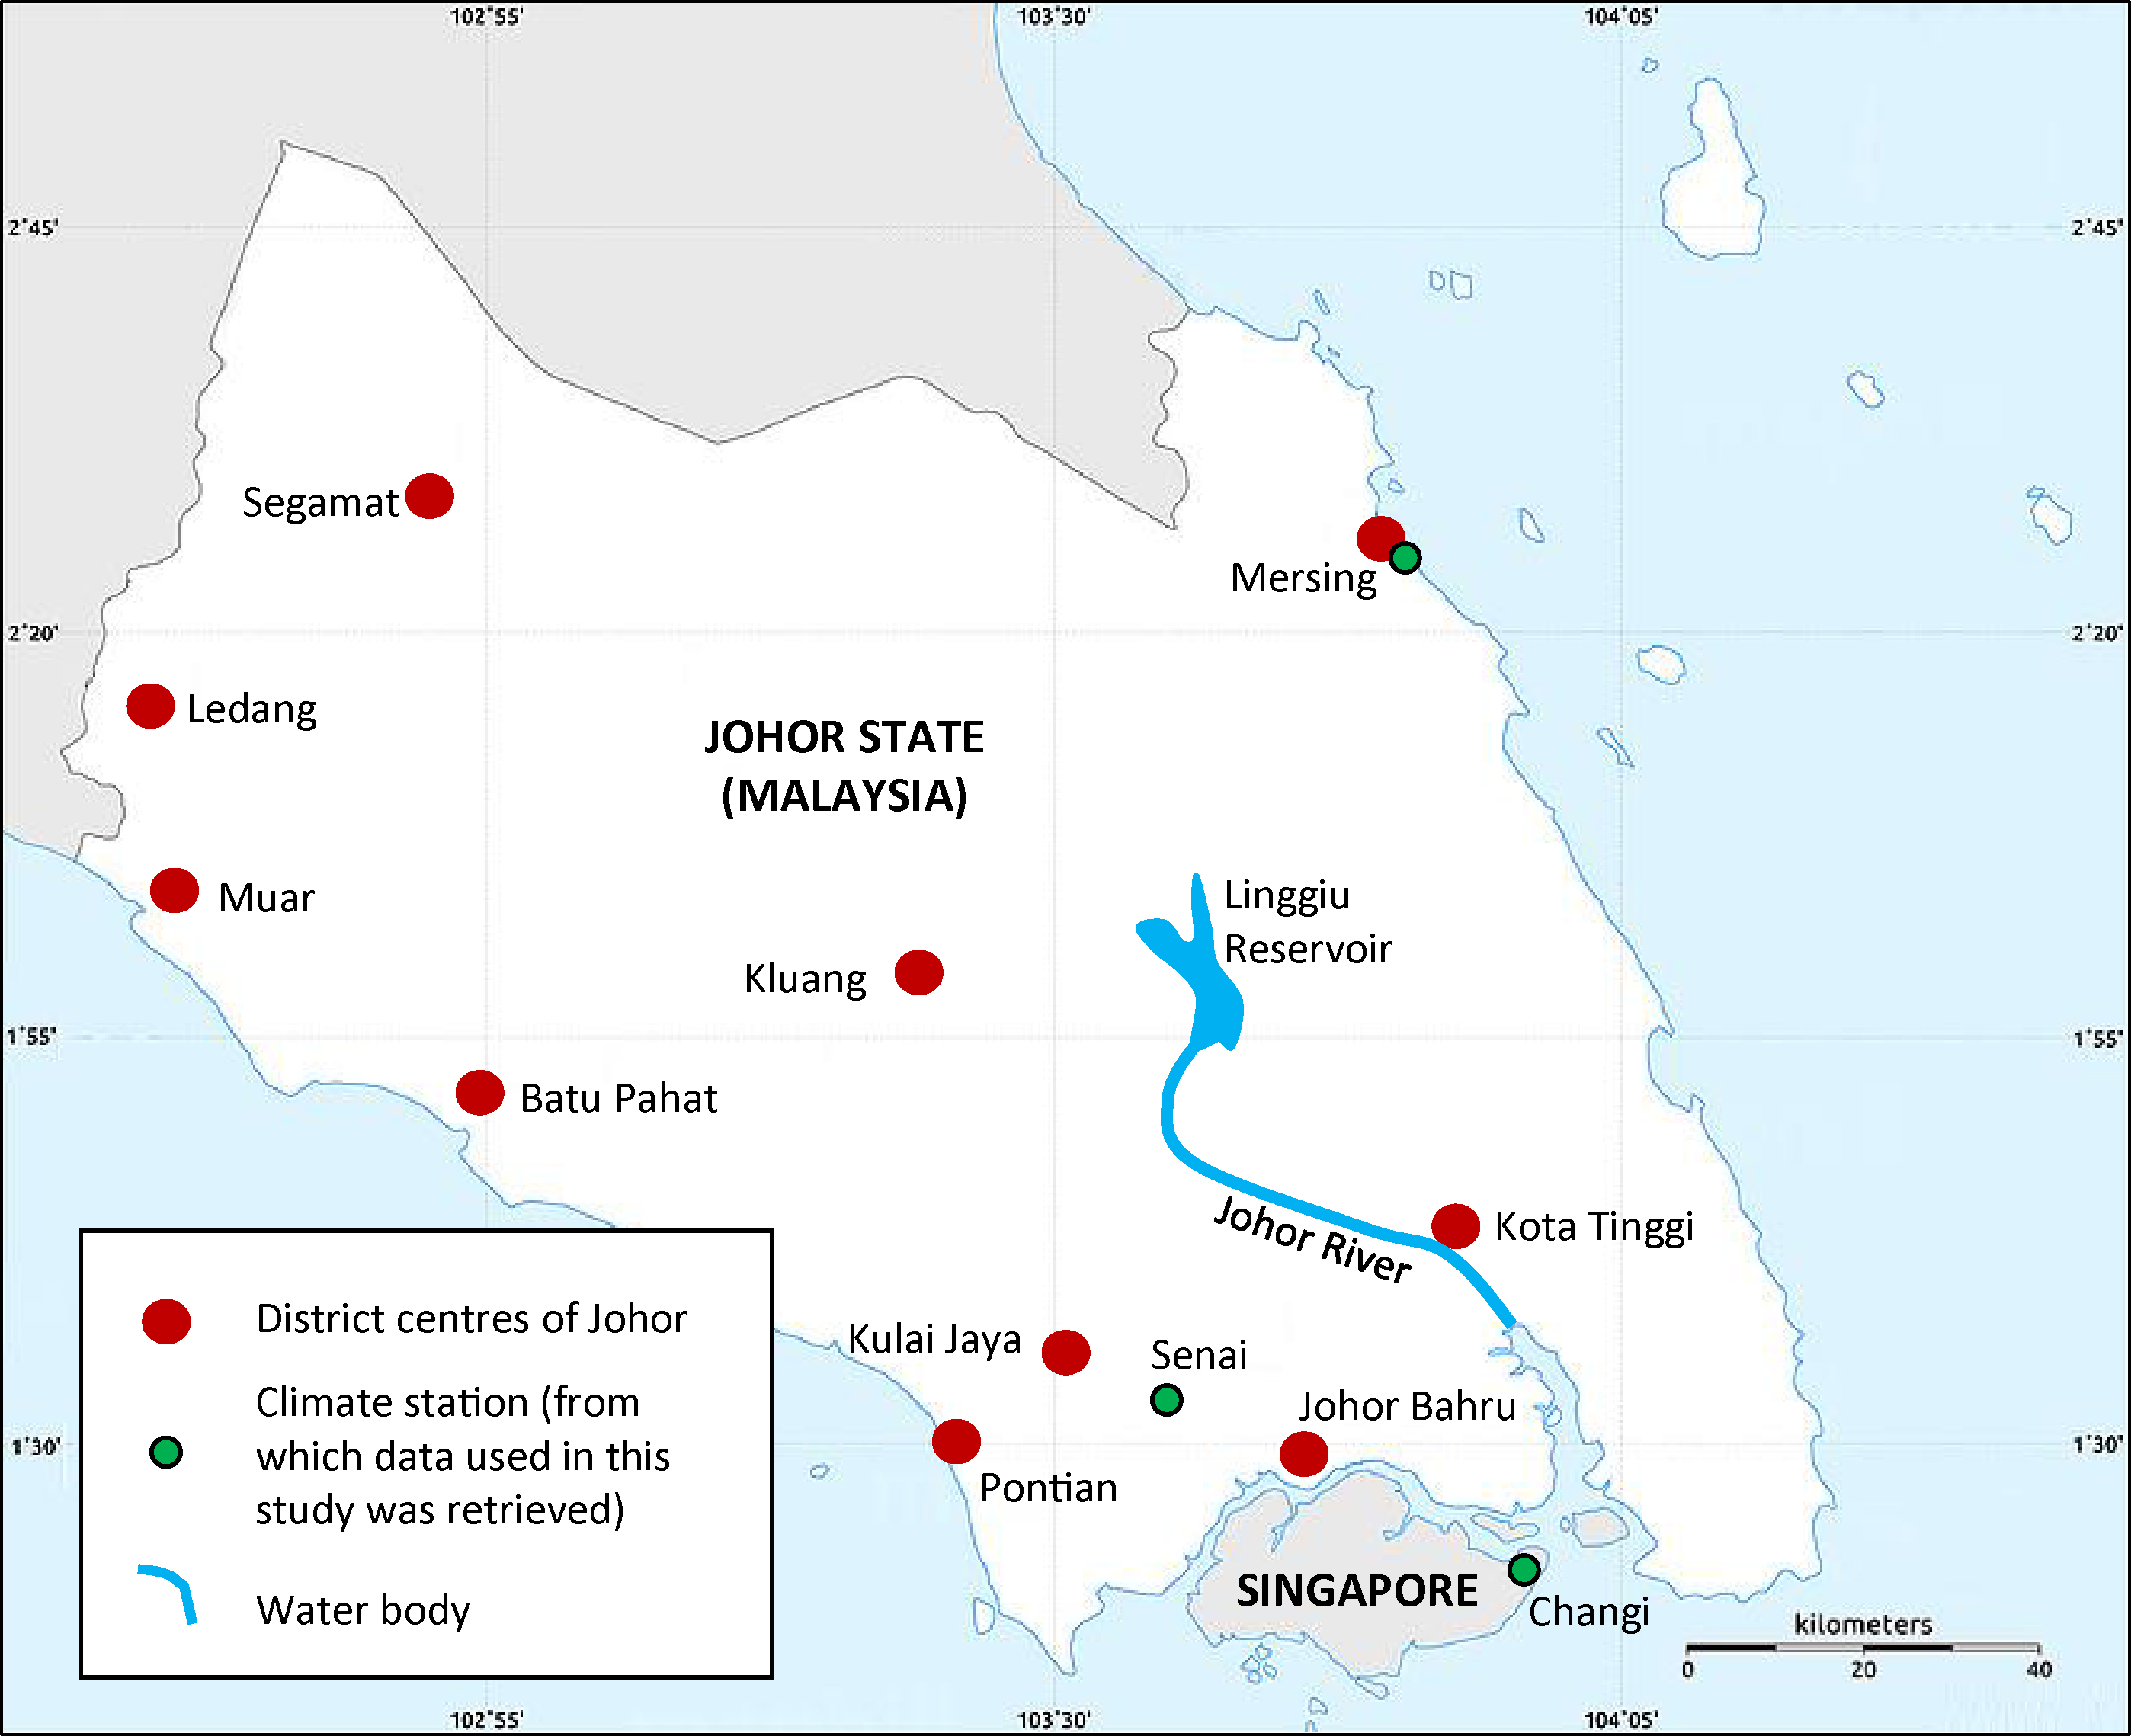
We investigate a region at the southernmost point of Peninsular Malaysia (figure 1). The Republic of Singapore is a small, heavily urbanised island city-state (~720 km2 land area; 2015 population ~5.5 million) [18, 19]. Across the Johor Strait lies the state of Johor (~19 000 km2; 2015 population ~3.6 million) [20]. The majority of Johor's land-use is forested or cultivated for oil palm plantation, while urban areas are typically concentrated in its ten administrative district centres in the state; of note is that approximately half of the state population are concentrated in the state capital Johor Bahru [20, 21].

Figure 1. Location of the Linggiu Reservoir, Johor River, the climate stations considered in this study, and major settlements in Johor and Singapore.
Download figure:
Standard image High-resolution imageBoth regions experience Köppen Af climates, with high annual mean temperatures (~27 °C) and total precipitation (~2400 mm). Monthly precipitation is unevenly distributed, with two distinct monsoon seasons occurring during the Northern Hemisphere winter (December–February) and summer (June–August). Precipitation in this region largely occurs during the winter monsoon, especially in December and early January. In Johor, a precipitation gradient exists during this season with eastern coastal settlements receiving more rainfall relative to inland areas in the centre and West Johor [22]. Both regions are also strongly influenced by El Niño–Southern Oscillation events, with generally warmer and drier (cooler and wetter) conditions associated with El Niño (La Niña) conditions.
2.2. Water resource management in Singapore and Johor
The Public Utilities Board (PUB) is the national water agency regulating and overseeing Singapore's entire water system, from supply and conveyance, to wastewater discharge and treatment. Over the past fifty years, PUB has expanded Singapore's water supply to four main sources, dubbed the 'Four National Taps' [23]. About half (up to 1100 million litres per day, MLD) of total supply is imported water from the Johor River. Before being piped to Singapore, raw water is treated in-situ at the PUB-managed waterworks located near the town of Kota Tinggi. A major concern for water treatment here is saltwater intrusion upstream during high tides or droughts, which effects can be controlled by the release of water stored in a purpose-built regulatory reservoir (Linggiu) north of Kota Tinggi (figure 1). Singapore funded the reservoir's construction in 1992, and has also compensated the Johor State government via renting the land for the reservoir's continued use until 2061.
The remaining half of supply originates from a combination of surface water from 17 local reservoirs created by damming local catchments; recycled water (termed NEWater); and desalinated seawater. Despite its high annual precipitation, Singapore is considered one of the world's most water-stressed countries due to its inability to retain rainwater relative to its high demand [24]. In 2015, total daily water demand was ~2000 MLD, with 45% for domestic consumption and 55% non-domestic (i.e. commercial, industrial) uses. The daily domestic water consumption for the same year was 151 L per capita.
In Johor, SAJ Ranhill, a government-linked company, manages water treatment and distribution and reports to Badan Kawalselia Air Johor, the state's water regulatory body. Johor is a water-rich state; it exports water to both Singapore and Melaka, an adjacent state northwest. In 2015, there were 44 water treatment plants with total design capacity of ~2000 MLD [25]. Raw water resources in Johor are derived from its river basins; of particular importance is the Johor River basin in the Southeast. With a catchment area of ~2300 km2 and a 7 day low flow of 0.38–1.76 m3s−1, it is the largest non-interstate river basin, and a crucial supply source to both Johor Bahru District and Singapore [22]. In 2015, the total daily potable water demand in Johor was 1259 MLD; of which 64% (36%) was for domestic (non-domestic) consumption [26]. For the same year, the daily per capita domestic water consumption was 211 L [27].
3. Methods
We adopt a commonly-used systems framework defining urban vulnerability to drought as the combination of attributes of (a) exposure to drought, (b) demographic sensitivity to this hazard, and (c) the urban socio-economic capacity to adapt towards drought impacts (figure 2) [28, 29]. In this study, spatio-temporal changes in urban vulnerability is examined via corresponding variations in each attribute, and can be documented for both Singapore and Johor using a combination of available climate and archival data.
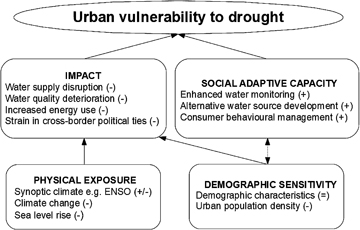
Figure 2. Conceptual framework of urban vulnerability to droughts based on previous frameworks in [28, 29]. Ovals are component factors of overall vulnerability with example physical and social attributes relevant for drought italicised. Attribute impacts towards overall vulnerability are positive (+), negative (−), or neutral (=). Solid lines indicate direct connections between components with the direction being indicated by the arrowhead, while dashed connections indicate potential feedbacks.
Download figure:
Standard image High-resolution imageTo ascertain the exposure to drought in our study area, we quantified the precipitation deficit affecting watersheds by applying the Palmer Drought Severity Index (PDSI) [30]. PDSI is a standardised unitless index ranging from –10 (dry) to +10 (wet), and it accounts for moisture supply (precipitation) and demand (potential evapotranspiration) through inputs of local temperature data, soil conditions, and a physics-based water balance model. In general, a location's PDSI < −3 indicates severe drought.
Table 1. Metadata for PDSI derivation.
| Station | Latitude/Longitude | Data/time period | Data source |
|---|---|---|---|
| Changi, Singapore | 1°22' N 103°59' E | January 1950–December 2016 | NCDC |
| Mersing, Malaysia | 2°27' N 103°50' E | January 1966–December 2016 | MMD |
| Senai, Malaysia | 1°38' N 103°40' E | February 1974–December 2016 | MMD |
NCDC: National Climatic Data Centre; MMD: Malaysian Meteorological Department.
We selected PDSI over other indices (e.g. precipitation-only Standard Precipitation Index, or percentiles of normal precipitation) as including temperature and soil moisture conditions as inputs enables assessing abnormalities of both water-demand and—supply with respect to drought [31]. PDSI has been applied in previous drought research within Southeast Asia [32–34]. Further, the region's low-latitude and low-elevation reduces a potential imprecision of PDSI arising from a key assumption that all precipitation is immediately available for supply as rainfall instead of snow. This assumption affects PDSI accuracy in high-latitude or -altitude regions where melting snowpack can reduce drought during water stressed periods in summer, but does not apply here.
Monthly PDSI was calculated from daily weather station temperature and precipitation data (table 1) using a custom MATLAB script [35]. The respective Available Water Content (AWC) used to calculate the Singapore and Johor soil moisture at field capacity are 350 mm m−1 and 440 mm m−1, which are typical values for the Rengam (Rengam-Jerangau) soil series found in Singapore (Johor) [36]. While we acknowledge a valid critique that autocorrelation may be present at monthly timescales of PDSI, we are confident the long duration of climate datasets used would not affect interpretation for observed drought conditions reported via PDSI.
While quantifying physical exposure to drought is achieved via PDSI, we utilise qualitative approaches to document societal attributes i.e. examining both demographic sensitivity, and each settlement's socioeconomic capacity to adapt to drought. This method is often utilised in the absence of quantitative data of sufficient quality or resolution e.g. data of daily water consumption or supply in settlements during severe drought events that are often unavailable for this region. As such, we adopt an alternative approach from the social sciences through examining historical media content, e.g. archived news media reports, which enhances vulnerability analyses by ascertaining crisis periods of droughts affecting the general public in a region, and corresponding societal responses to water scarcity [37]. Further, archival analysis of the effectiveness of historical socioeconomic policies to drought adaptation—after responding to crisis periods of drought—is an important tool towards planning for future adaptation to extreme weather events [38].

Figure 3. 1950–2016 time series plots of (a) Oceanic Niño Index, and derived PDSI for (b) Changi, (c) Senai, and (d) Mersing Stations. Periods of strong El Niño events (ONI ≥ 1.5) and severe drought periods (PDSI ≤ −3) are highlighted, with individual drought events at each station labelled sequentially.
Download figure:
Standard image High-resolution imageTo this end, we examined several publicly available archival media sources e.g. Singapore and Malaysian newspapers in which droughts were explicitly mentioned. We used the search terms 'drought' or 'dry spell' in the digital newspaper archives NewspaperSG and Factiva [39, 40]. NewspaperSG was used to search for Singapore-based newspaper articles prior to 1989, while Factiva was utilised to obtain English (Singaporean and Malaysian newspapers) and Bahasa Melayu (Malaysian newspapers) newspaper articles after 1989 (NB: one of the authors (CJC) is fluent in Bahasa Melayu). Articles reporting on drought/dry spell incidence, as well as associated impacts and responses, were noted from both archival datasets. These articles were grouped according to severe and/or extreme drought periods listed in the PDSI dataset, and their content categorised and analysed specifically for local and regional drought impacts and policy responses.
4. Results
4.1. PDSI variations
There was considerable variability in ranges of derived PDSI (figure 3). The coastal stations of Changi (−7.26 to +5.31 (σ = 2.24)), and Mersing (−8.80 to +6.66 (σ = 3.02)), observed greater variability in their respective datasets compared to the inland Senai station (−4.59 to +5.19 (σ = 1.90)). Severe drought events (PDSI <−3) are labelled sequentially in figure 3 by station, and occurred more frequently in Changi and Mersing. These accounted for 11.4% (92 out of 804 months) and 17.8% (109 out of 612 months) in the respective Changi and Mersing datasets (figure 4). In contrast, severe drought only occurred at Senai for 38 out of 515 months (7.3%).

Figure 4. Histogram of PDSI for Changi, Senai, and Mersing normalised for each station's dataset length. Periods of severe drought (PDSI ≤ −3) are shaded. Data from the coastal stations (Singapore and Mersing) showed greater variability than the inland station (Senai). Our data also show that frequencies of severe droughts are higher at the coastal areas.
Download figure:
Standard image High-resolution imageHistorical ONI (Oceanic Niño Index) data were obtained from NOAA's Climate Prediction Centre (NOAA, 2017) and plotted (figure 3). Significant correlation coefficients at p <0.05 levels were found between ONI and PDSI datasets at the coastal Changi (r = −0.46) and Mersing (r = −0.29) stations, which are more exposed to monsoonal precipitation, but not at the inland Senai station (r = 0.02); this significant inverse relationship is unsurprising given the strong influence of El Niño on synoptic climatology in Southeast Asia. More severe drought spells also overlapped with strong El Niño events. Notable episodes in 1982/83, 1997/1998, and 2015/2016 coincided with severe drought spells of considerable duration and intensity at all stations. Given the proximity of stations to each other, severe drought events often occurred simultaneously in two or three of the studied locations; a total of fifteen episodes, with the longest lasting over two years (June 2014 to June 2016) in Changi and Mersing (table 2).
Table 2. Occasions when ≥2 stations had monthly PDSI < −3.
| Period | Station | Duration (Months) | Mean PDSI | Min PDSI |
|---|---|---|---|---|
| December 1982–August 1983 | Changi | 9 | −5.13 | −5.90 |
| Mersing | 9 | −4.64 | −5.78 | |
| June 1990, August–September 1990 | Senai | 3 | −3.31 | −3.66 |
| Mersing | 3 | −3.22 | −3.51 | |
| February 1991–April 1991 | Changi | 3 | −3.48 | −3.61 |
| Senai | 3 | −4.02 | −4.59 | |
| July 1991 | Changi | 1 | −3.79 | −3.79 |
| Senai | 1 | −3.71 | −3.71 | |
| Mersing | 1 | −3.01 | −3.01 | |
| August 1991 | Changi | 1 | −3.17 | −3.17 |
| Senai | 1 | −3.74 | −3.74 | |
| Oct 1991 | Changi | 1 | −3.65 | −3.65 |
| Mersing | 1 | −3.00 | −3.00 | |
| March 1992–June 1992 | Changi | 4 | −3.77 | −4.22 |
| Mersing | 4 | −3.81 | −4.25 | |
| September 1992 | Changi | 1 | −3.24 | −3.24 |
| Mersing | 1 | −3.71 | −3.71 | |
| August 1997–March 1998 | Changi | 8 | −6.67 | −7.26 |
| Mersing | 8 | −4.67 | −5.71 | |
| April 1998–July 1998 | Senai | 4 | −3.47 | −3.55 |
| Mersing | 4 | −5.64 | −6.87 | |
| September 1998–February 1999 | Senai | 6 | −3.80 | −4.32 |
| Mersing | 6 | −7.59 | −8.24 | |
| August 2005–September 2005 | Changi | 2 | −3.17 | −3.89 |
| Mersing | 2 | −3.19 | −3.28 | |
| June 2014–June 2016 | Changi | 25 | −4.73 | −6.36 |
| Mersing | 25 | −4.41 | −6.67 | |
| July 2016–October 2016 | Changi | 4 | −4.83 | −4.96 |
| Senai | 4 | −3.78 | −3.89 | |
| Mersing | 4 | −8.54 | −8.8030 | |
| November 2016–December 2016 | Senai | 2 | −3.63 | −3.71 |
| Mersing | 2 | −7.63 | −8.29 |
There is evidence suggesting recent droughts have become more severe and prolonged, especially at Changi and Mersing. More extreme droughts (PDSI ≤ −6) have only occurred in the last two decades (figure 5), with the lowest PDSI of −8.80 recorded at Mersing in August 2016.
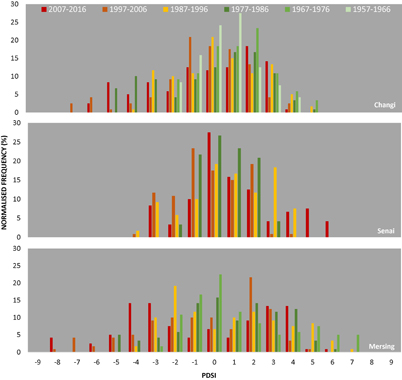
Figure 5. Histograms of decadal Changi, Senai and Mersing PDSI normalised for frequency over each ten-year period. Of interest, the climate data from Changi and Mersing show that recent droughts have been more severe. Specifically, extreme droughts (PDSI ≤ −6) have only occurred in the last two decades.
Download figure:
Standard image High-resolution image4.2. Drought impacts
Despite similar exposure levels, the resulting drought impacts differed between Singapore and Johor (table 3). Water provision to Singapore users was largely unaffected throughout as supply to commercial and domestic users has not been disrupted since 1965. The last drought-related disruption occurred during several water rationing exercises between April 1963 and February 1964 [41, 42]. Compared to recent drought episodes, Changi's PDSI values were appreciably lower in that period (−2.86 to +1.90).
Even during the severe C7-S5-M13 event, the only reported impact was concern over low Linggiu Reservoir levels affecting water treatment at Kota Tinggi due to saltwater intrusion in the Johor River. To account for potential shortfall of imported water during this severe drought period, up to 114 MLD of recycled NEWater (~10% of imported water) were pumped into local reservoirs in Singapore.
In contrast, impacts were critical in Johor during severe drought events as prolonged supply disruptions were fairly common, especially within many settlements. Despite the larger number of treatment plants and water catchments, frequent impacts to water supply were reported in the archives (table 3). Since 1990, numerous accounts of water disruptions to urban users were documented for nearly all severe drought episodes. Local municipally-mandated scheduled rationing from low water supply accounted for these disruptions. The severe C7-S5-M13 drought event had the most reports from many district centres, including Johor Bahru.
Given how water is managed within the Johor River for both regions, a notable transboundary issue is the political tension likely stemming from differential impacts between Singapore and Johor. During several recent drought episodes, perceived disparities between each region's water policies resulted in strains of cross-border relationships at governmental levels. Johor politicians have, for instance, repeatedly suggested Singapore pay higher tariffs for imported water in spite of the 1962 Agreement, and municipal authorities in Kota Tinggi unsuccessfully attempted increasing land assessment taxes on the Singapore-owned waterworks sited there (table 3).
Table 3. Impacts of severe droughts on Singapore and Johor.
| Singapore | ||
|---|---|---|
| No. | Impact | Drought |
| 1 | Deterioration of water quality (raw and supplied) | |
| Due to the diminished original water supply source, PUB re-directed water from an alternative unspecified 'local' source. The re-direction resulted in the murkiness of received water [79, 80]. | 1991 (C3, S1, M5, M6) | |
| Lowered water levels of Johor River resulted in seawater intrusion. Production at waterworks was disrupted on numerous occasions due to the increased salinity of raw watera [81–83]. | 2013–14 (C7, S5, M13) | |
| 2 | Increased production of energy-consuming and unconventional water supply | |
| On various occasions, PUB increased production of 61–114 MLD of NEWater into local reservoirs to fulfil demandb [81, 83–85]. | 2014–16 (C7, S5, M13) | |
| Johor | ||
| No. | Impact | Drought |
| 1 | Disruption of water supply | |
| Water rationing, where supply was limited to a few hours daily, was implemented within nearly all of Johor districts, including Batu Pahat, Kluang, Mersing and Muar [86–89]. | 1990 (C3, S1, M5) | |
| Waterworks at Kota Tinggi ceased operations due to inadequate raw water supplies from rivers. Several residents collected water from nearby swamps for domestic use e.g. cooking, bathing and washing [90]. | 1997 (C5, S2, M7) | |
| Water rationing occurred in Kluang and Batu Pahat districts. Supply was only available every alternate day. Residents also complained of receiving murky water [91]. | 2005 (C6, M9, M10) | |
| The residents in Kluang and Batu Pahat districts were subjected to water rationing [92]. | 2010 (S4, M12) | |
| During this prolonged period, water supply in most parts of the state was disrupted (e.g. [93–100]. For example, in 2014, Kluang, Mersing, Kota Tinggi and Kulai Jaya districts underwent several months of scheduled water rationing [101–103]. In 2015, many districts including the city of Johor Bahru and the industrial area of Pasir Gudang were subjected to water rationing [98, 104, 105]. | 2014-16 (C7, S5, M13) | |
| 2 | Strain to the Johor-Singapore relationship | |
| In 2014, Kota Tinggi municipal authorities sought to double land assessment taxes on PUB's waterworks along the Johor River. Singapore, however, was unwilling to discuss the increase [106]. | 2014-16 (C7, S5, M13) | |
| During water shortages, the government of Johor was urged 'by several (unnamed) quarters' to stop supplying water to Singapore [107]. | ||
| Local Malaysian politicians have also disagreed publicly about the selling price of water to Singapore [107]. | ||
aPUB's water treatment plant directly sources from the Johor River. Water is released from Linggiu Reservoir to prevent sea water intrusion. bWhile NEWater is safe for drinking, Singapore has yet to supply it directly to households.
Table 4. Singapore and Johor's immediate- and long-term responses to droughts.
| Singapore | ||
|---|---|---|
| No. | Response | Drought |
| Immediate | ||
| 1 | Advisories | |
| PUB announced that constructions sites, recreational clubs, as well as residential and industrial areas will be monitored for 'blatant' water wastage activities. Responsible parties will be warned initially but will be prosecuted for subsequent offences [48]. | 1983 (C1, M3) | |
| Numerous cautionary advisories from the government including PUB, the Minister of Environment and Water Resources, and the Prime Minister, were made to inform the public of the severity of the impact of the dry spell as well as importance of water conservation [83, 85, 108–112]. | 2014-16 (C7, S5, M13) | |
| Long term | ||
| 1 | Expansion of climate resilient water resources | |
| Recycled drinking-water from five NEWater plants currently fulfils 40% of local demand and is projected to meet up to 55% of Singapore's water needs by 2060. In addition to the two current desalination plants (combined capacity: 455 MLD), three more with a combined capacity of almost 410 MLD will be built by 2020. By 2060, the total desalination capacity will be tripled to meet up to 30% of Singapore's needs [23]. | ||
| 2 | Rainfall harvesting | |
| Most local waterways have been dammed to harvest urban runoff for storage. Since 2011, two-thirds of Singapore's land area has been transformed into water catchments [23]. Singapore aims to expand its water catchment area to 90% of Singapore's land ultimately. | ||
| 3 | Development of sub-surface sources and storage | |
| PUB are also carrying out exploratory studies to examine the potential of exploiting existing groundwater to serve as back-up water resources during periods of severe droughts [113, 114]. The economic and technical feasibility of developing an underground reservoir system in subterranean caverns has been considered [114, 115]. | ||
| 4 | Exploring alternative sources of imported water | |
| In addition to the water imported from Johor, there have also been previous negotiations to purchase water from the state of Pahang, Malaysia as well as the province of Riau, Indonesia [116–121]. | ||
| 5 | Water conservation for domestic and industrial consumers | |
| The Water Efficiency Labelling Scheme introduced in 2009 requires suppliers to list the efficiency of their fittings and appliances for consumer information [23]. From January 2015, large non-domestic water users consuming over 60 million L annually are required to install private meters. They are also required to submit a Water Efficiency Management Plan (WEMP) to PUB every year [23]. | ||
| 6 | Water pricing | |
| From 1991, the Water Conservation Tax was introduced with the aim to 'slow down growth in water consumption'; from 2017, water tariffs will be increased by 30% to discourage wastage[122]. | ||
| 7 | Water rationing practice session | |
| Island-wide water rationing exercises have been conducted during non-drought periods for educational purposes [123–126]. | ||
| Johor | ||
| No. | Response | Drought |
| Immediate | ||
| 1 | Cloud Seeding | |
| More than 20 cloud seeding operations were carried out over Johor Bahru [91]. | 2005 (C5, M9, M10) | |
| Cloud seeding exercises 'successfully stabilised' the water levels at several reservoirs in drought-hit areas of central Johor [92]. | 2010 (S4, M12)) | |
| Several cloud seeding exercises were executed during this severe drought episode [75, 96, 105, 127–129]. | 2014-16 (C7, S5, M13) | |
| 2 | Additional treated water from Singapore | |
| From August 2015 to January 2016, and in June 2016, at Johor's request, PUB provided an extra 19–23 million L of treated potable water to Johor daily Again, in June 2016, an additional 27 million L of potable water were provided to Johor daily [95]. | 2015-16 (C7, S5, M13) | |
| 3 | Water rationing | |
| Scheduled in-state rationing of water has occurred on numerous occasions particularly during severe drought periods. | Various | |
| Long term | ||
| 1 | Construction of barrages to prevent seawater intrusion | |
| To prevent seawater intrusion during dry seasons and high tides, the Johor River Barrage was built [67, 87, 102]. The construction of a barrage on the Muar River was proposed and is expected to commence in 2018 [130]. | ||
| 2 | Inter-basin transfer of water to increase reservoir storage | |
| Raw water will be transferred (up to 30 MLD) from the Papan and Tiram Rivers to Lebam and Layang Reservoirs respectively, via a network of pipes in a USD 1 million project [131]. The Johor government is also studying plans to divert water from the Sayong and Ulu Sedili Besar Rivers to the Linggiu Reservoir to reduce in-state water shortages [132, 133]. The completion of the Layang Project will see the transfer of raw water (over 300 MLD) from Seluyut and Ulu Sedili Besar Rivers to the Upper Layang Reservoir [130]. | ||
| 3 | Development of non-conventional water resources | |
| Plans for the construction of a desalination plant—the largest in Malaysia, if built—have been made [125, 126, 134–135]. A water reclamation plant is also being considered to produce water for industrial use [136]. In addition, tubewells will be constructed in Mersing and Kota Tinggi districts to examine the potential of groundwater resources [134, 137, 138]. | ||
4.3. Responses to droughts
Both Singapore and Johor developed immediate- and long-term measures as responses to drought impacts (table 4). Immediate responses differed between regions, largely stemming from the varying severity of reported drought impacts. In Singapore, recent responses were largely limited to governmental advisories issued to consumers. In contrast, unconventional immediate responses were reported in Johor e.g. cloud-seeding operations to induce rain during severe droughts since the early 2000s. At the peak of the 2015/16 severe drought, Singapore turned provider when the Johorean government requested additional treated water (~21 MLD) to fulfil Malaysian transboundary demand.
The long-term strategy to reduce drought risks and vulnerabilities in both regions largely involves policies directed at water supply and infrastructure development. Singapore planned to increase water supply by increasing water catchment areas, developing sub-surface water supplies and spaces for storage, as well as exploring alternative sources of imported water [23, 43, 44]. Of particular importance is developing climate-resilient water resources unaffected by droughts. Presently, five NEWater plants exist in Singapore with combined production capacity of ~760 MLD, capable of meeting up to 40% of current demand. By 2061, projected NEWater supply will account for 55% of future water demand. Currently, two desalination plants operate in Singapore with a combined capacity of ~455 MLD (~25% of current water demand). Three more desalination plants are expected to begin operations by 2020. With a capacity of ~136 MLD each, projected desalinated water will meet up to 30% of Singapore's 2061 water needs (figure 6).
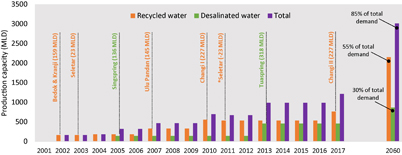
Figure 6. Historical and future development of climate-resilience water sources—recycled (NEWater) and desalinated water—in Singapore. (NB:⁎ note the decommissioning of the Seletar NEWater Plant in 2011).
Download figure:
Standard image High-resolution imageEffective domestic water demand management was also applied in Singapore. Through a combination of economic and punitive policies, such as pricing water to discourage wastage, implementing a Water Conservation Tax, and prohibiting sales of water-inefficient plumbing fittings, toilet cisterns and washing machines (table 4), Singapore's per-capita domestic water consumption steadily decreased from 165 L day−1 in 2003 to 151 L day−1 in 2015. The stated policy aim is to reach 140 L day−1 demand by 2030 [23].
Most of Johor's long-term drought response is strictly via intra-state infrastructure development to increase water supply, including (a) constructing coastal barrages preventing sea water intrusion into catchments, and (b) inter-basin transfer of water between rivers to enhance storage in existing reservoirs (table 4). Development of recycled and desalinated water production has also been considered, but concerns over commercial viability remain. Both national and state governments have also recognised the importance of water demand management [45]. Substantial evidence of these efforts, however, was not found.
5. Discussion—water resource management with respect to drought vulnerability and risk
Currently, drought vulnerability between Singapore and Johor appears different. Similar regional levels of exposure and demographic characteristics exist, but a lack of critical impacts from severe drought episodes, coupled with limited immediate-, and more diverse long-term responses on both water-demand and supply aspects, suggest that a high level of adaptive capacity and consequent low vulnerability to drought exists in Singapore (figure 2). Conversely, the greater number of water disruptions in Johor, larger variety of immediate responses to severe drought, and long-term responses concentrated on infrastructural development of water supply strongly suggest relatively higher vulnerability to drought in Johor exists due to lower adaptive capacity.
The important corollary from this present vulnerability analysis is how future uncertainty vis-à-vis drought risk for these settlements can be effectively managed. Perhaps the biggest challenge in reducing Singapore's drought risk is improving demand management through water conservation. Evidence exists of Singapore water users being aware of water conservation through perception surveys and by consistent decreases in domestic per-capita water consumption [46]. During drought episodes, however, water consumption has paradoxically increased by 2.6% and 5.0% in 1983 (C1) and in 2014 (C7) respectively [47, 48]. These reported consumption increases suggest that water use advisories during droughts may be ineffective in lowering demand.
Singapore's long-term policies to reduce its drought vulnerability through expanding its water resources are commendable, specifically with its successful development of NEWater and desalinated water sources. The production of both, however, is relatively energy-intensive [49]. Producing 1 m3 of recycled (desalinated) water requires 1.1 (3.5) kWh compared to 0.2 kWh for treating catchment water [50]. Using current technology, conservative projections indicate a quadrupling of energy consumption for producing desalinated water by 2060 [23]. Further, NEWater and desalinated water production requires careful management of rejected concentrates and brine effluents. Impacts of brine disposal to local environments from desalination to receiving waters have been well documented [51–53]. Wastes from recycled water production, on the other hand, contain high concentrations of various toxic compounds; many of which persist in the environment [54]. PUB claims that current recovery rates for recycled water is currently 75% [23]. While it is likely that current technologies will improve energy efficiency and effluent treatment, long-term questions remain on the economic and environmental viability of these two water sources.
NEWater in Singapore is safe for direct consumption, but it is produced mainly for non-domestic use as an indirect potable source; it is added to local reservoirs, which act as environmental buffers, and re-treated in waterworks [55]. Despite this inefficiency, the use of reclaimed water as an indirect rather than a direct potable source is unsurprising. Only one out of 3300 registered water reclamation projects worldwide, located in Windhoek, Namibia, is for direct potable use [56–58]. Widespread public scepticism towards drinking treated wastewater can be attributed to emotional grounds of disgust, a visceral psychological reaction known as the 'yuck' factor [59, 60]. As an approach to reduce drought vulnerability, it remains to be seen if Singapore can eventually complete the transition to direct supply of recycled water for potable domestic use.

Figure 7. Actual and projected water demand in the state of Johor from 2000–2050 (data for 2009–2014 unavailable).
Download figure:
Standard image High-resolution image
Presently, imported water from Johor fulfils ~60% of Singapore's total demand. Apart from drought, another pertinent risk is this source requires safeguarding against degradation. For Singapore, the risk of poor imported water quality is arguably larger than that of drought, especially as the Johor River is susceptible to contamination. In July 2016 and October 2017, high concentrations of ammonia were detected in the river that led to the temporary shutdown of PUB's water treatment plant [61–63].
Unlike Singapore, Johor is relatively water-rich. In 2010, total water demand for all sectors comprised only 22% of available surface water resources [45]. By 2050, total in-state water demand is expected to double, and even then, it still represents <40% of available resources (figure 7). The challenge for Johor, thus, is to effectively manage these resources and lower drought risk through complementary demand- and supply-side policies.
Of particular importance is protecting available surface water resources from contamination [64, 65]. Nearly all in-state rivers have documented degradation to water quality [66, 67]. The ammonia contamination within the Johor River in 2016 and 2017, which caused the temporary shutdown of PUB's waterworks, also disrupted operations at two Johor-managed waterworks; in 2016, ~600 000 Kota Tinggi consumers were affected [68]. In 2017, ~1.8 million residents in Johor Bahru also experienced supply disruptions [69]. Activities from intensive agriculture, particularly from oil palm plantations within water catchments, are also recognised threats that have resulted in significant fish die-off events [70, 71]. In the long-term, policies regulating Johor water pollution from agricultural or industrial activities could not only improve environmental quality but also lower drought vulnerability—with the proviso that these policies are effectively implemented.
Despite having surplus supplies, Johor should also consider policies minimising water loss from supply and conveyance, particularly in view of scarcity during recent severe drought spells. Clearing of forests in water catchments for farming activities potentially increases water loss via reducing surface and sub-surface storage capacities, and has been previously linked to water level decreases in local reservoirs [72–74]. Further, non-revenue water (NRW) is reportedly widespread in Johor [65, 75]. Although ranked third lowest among Malaysian states, Johor's NRW in 2016 is ~26% compared to Singapore's ~5% [44, 76]. As such, a combination of land-use management within catchments, and enhancements in water infrastructure and oversight against NRW could potentially reduce overall water supply loss and lower drought vulnerabilities.
Johor's larger per-capita water use relative to Singapore suggests that its demand-side management policies have potential for improvement [77]. Policy focus could shift from the supply-side towards reducing consumer demand through e.g. water pricing considerations, mandatory water conservation requirements, and societal engagement campaigns increasing awareness of water scarcity. If effectively implemented, these policies can complement supply-side initiatives to reduce Johor's drought vulnerability.
Improving overall local water governance to drought risks has transboundary benefits to Johor and Singapore. Supply disruptions arising from droughts can be reduced, likely diffusing potential political tensions between the two states as they have historically. With continued supply surpluses, Johor can continue selling water to Singapore beyond the expiration of the current agreement in 2061 if politically expedient to both parties. Singapore has made known its desire to extend the agreement, even with a higher water price [78]. Revenues generated from its sale, can in turn, be used to enhance water governance resilience in Johor.
Lastly, assessing drought risk and future drought vulnerability must also consider climate change impacts on temperature and precipitation baselines in Southeast Asia. While El Niño potentially influenced recent drought extremes, increasing global temperatures and variable precipitation regimes associated with climate change in this region could also be factors heightening hazard risk through changes in drought frequency and intensity in the region as summarised in [1].
6. Summary and conclusion
Presently, clear variations in trans-boundary drought vulnerabilities between Singapore and Johor exist despite similar levels of exposure. Based on archival analysis, differences in vulnerability largely stems from variations in regional adaptive capacities. Both Singapore and Johor have historically, with varying success, applied different techniques and approaches over the short- and long-term in managing water resources with respect to drought risk. Discussing these present demand- and supply-side approaches reveals several ways in which reduction of local drought risk can be effected. A concern, which is beyond the scope of this study, is how stakeholders in each region should consider projected changes in drought intensity and frequency from global climate change, and how likely increases in future drought exposure will affect concomitant risk profiles for Singapore and Johor, as well as possibly increase potential strains in political relationships between these countries on this transboundary water resource management issue.
Acknowledgments
This research was directly supported by a NUS Research Grant R-603-000-214-490 (PI: WTLC). We acknowledge useful comments from Dr. Alan Ziegler and Dr. Robert Wasson during the development of this paper. Helpful suggestions from the editor and two anonymous reviewers towards improving this paper are also acknowledged.