

Abstract
In the past, human migrations have been associated with climate change. As our civilizations developed, humans depended less on the environment, in particular on climate, because technological and economic development in the span of human history allowed us to adapt to and overcome environmental discomfort. Asian Russia (east of the Urals to the Pacific) is known to be sparsely populated. The population is concentrated along the forest-steppe in the south, with its comfortable climate and thriving agriculture on fertile soils. We use current and predicted climate scenarios to evaluate the climate comfort of various landscapes to determine the potential for human settlers throughout the 21st century. Climate change scenarios are taken from 20 CMIP5 general circulation models. Two CO2 Representative Concentration Pathway scenarios, RCP 2.6 representing mild climate change and RCP 8.5 representing more extreme changes, are applied to the large subcontinental territory of Asian Russia. The ensemble January and July temperature anomaly means and annual precipitation are calculated with respect to the baseline 1961–1990 climate. Three climate indices, which are important for human livelihood and well-being, are calculated based on January and July temperatures and annual precipitation: Ecological Landscape Potential, winter severity, and permafrost coverage. Climates predicted by the 2080s over Asian Russia would be much warmer and milder. Ensemble means do not show extreme aridity. The permafrost zone is predicted to significantly shift to the northeast. Ecological Landscape Potential would increase 1–2 categories from 'low' to 'relatively high' which would result in a higher capacity for population density across Asian Russia. Socio-economic processes and policy choices will compel the development that will lead to attracting people to migrate throughout the century. Therefore, understanding ecological landscape potential is crucial information for developing viable strategies for long-term economic and social development in preparation for climate migration and strategic adaptation planning.
Export citation and abstract BibTeX RIS

Original content from this work may be used under the terms of the Creative Commons Attribution 3.0 licence. Any further distribution of this work must maintain attribution to the author(s) and the title of the work, journal citation and DOI.
1. Introduction and investigation basis
In the few last decades, the interconnected topics of climate change and related human migration have become quite urgent amongst both scientific and public communities. In prehistoric times, humans were fully dependent on the environment and climate (Gumilev 1989, Bassin 2009). Humans settled on suitable lands, where their survival and food security were strongly based on the ecological potential of a land. In an earlier study, we showed that alternations in climate resulted in or heightened the subsequent replacement of human cultures: settled farming with better crops in wetter periods versus nomadic cattle herding in dryer periods in south-central Siberia (Blyakharchuk et al 2014).
In contemporary times, human societies and economics also depend on agriculture and livestock as well, yet humans have learned to control and manage both of these in hostile and altered climates. Economic and technologic developments, currently dubbed 'the armor of civilization' (Prokhorov 2010) or 'homeostatic goods' (Parker and Tavassoli 2000, Van de Vliert 2007), have allowed humans to be relatively independent of their environs. Climate and landscape change is evident across landscapes and has been identified as urgent by the scientific community. Over the last decades, the scientific community has been motivated to suggest mitigation strategies and search for the potential benefits that could result from warming in the twenty first century. The IPCC analyzed the interacting environmental and social consequences of ongoing and future climate change to assess the potential for climate migration. They concluded 'climate migration' is amongst the most important missions for humankind to resolve (IPCC 2013). Climate migrations occur in areas at risks due to: inland storms (winds, tornados); water scarcity (droughts, crop failure, wildfires); or coastal flooding caused by sea level rise and tropical hurricanes, etc. (UNDP Human Development Report 2009, Milan et al 2015, Foresight: Migration and Global Environmental Change 2011). Consequently, in this work we examine the potential for lands that could benefit from climate warming, and these landscapes could become attractive and viable for climate migrants. Scientific predictions of environmental change are essential for developing strategies for long-term economic planning and social development in preparation for human migration, as well as well-being and prosperity. Piguet et al (2013) analyzed the extensive consequences induced by climate-change that could result in a large global migration exodus. Moreover, Groisman et al (2017) and Anisimov (2017) produced a critical review that analyzed climate change effects across ecosystems from the deserts through the taiga to the Arctic that included permafrost, disturbance, ice and snow, the hydrological cycle, and the biosphere across northern Eurasia. Additionally, this extensive review questioned the effect of these interactive changes on socio-economic conditions over northern Eurasia and suggested our next steps forward.
Ecological potential of a landscape (ecopotential) or the ability to quantify ecological resources based on climatic variables is founded in natural science classics (Dokouchaev and Sibirtzev 1893, Clements 1907, Gleason 1925, Sukachev and Dylis 1964, Holdridge 1947, Tansley, 1947, Grigoriev and Budyko 1956, Whittaker 1972, Budyko 1974, Mirkin 1987, Odum 1954, Isachenko 2003). Life is based on a food web structure, where 'primary producers' have the ability to convert abiotic energy (e.g. light, heat) into organic compounds that other heterotrophs (animals, fungi, bacteria) can consume. The basis for human sustainability and development is on lands ecological resources, primarily climatic resources: light, heat, and water. The ecological potential of a landscape is characterized by proportions of available energy (e.g. light, heat) and water. Vegetation types serve as indicators of ecopotential, which manifest themselves in a wide range of annual productivity: 1 t ha−1 in the tundra, 10–14 t ha−1 in forests and steppe, decreasing to less than 1 t ha−1 in arid ecosystems (Whittaker 1972).
In this investigation, we employ the 'ecological landscape potential (ELP)' conceived by a Russian geographer, Isachenko (2003). He quantitatively derived a landscapes capacity to support human settlements across a landscape. First, ELP serves as the measure of heat and water resources that is capable of supporting particular vegetation types.
Secondly, food growing potential or capacity is another component for measuring human wellbeing and potential activity, especially in sparsely populated areas such as northern Asian Russia. Phytoproductivity supports a specific population density, thus relating the population density to ELP. Lastly, Isachenko related a variety of ELPs to the population densities across the USSR and derived a relationship, which resulted in seven categories from the highest population densities (60.6) to very low (0.9) and extremely low (0.02) people per square km. Thus, ELP is considered an ecological resource indicator of a land's capacity to sustain human society and develop. Isachenko concluded a one category change in ELP can result in a 3-fold change in the population density.
Here, we employ two additional environmental factors that are used to evaluate humans' climate comfort and well-being: winter severity (accumulated negative degree-days) and permafrost (presence/absence). We assume that water resources are not a limiting factor for the human population across steppe-to-forest landscapes in northern Asian Russia, beyond semi-desert and desert landscapes. These classic ecosystem classification schemes have demonstrated their usefulness and are valuable for evaluating suitable landscape conditions and the capacity to sustain climate-based migrations.
Earlier, the first regional classification of human living conditions based on climate severity and comfort was used in the 1930s in the former USSR, with the main goal being to compensate harsh living conditions with additional official salary (Zabolotnik 2010). The Nazarevskii (1985) isoline maps of equal living conditions ('isovitea') are well known by Russia social-economic geographers. Zolotokrylin et al (1992), Vinogradova et al (2008) and Zolotokrylin et al (2012) zoned Russia into seven zones from 'absolutely unfavorable' to 'favorable' to 'most favorable' for living conditions. The 'most comfortable' conditions are located along the west of the Great Russian Plain and the Ciscaucasia in the south.
The two best zones ('most favorable' and 'favorable') are not currently available in Siberia and the Far East, with the exception of a couple small areas in the southernmost reaches of Siberia. Vinogradova et al (2008) concluded that the settlement of lands should begin en masse only with 'relatively unfavorable' conditions followed by 'relatively favorable' conditions but such settlements would require large economic costs and motivation.
Despite the importance and urgency of modeling and predicting human well-being and living conditions in a climate that is rapidly changing across Asian Russia, such research is limited. Vinogradova (2011), Vinogradova and Zolotokrylin (2014), Zolotokrylin et al (2018a, 2018b) used three moderate General Circulation Models (GCMs) from the Coupled Model Intercomparison Project phase 5 (CMIP5) (IPCC AR5 2013) to investigate the potential consequences of climate warming on living conditions in eight Federal districts across Russia. They found that across Russia as a whole, favorable living conditions would increase in a warmer climate. Here, we applied three basic climate variables to determine warmth, cold, permafrost, and water availability to characterize landscape resources in Asian Russia.
Our goal was to evaluate the ecological landscape potential and winter climate conditions (climate severity and permafrost distribution) and their change in the context of climate comfort and severity to assess human sustainability, well-being and food security over the vast territory of Asian Russia, as climate changes in the 21st century.
2. Methods
Our study area is Asian Russia, the Russian territory in Asia running east of the Urals to the Pacific (figure 1) and consisting of three major physical geographical sectors, West Siberia, East Siberia, and the Far East, which accounts for 77% (13 million square kilometers) of Russia.
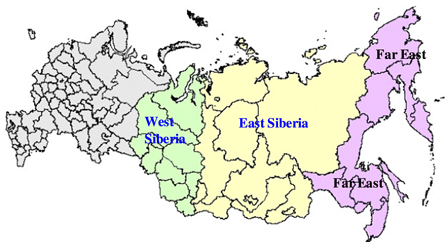
Figure 1. Asian Russia from the Ural mountains to the Pacific (within the window 60°–180° E and 48–72 °N) and its four major physical geographical divisions: West Siberia, East Siberia and Far East.
Download figure:
Standard image High-resolution imageThirty-nine million people currently live in Asian Russia, which accounts for 27% of the Russian 2017 population (Rosstat 2017). This is a vast territory, characterized by various climates from productive agricultural lands in favorable climates over the plains and intermountain basins in southern Siberia to the extreme cold climates on the Yakutian uplands in northeastern Siberia. Cities of Oimyakon and Verkhoyansk of Yakutia have recorded the coldest Northern Hemisphere temperatures on Earth and are known as the 'Pole of Cold'. Permafrost (continuous, discontinuous, sporadic, etc) covers some 80% of Asian Russia.
Isachenko's (2003) Ecological Landscape Potential, ELP, is a product of the sum of positive temperatures above 10 °C, TS10, (similar to Growing Degree-Days, GDD, in English literature) divided by 100 for convenience and multiplied by Ivanov's moisture index (MI, Ivanov 1941), which is described further below:

If MI is equal to or greater than 1, this equates to a moist climate; and when MI is less than 1, this equates to a dry to arid climate, which decreases the ELP (table 1). See for details to calculate MI in supplementary methods 1.
Table 1. Ecological Landscape Potential (ELP) and related characteristics (Isachenko 2003).
| ELP | Population density | Landscapes |
|---|---|---|
| 1. Highest >20 | 60.6 | Front-subtropical northern Caucasian broad-leaved forests; pre-Caucasian broad-leaved forests and steppe; southern European broad-leaved, sub-taiga forests and forest-steppe |
| 2. Fairly high 16–20 | 22.1 | Eastern European Sub-taiga; western Siberian forest-steppe; eastern European typical steppe; western Siberian southern taiga |
| 3. Medium 12–16 | 6.6 | Middle taiga (without central Yakutia); central Siberian southern taiga, western Siberian typical steppe; eastern European dry steppe |
| 4. Low 8–12 | 2.4 | Northern taiga (without eastern Siberian); central Yakutian middle taiga; Siberian dry steppe; Semi-desert |
| 5. Very low <8 | 0.9 | Eastern Siberian northern taiga; Sub-Arctic (forest-tundra) and tundra); Desert |
| 6. Extremely low ∼0 | 0.02 | Arctic |
| 7. Irregular 0–20 | 1.2 | High mountains |
To characterize climate severity, we used two indices: (1) Climate Severity, CS; and (2) permafrost presence/absence, as characterized by Zabolotnik (2010). CS is a sum of all negative monthly temperatures over the year (table 2, Negative Degree-Days, NDD, used in the western literature).
Table 2. Climate Severity (CS) conditions for humans evaluated by Negative Degree-Days (NDD) over Siberia by Zabolotnik (2010).
| Climate severity/comfort | Negative degree-days, <0 °С |
|---|---|
| 1. Fairly favorable | >–1250 |
| 2. Moderately favorable | –1251 to –2500 |
| 3. Unfavorable | –2501 to –3750 |
| 4. Severe | –3751 to –5000 |
| 5. Extreme | –5001 to –6250 |
| 6. Absolutely extreme | <–6251 |
We developed simple linear regressions to approximate TSt>10 and TS<0 from January and July monthly temperatures confirmed by good statistics (R2 = 0.87) and (R2 = 0.96) correspondingly (see table 1 supplementary methods). We used data from 100 weather stations (Reference books on climate of the USSR (1967–1971) that widely represented physical geography and climates across Asian Russia (from less continental in West Siberia to extremely continental in Yakutia and monsoon climate in Far East).
Additionally, we approximated negative (TSt<0) and positive (TSt.>10, t>5) temperature sums using sine functions built on min (January) and max (July) mean monthly temperatures. Results of TSt>10 and TSt<0 calculations using sine functions and linear regression models were close (table 1 supplementary methods).
Thus, both TSt>10 and TS<0 approximated by min and max monthly temperatures adequately stood for TSt>10 and TSt<0 calculated from the observed daily temperature data calculated by a routine climatological method (Reference books on climate of the USSR (1967–1971)).
In calculating the permafrost border position we followed Nelson (1986) and Anisimov and Nelson (1997) who found that permafrost indices could be accurately calculated using temperatures of the warmest and coolest months and annual precipitation. First, we found a good correspondence between the 2 m thaw depth (the active layer) distribution on our map (figure 4 left) and the southern continuous and discontinuous permafrost borders (Kotlyakov and Khromova 2002). Using the kappa statistics method (Monserud and Leemans 1992) we compared two maps: (1) the ALD of 2 m border (2) the continuous/discontinuous permafrost border. We found that the overall agreement between these two maps was a 'very good' match (kappa 0.71) according to qualitative descriptors of Monserud and Leemans (1992). Then, we used the 2 m active layer depth (ALD) as a proxy of the discontinuous permafrost border.
We derived the ALDs from the map of Malevsky-Malevich et al (2001) for the Siberian window (100–140 °E and 56–75 °N), digitized and rasterized it. We correlated 7.6 million pixels from this map (0.01° of a resolution) with three maps of climatic indices: GDDt>5, DD<0 and annual precipitation, cm, by the MULTIREG procedure of the TerrSet GIS-program which resulted in a multiple regression model (see for details figures 3 and 4 and explanations in supplementary methods):
Using this regression we modeled the 2 m ALD over Asian Russia.
In our previous bioclimatic modeling studies we accepted permafrost border position as that of an Active Layer Depth of 2 m (ALD, depth of seasonal thaw) that was necessary for all trees but Larix daurica to grow on soils underlain by permafrost (Tchebakova et al 1993, Tchebakova et al 2009, Tchebakova et al 2010a, 2010b, 2016). We correlated the current ALD of 2 m outlined in the Malevsky-Malevich et al (2001) map to three climatic indices: Negative Degree-Days and Growing Degree-Days, base 5 °C calculated from January and July mean temperatures respectively and annual precipitation. The future permafrost border distribution was modeled by using a simplified equation based on Stefan's theoretical formula (Dostovalov and Kudryavtsev 1967):

where the symbol 1 stands for current climate and symbol 2 stands for the future climate. When the future ALD is calculated, the permafrost border associated with ALD = 2 m is outlined.
To interpolate and map climate variables: January and July temperatures and annual precipitation in the baseline climate (1961–1990) data were taken respectively from 860 and 1060 weather stations across Asian Russia (figure 5 supplementary methods). Coastal and island stations are characterized by maritime climates. February may be the coldest month in some places along the coast. We employed only interior continental stations and avoided coastal stations in our analysis (see for details in discussion supplementary). Each station was characterized by Lon, Lat and Elevation a.s.l. We used the ANUSPLIN software (Xu and Hutchinson 2013) with installed DEM (Lon, Lat and Elevation) in order to interpolate the three climate variables, including elevation lapse rates at a regular 0.25° resolution grid to produce climate surfaces.
We concentrated on the 2070–2099 period (the mid of this period is the 2080s), that is, the end of the 21st century. First, we calculated January and July monthly means from daily values and annual precipitation sums for each year for both the historical period (1961–1990) and 2070–2099 period for each CMIP5 GCM for both the mild warm RCP 2.6 and the extreme RCP 8.5 scenarios. Second, we calculated the 30 year mean of January and July temperatures and the annual precipitation for each GCM for both scenarios. Third, we found differences between future GCMs and historical values of January and July temperatures and annual precipitation for each GCM to get their anomalies. Future January and July temperatures and annual precipitation are calculated by summing anomalies to the contemporary climate to produce the resultant 2080s temperature and precipitation maps for each GCM which are then averaged for 20 GCMs by summing all images of each climate variable to obtain ensembles anomalies means. Finally, the ensemble means for 20 GCMs were calculated for both scenarios. These mild and extreme scenarios equate to an overall radiative forcing of 2.6 and 8.5 Wm−2 by 2100, respectively.
Based on the above climate variables, ELP, Climate Severity, and the 2 m ALD (the discontinuous permafrost border position) were calculated and their distributions were mapped for both the contemporary and 2080 climates.
3. Results
Ongoing climate change derived from a 50 year time series of January and July temperatures across Asian Russia showed temporal temperature trends (figure 6 supplementary results): winter anomalies were largest at high latitudes, particularly north of the Polar circle (∼66.5 °N latitude); in contrast, summer anomalies are largest at lower latitudes (See for more details in supplementary results).
In the 2080s, January and July temperature anomalies over Asian Russia derived from the 20 CMIP5 GCMs and their ensemble means for the warm RCP 2.6 and elevated 8.5 scenarios are shown in figure 7 supplementary results).
In the future all anomalies are positive, however the smallest and largest values differ by 3–4 fold for both January and July temperatures and for both the RCP 2.6 and RCP 8.5 scenarios. The January ensemble anomaly means are substantially warmer at 3.5 °C (RCP 2.6) and 9 °C (RCP 8.5) compared to the July ensemble anomaly means. In the harsh RCP 8.5 scenario, temperature anomalies varied between 4 °C and 6 °C (e.g. models GISS E2 R, CSIRO) and 10 °C–12 °C (e.g. models GFDL, MRI MR, HadGEM, Miroc).
The July ensemble anomaly means also show warming, 2 °C (RCP 2.6) and 5.7 °C (RCP 8.5), even though summer temperature anomalies are predicted to be 2-fold less than those in the mid-winter. The harsh RCP 8.5 scenario summer temperature anomalies varied between 3 °C and 4 °C (e.g. model—GISS E2 R, GISS E2 H, GFDL) and 8 °C–9 °C (e.g. model—CanESM2, NorESM).
Annual precipitation anomalies varied between 50 and 100 mm in the mild RCP 2.6 scenario and between 80 to over 200 mm in the harsh RCP 8.5 scenario. The ensemble means differed by about 2.5 fold in these scenarios (figure 3 suppl. is available online at stacks.iop.org/ERL/14/065004/mmedia).
Spatial distribution of January and July temperature and annual precipitation ensemble anomaly means in the 2080 RCP 2.6 and 8.5 climates are shown in figure 2.
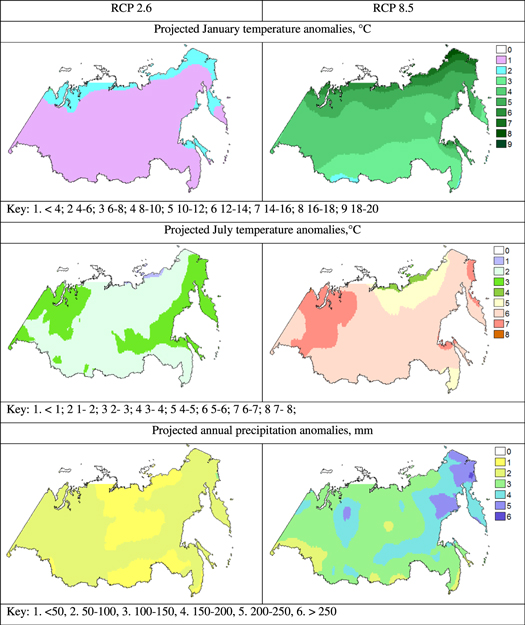
Figure 2. January and July (middle) temperature and annual precipitation (lower) anomaly means derived from 20 GCMs CMIP5 for the 2080s RCP 2.6 (left column) and RCP 8.5 (right column) climates.
Download figure:
Standard image High-resolution imageJanuary anomalies are found to be larger in the north and smaller in the south. The July temperature anomalies have more of an east–west delineation, with the largest anomalies in West Siberia and along the eastern coast of the Far East. Predicted 2080 RCP 8.5 precipitation anomalies show a mosaic pattern, with the largest increases being 150–250 mm along the eastern coast and a portion of the Central Siberian Plateau (figure 2). In the 2080 RCP 2.6 scenario, precipitation anomalies also show a mosaic pattern and are predicted less than 100 mm, with highs in a completely different region. This highlights the complicated nature of precipitation predictions.
Shown in figures 3 through 6 are the bioclimatic indices that are vitally important for human sustainability (Climate Severity, Permafrost Presence, and Ecological Landscape Potential), which are calculated using January and July temperatures and annual precipitation for both the contemporary and 2080 future climate (RCP 2.6 and RCP 8.5) across Asian Russia.
Climate severity categorized as 'extreme', 'severe', and 'unfavorable', prevailing presently on 80% of Asian Russia, is predicted to become milder as 'fairly favorable' and 'moderately favorable' on over 40% of the area and would remain 'severe' and 'unfavorable' on only 38% of the area in the warm 2080s RCP 8.5 (figure 3).

Figure 3. The climate severity distribution in contemporary and the 2080 s RCP 2.6 and RCP 8.5 climates over Asian Russia. Key: 1. Fairly favorable; 2. Moderately favorable; 3. Unfavorable; 4. Severe; 5. Extreme; 6. Absolutely extreme.
Download figure:
Standard image High-resolution imageWe calculated permafrost (<2 m ALD) coverage from as much as 65% of the area presently, which is contrasted with the 57.5% coverage calculated based on the mild scenario (RCP 2.6) and 40% based on the elevated scenario (RCP 8.5) in the warmer 2080 s (figure 4).

Figure 4. The permafrost (<2m-ALD) and permafrost-free (>2m-ALD) distributions in contemporary (left) and the 2080s RCP 2.6 (center) and RCP 8.5 (right) climates over Asian Russia. Key: 0—beyond the study area, 1—Permafrost; 2. Permafrost-to-permafrost-free transition by the 2080 s; 3. Permafrost-free.
Download figure:
Standard image High-resolution imageAs stated above, ELP determines regional human life conditions and economic capability based on food security, which is directly related to crop yields. The prevailing ELP categories that relate human life comfort in the current climate are 'low' and 'very low' over 85% in Asian Russia (figure 5).
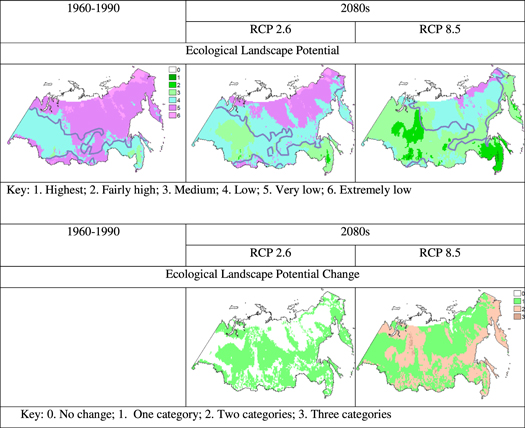
Figure 5. Ecological landscape potential distributions and its change in contemporary (1960–1990) and the 2080s RCP 2.6 and RCP 8.5 warmed climates over Asian Russia. The blue lines are the current and predicted permafrost borders.
Download figure:
Standard image High-resolution imageLife conditions would improve to 'medium' and 'fairly high' categories over >50% of the total area in the warmer 2080 RCP 8.5 climate scenario. In the 2080 RCP 2.6 climate scenario, ELP life conditions would remain 'low' and 'very low' over 70% of the area and would improve to 'medium' conditions in 15% of the area.
By the 2080s, ELP would improve at least one category in the RCP 2.6 climate over most of the territory and up to 3 categories in the 2080 s RCP 8.5 climate compared to the contemporary climate (figure 5). Given the relationship of Isachenko (2003), relating population density to ELP (table 1), we argue that in the future, the capacity of an ecological niche for humans may increase 3–9 fold, depending on if the climate is favorable for population density expansion in particular Siberian areas. Based on the RCP 2.6 scenario, ELP increases of one category, population densities could increase from 0.9 to 2.4 people per square km in East and Central Siberia and along the northern coastal Far East including the Kamchatka Peninsula and Sakhalin Island and from 2.4 to 6.6 in West Siberia and the southern Far East. Based on the RCP 8.5 scenario, ELP increases of 1–2 categories could result in population density increases from 0.9 to 2.4 people per square km in West and south-central Siberia and northern East Siberia and from 2.4 to 22.1 in central West and the border of west-central East Siberia and the coastal Far East including the Kamchatka Peninsula and Sakhalin Island.
Table 3. Ecological landscape potential and climate severity distributions, which characterize climate comfort and sustainability (% of total area).
|
Cross-sections of ELP and CS show areas of prevailing conditions for both contemporary and future 2080 climates (table 3, areas > 5% of the total study area are circled).
Table 4. ELP temperature ranges and corresponding crops across Asian Russia.
| Ecological landscape potential, temperature Sums>10, °C | Crop |
|---|---|
| 1. Highest > 2000 | Maize (grain), Rice, soya bean, grape, apricot depending on wintering conditions |
| 2. Fairly high 1600–2000 | Sunflower (seed), Maize (silage and grain) |
| 3. Medium 1200–1600 | Spring wheat, winter wheat, oats, maize (silage) |
| 4. Low 800–1200 | Barley (early/medium ripe), pea (early ripe), oat (early-ripe) |
| 5. Very low < 800 | Some root vegetables, cabbage using special land cultivation |
| 6. Extremely low ∼0 | — |
Climate severity is predicted to deteriorate and climates would become milder under both scenarios in comparison to the contemporary climate. Lands with harsh 'extreme', 'severe' and 'unfavorable' conditions cover 80% of the land presently and would respectively transform into lands with more comfortable categories. Depending on the scenario mild or elevated, lands with harsh conditions ('extreme', 'severe' and 'not favorable') are predicted to decrease in area to 38% and 58% by the 2080. Good conditions 'moderately favorable' are predicted to reign over 26% of lands in the RCP 2.6 climate, and the 'fairly favorable' category would cease to exist across the landscape. In the RCP 8.5 climate, the 'fairly favorable' category would emerge and represent 12% of Asian Russia. When combined with the 20% 'moderately favorable' category, this would represent one third of Asian Russia, as a hospitable place to live (table 3).
Figure 6 shows the spatial relationship between climate severity and ELP for both the contemporary and future 2080 climate scenarios. The permafrost border was also superimposed over the ELP and CS maps (figure 6).

Figure 6. Ecological Landscape Potential, Climate Severity and Permafrost Superimposed in contemporary (1960–1990) and the 2080s RCP 2.6 and RCP 8.5 warmed climates over Asian Russia. Blue line is the permafrost border. Key. See the Legend for all combinations between ELP and Climate Severity.
Download figure:
Standard image High-resolution image
Together, ELP along with CS are indicative of human sustainability and comfort, and these are also directly related to a landscapes crop production capability. Here, we combined the ELP categories (table 1) with known ELP crop potential temperature ranges for Asian Russia (table 4), based on TS10 (Sinitsyna et al 1973).
The permafrost-free zone is currently in line with low ELP, allowing only crops that ripen quickly to grow (barley, oats, pea). Only in the southernmost reaches of West Siberia and the Far East is there potential for growth for wheat, winter wheat, oats, and maize (silage) crops, with a medium ELP rating. In the warmer RCP 2.6 and especially RCP 8.5 2080 climates, low and medium ELPs begin to cross the permafrost border creating suitable environments for a higher agricultural potential yield inside the permafrost zone (figures 5–6). However, wintering conditions and permafrost, which controls soil formation, could limit agricultural potential on poorly developed soils, regardless of the generally warmer climates.
4. Discussion
We are faced with a multitude of challenges in this new era of the Anthropocene, and as peoples, we must face the realization that we are mere interrelated inhabitants of this integral Earth system on which we depend. Socioeconomic, cultural, political, environmental health concerns and climate change may force us to cross borders and flee our native lands (e.g. initially storms, flooding, drought, lack of food, increased and novel diseases).
Here, we focus only on human mobility 'potential', a potential that will be forced by the environmental consequences of ongoing climate change, as opposed to other resultant climate-related hazards (e.g. weather motivated events). Here we take an alternative direction by using climate ensemble scenarios to demonstrate the Ecological Landscape Potential (ELP) for climatically-suitable, habitable landscapes across the currently largely uninhabitable Asian Russian landscapes.
For half a century, from 1961 to 2010, climates in Siberia have been warming to varying degrees and in some regions more than predicted (Soja et al 2007, Tchebakova et al 2011 See more in discussion suppl. 1).
According to the twenty GCM climate ensemble results, climate will become milder and warmer across Asian Russia by the 2080 s particularly in the winter. Asian Russia will not be water limited in a warmer climate, except in some areas in the extreme south (Groisman et al 2018). In the 1990s, there were broad discussions in Russia on transferring Siberian river runoff to Central Asia. This project was rejected because of potential catastrophic ecological consequences to the environment. Moreover, the project was extremely costly. Recently, in the 2010s this issue to divert river runoff from the Altai area to the bordering dry areas in China arose again. and a final decision has yet to be taken.
Each of the indices, used to measure human life sustainability and comfort, is associated with some degree of uncertainty. First, model differences and associated uncertainty exist between GCM outcomes that are unique to modeling centers. Choosing a GCM that adequately corresponds to reality is still a problem. It has been shown that several GCMs ensemble means emulate reality better than choosing one particular GCM (Anisimov 2007, Govorkova et al 2008, Miao et al 2014, Anisimov and Kokorev 2017). Therefore, we followed the prevalent approach to apply ensemble means to smooth GCM outcomes and extremes. All GCMs showed positive temperature and precipitation trends over our study area from the Ural Mountains to the Pacific (60–180 E; 50–72 N); but the variation of each climate variable could be large for both the area and within one GCM.
The ELP values calculated using predicted climate variables inherit the same uncertainties. Presently, ELP is favorable for human sustainability in the forest-steppe and mixed needle-broad-leaved forests in Siberia. This is also the case and also in the southern portion of the Far East, where ELP is 'fairly high', which is currently associated with the highest ecosystem productivity and population density. This ELP state is a result of the long-term development of a landscape under stable climate conditions, following biospheric and geospheric landscape development (vegetation, soil) in sync with an equilibrium climate (energy, temperature, and water). Our predicted future ELP distribution results, which favor higher ELP categories in a warmer climate, may not be quickly realized due to the time necessary for inertial soil development, which follows climate change but is not directly in sync with climate change. In other words, there could be a delay in ecosystem-biospheric response, and there could be an opportunity for planned mitigation and adaptation strategies in these regions (e.g. plants or decomposers that fix nutrients).
Nevertheless, in accordance with the regularity found by Isachenko (2003), the ELP capacity would increase spatially and quantitatively, by 3–9 fold on average across Asian Russia by the end of the century. Currently, the average population density is 3 people per square kilometer, varying from 10 in the favorable forest-steppe zone to 0.02 along the coastal Arctic across Asian Russia.
Based on ongoing climate change and these favorable ELP predictions, one can expect a positive migration to Asian Russia. In contrast, sociologists and economists predict a slight population decrease or immigration from Asian Russia, based on current statistical population mobility analyses (Heleniak 1999, 2008, 2012, Vishnevsky 2000). This is one of the reasons this work is critical, both to incite the conversation and to highlight the potential for landscape transformations with changes in climate, which will increase the appeal of Asian Russia.
The Greek philosopher and scientist Aristotle formulated his thesis 'Natura abhorret vacuum'—Nature abhors a vacuum, which is demonstrated by natural laws: e.g. matter flows from areas of high pressure to low pressure and concentration. Laws of human society demonstrate that population flows towards settlements with a greater population density: from countryside to towns to cities to megapolises, where resources and stimulation are easier to attain. Moreover, some sociologists (Vishnevsky 2000) predict a decrease in the total and working populations in Russia (lower birth rates, fewer working and more older populations) by the 2050s. They even raised the idea of 'substitution' or 'replacement' immigration for several million people to offset current population losses. In support of Vishnevsky (2000), Manakov and Suvorkov (2018) predicted that the population of Russia would decrease to 83.6–120.3 million people, compared to current 146 million people, by the end of the century. Russian population is currently decreasing and this general population decrease may also help to account for the absence an 'eastward trend' in population mobility.
There are also uncertainties in the relationship between ELP and the population density identified by Isachenko (2003). He employed population data for the 1970–1980s. Some researchers conclude these population data are not representative of a cold environment. Mikhailova (2004, 2009, 2011) demonstrated that the current population density was due to targeted Soviet economic policy planning. Her approach was based on average monthly temperature per capita. Under this assessment, eastern regions, even poorly populated regions, appeared to be 13–16 million overpopulated. This fact adversely effected the Soviet economy during the transition period to market economy (Hill and Gaddy 2003). Based on Heleniak (1999) and Mikhailova (2004), using current migration rates that include earlier westward migrations from Russian, eastern regions would need 200 years to bring the population distribution into a natural equilibrium with the environment. While we agree population density in Siberia and the Far East, under Soviet policy, was higher than a climatic balance or desirability would mandate, nonetheless, we still argue, the climate is and will change in Siberia and the Far East, which will increase appeal and the possibility for human sustainability in these regions.
It should be noted that researchers (Klimenko et al 2012, 2001) and columnists (Parshev 2006) have been skeptical concerning the ≪cost-effectiveness≫ of settling lands under unfavorable environmental and climatic conditions. Presently, the cost to establish the infrastructure necessary to sustain the population is comparable to or higher than that for industries in other regions. However, our research highlights more favorable future conditions for use in social, political, mitigation and adaptation planning. The policy-makers may consider attracting new investments into developing both industrial and living infrastructure on potentially suitable lands in order to finally sustain the population and thus attain cost benefits in a predicted warmed climate and an improved environment for human settlers.
In the warmer mild RCP 2.6 and particularly in the extreme RCP 8.5 2080 climate scenarios, suitable ELP environments are predicted that would result in a higher agricultural potential inside the permafrost zone.
In our study, we found that the permafrost boundary separated low values of Ecological Landscape Potential (ELP) and large negative sums of the Climate Severity Index in the permafrost zone (figure 6). This led us to conclude that the permafrost zone is not currently attractive for human settlements, which resulted in low population density. However, after the permafrost retreats, environments may likely sustain the human habitability in a warmer climate. But the transition from permafrost to non-permafrost (a uncertain active layer thickness) would be hard for people because of losing sustainable infrastructure (houses, roads, etc). Presently, the infrastructure on permafrost is failing due to permafrost degraded (Hjort et al 2018, Romanovsky et al 2017, Shiklomanov et al 2017). Only under an established equilibrium between a warmer climate and active layer may one consider a sustainable life—on permafrost or beyond permafrost (see more in discussion supplementary).
Wintering conditions and permafrost that control soil formation conditions would still limit the agricultural potential on poorly developed and cold soils, regardless of the generally warmer climates. Crop industries would likely become more successful in general, but the most successful and productive landscapes will still be on the developed arable lands that are presently in use, lands that are predicted to improve by 1–2 ELP categories in a warmer future. Taking into account the predicted warmer climate in Asian Russia, a positive feedback to human life sustainability and comfort should be expected. As a result, the aforementioned westward migration trend may partially or fully be replaced by an eastward 8 migration by the end of the century. Thus, the higher population density patterns would be in equilibrium with an improved environment.
Connecting ecology (climate and soil geography) to economic geography (reasonable income, population density) and psycho-social expectations (feeling of happiness and life satisfaction) is to be the next step to develop for Asian Russia (Frijters and Van Praag 1998).
5. Conclusions
There is a scientific consensus that the Earth will warm over the coming decades. In fact, warming is already evident across the circumboreal-arctic zone, and in some regions, warming has already exceeded earlier 2090 estimates (Soja et al 2007). Our options are to: (1) ignore the science and face the social, economic, and political consequences that will ensue; or (2) formulate a strategic mitigation and adaptation plan for the future based on the best-available sound science, as opposed to reactionary actions. Here we present one assessment of a scientific result that is worthy of highlighting and then using these results as a basis for planning a direction forward. Above all, we argue for increased critical scientific assessments and collaborations that acknowledge our Earth is changing and emphasize the magnitude of our current choices. Major conclusions of this work follow:
- New climate change assessments derived from 20 CMIP5 GCM indicate increases in January and July temperatures and precipitation over Asian Russia. Specifically these include: increases of 3.4 °C (RCP 2.6) to 9.1 °C (RCP 8.5) in mid-winter; increases of 1.9 °C (RCP 2.6) to 5.7 °C (RCP 8.5) in mid- summer; and increases of 60 mm (RCP 2.6) to 140 mm (RCP 8.5). Additionally, the CMIP5 model simulations show Asian Russia would be characterized by a milder climate, with less permafrost coverage, decreasing from the contemporary 65% to 40% (RCP 8.5) of the area by the 2080 s.
- Compared to the contemporary climate, Ecological Landscape Potential (ELP) for human sustainability and comfort would improve in greater than 50% of the total area under the warmer 2080s RCP 8.5 climate. By the 2080s, under the RCP 2.6 climate, living conditions are predicted to remain low over 70% of the area and would improve on 15% of the area. Severe climates, which currently prevail on 80% of the area, are predicted to become milder and favorable on over 40% of the area in a warmer 2080.
- The correlation between ELP and population density shows that the improvement in ELP by one category favors an increase in the population of 3-fold (Isachenko 2003). We found that ELP would increase from 1 (RCP 2.6) to 2 (RCP 8.5) categories over most of Asian Russia, which could lead to a 5 to 7 fold increase in the capacity of the territory to sustain and become attractive to human populations, which would then lead to migrations from less sustainable lands to Asian Russia during this century.
- In a future warmer climate, food security, in terms of crop distribution and production capability, is predicted to become more favorable for people to support settlements in what is currently an extremely cold Asian Russia. However, suitable land development is dependent on the socio-political-economic policies undertaken by authorities. Lands with developed infrastructure and high agricultural potential would obviously be populated first. Vast intact Siberia and the Far East have poorly developed infrastructure. The rapidity by which these developments occur is dependent on investments in infrastructure and agriculture, which is dependent on the decisions that will be made in the near future.
Acknowledgments
The study was supported by the Russian Foundation for Basic Science, grant 16-05-00496 and the Northern Eurasia Future Initiative. The authors are grateful to our colleagues and friends Bob Monserud, Eugene Shvetsov and Jane Bradford for their help to prepare a revised version of the article.