

Abstract
Due to catastrophic desiccation, today's Aral Sea consists of a few separate residual basins, characterized by different ecological conditions (the Large Aral, Lake Tshchebas, the Small Aral). This study is the first report on dissolved methane concentrations in these basins. Overall, 48 water samples were obtained and analyzed for methane content. High values of dissolved methane in the anaerobic layer of the Large Aral Sea, including the Chernyshev Bay, are apparently caused by damping of vertical mixing and decomposition of abundant organic matter in anoxic conditions. The estimated methane flux from the surface of the Large Aral Sea is actually higher than that from many other lakes in the world. For the anoxic layer of the Large Aral, certain relations between distributions of methane and other hydrochemical parameters, including dissolved oxygen and hydrogen sulfide, were found. In the brackish Small Aral Sea, methane content was moderate. Lake Tshchebas exhibits intermediate conditions between the Large and the Small Aral seas in terms of salinity and methane concentration. The observed differences of methane content and distributions in separate residual basins are linked with the differences of their mixing and oxygenation regimes.
Export citation and abstract BibTeX RIS

Original content from this work may be used under the terms of the Creative Commons Attribution 3.0 licence. Any further distribution of this work must maintain attribution to the author(s) and the title of the work, journal citation and DOI.
1. Introduction
In the mid-20th century, the Aral Sea, an endorheic brackish lake in the Central Asia, was the World's fourth largest inland water body by area. Since then, catastrophic desiccation, which was mostly anthropogenic, has resulted in shrinking of the lake by over 90% in volume. In consequence, the physical and chemical conditions, as well as biological communities of the Aral Sea changed drastically. These changes have been described elsewhere, e.g. (Zavialov 2005). Moreover, the lake has split into a few separate residual water bodies, namely, the Large Aral Sea, the Small Aral Sea, and Lake Tshchebas (see figure 1). The diverging water budget conditions of the residual basins (restriction of river flow) led to the formation of a new hydrological structure of waters specific to each reservoir. These changes caused differences in the physical, chemical and biological properties of each basin. The available in situ data are very scarce. However, yearly monitoring surveys of the Aral Sea were carried out by the Shirshov Institute of Oceanology, Russian Academy of Sciences, since 2002 (Zavialov et al 2003; see also Zavialov 2005, Izhitskiy et al 2014a, 2016). The residual basins (except the Small Aral Sea) are characterized by extremely high salinity, especially in the lower layers. Such density stratification conditions damped vertical mixing process in the lake and caused anoxia in the bottom layers (Zavialov 2005). At the same time, the upper layers are rich in zooplankton and organic matter (Mirabdullaev et al 2004, Arashkevich et al 2009). This combination results in sulfide contamination of the lower portion of the water column. Hydrogen sulfide (H2S) was first detected in the bottom layer of the Large Aral Sea in 2002 (Zavialov et al 2003, Friedrich and Oberhänsli 2004). As known, H2S in anoxic waters is often accompanied by methane. Methane production is the last step in sequential degradation of organic matter in anaerobic conditions (e.g. Breck 1974, Kiene 1991). Thus, methane is an important indicator of biogeochemical processes in natural water environments. Besides, methane is one of the most significant greenhouse gases in the atmosphere of the Earth due to its infrared absorption spectrum (Cicerone and Oremland 1988, Conrad 2009). Investigations of methane fluctuations and budget in the atmosphere include studies of methane emission from water objects. Interactions between methane fluxes to the atmosphere and climate changes represent particular interest (Walter et al 2006, Isaksen et al 2011, Tan and Zhuang 2015, Northington and Saros 2016). However, in the case of the Aral Sea, no data was published about measurements of dissolved methane content in waters of the lake. This paper is the first report on methane in the today's Aral Sea. The objective of the present study was to evaluate dissolved methane concentration in different parts of the Aral Sea and to identify factors that may influence dissolved methane content in the lake.
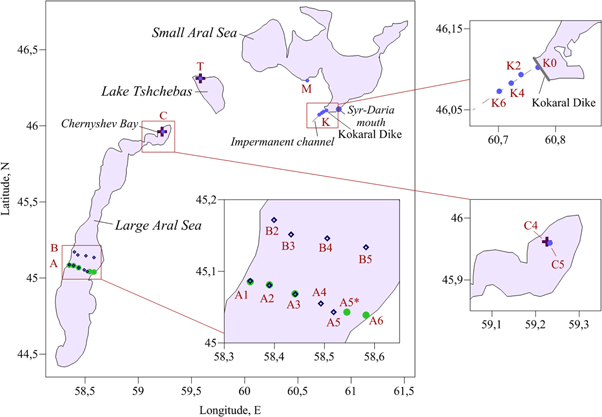
Figure 1. Locations of water sampling stations in residual basins of the Aral Sea in 2012–2016. Green circles are stations occupied in 2012, rhombi are those occupied in 2013, crosses are those occupied in 2015, blue circles are those occupied in 2016.
Download figure:
Standard image High-resolution image2. Data and methods
2.1. Study site
The Aral Sea in 1960 was a brackish (about 10 g/kg) lake with an area of 66 000 km2 and volume of 1066 km3 (Bortnik and Chistyaeva 1990). During the desiccation, the sea split into the Large Aral Sea in the south and the Small Aral Sea in the north by the end of the 1980s. By the mid 1990s, the Large Aral Sea itself divided into the shallow Eastern and relatively deep Western basins, initially connected through a strait which then reduced to a narrow channel and intermittently vanished and reappeared. Lake Tshchebas separated from the Large Aral in 2004. By 2010 the Eastern basin has almost dried up because the flow of the Amu-Darya River did not reach the basin (Zavialov et al 2012). Thus, the present Sea consists of the Small Aral, Lake Tshchebas, and the Large Aral, including the former Chernyshev Bay, which has almost separated from the western Large Aral and formed an individual residual lake. The approximate bathymetric maps of the basins are shown in figure S1 (available online: stacks.iop.org/ERL/14/065005/mmedia). The dataset used in the present study includes dissolved methane concentration data from all of the residual basins of the Aral Sea (figure 1), exhibiting significantly different hydrophysical conditions. The Large Aral Sea is characterized by extremely high values of salinity (115–122 g kg−1 in its central part, according to the data of 2014 (Izhitskiy et al 2016), and 120–240 g kg−1 in the Chernyshev Bay, according to the data obtained by the authors in 2015), while river inflows hardly reach the basin. At the same time, salinity of the Small Aral Sea was as low as about 11 g kg−1 in 2014 (Izhitskiy et al 2016). The ecosystem of the basin has recovered due to the building of the Kokaral Dam which essentially trapped Syr-Daria River discharge in the Small Sea. Lake Tshchebas is located between the Large Aral and the Small Aral, its water budget strongly depends on occasional water releases through the dam. The current salinity of Lake Tshchebas is about 92 g kg−1 as of 2014 (Izhitskiy et al 2016). Before the onset of desiccation, Aral Sea water already had a rather peculiar salt composition, which was quite different from that of the ocean water, as well as many other saline seas. The contemporary desiccation has led to significant additional alteration of the chemical composition (Zavialov and Ni 2010). The first data of CH4 (surface concentrations and vertical profiles) were collected in the central part of the Large Aral in September 2012. Then, sampling continued in the same area in October 2013, when water samples were taken at four stations. Methane content at surface and vertical distribution of dissolved methane concentration were then studied in the Chernyshev Bay of the Large Aral Sea in October 2015 and June 2016. Surface samples were collected in Lake Tshchebas in October 2015 and September 2016. Surface methane concentration in the Small Aral Sea was analyzed based on the samples collected in the southern part of the basin, just upstream of the Kokaral Dam and at the distances of 2000, 4000 and 6000 m downstream of the dam in September 2016. Overall, 48 water samples were obtained in the residual lakes of the Aral Sea and analyzed for methane content.
2.2. Water sampling and measurements
Water samples were collected by a bucket from the surface layer and by 5-l Niskin bottle from the bulk of the water column. The samples were placed into 30 ml glass flasks with a narrow neck. The sampling procedure was such that the flask was filled with water with overflow of one volume so that there were no air bubbles inside; gas phase was formed by displacement of water portion with special syringe. The flask was closed by a cap with a rubber insertion and stored in such a position that gas inside had no contact with the cap to avoid gas exchange between the sample and the atmospheric air. Phase equilibrium degasation (the so-called headspace analysis) of the samples was performed in laboratory through the technique described in (Bolshakov and Egorov 1988). Methane concentrations were then determined by injecting 0.5 ml of headspace gas into gas chromatograph HPM-2 equipped with a flame ionization detector. Average scatter on parallel measurements was about 4%.
Atmospheric equilibrium concentrations of methane in water were calculated from the equation suggested by (Wiesenburg and Guinasso 1979) using the temperature data and the values of salinity as determined through dry residue method by P N Makkaveev and A F Alukaeva (P P Shirshov Institute of Oceanology).
During the field studies in the Chernyshev Bay in 2015, dissolved oxygen was measured with AANDERAA Optode 3835 sensor. Phosphates, silicates, nitrates, nitrites were measured spectrophotometrically in several hours after sampling following (Bordovskiy and Chernyakova 1992).
Samples for hydrogen sulphide, alkalinity, dissolved inorganic carbon, main ions were analysed in the Norwegian Institute for Water Research (Oslo, Norway) in accordance to standard procedures (Grasshoff et al 1999).
During the sampling campaigns at all locations, the atmospheric conditions were moderate, with wind speed spanning between 1--5 m s−1. For the Large Aral, September 2012, the air temperature was between 20--22 °C, i.e. the same or about 2 °C higher than the lake surface temperature. And for the Large Aral, October 2013, the air temperature was 11–12 °C, i.e. the same as the water surface temperature.
2.3. Estimation of methane fluxes and total methane content
Methane flux from the water surface to the atmosphere was calculated for the Large Aral excluding Chernyshev Bay, and for the Chernyshev Bay separately from the equation (Scranton and Brewer 1977, Wanninkhof 1992):
where F is methane flux from the water surface to the atmosphere, Cs is methane concentration in surface waters, Ceq is methane concentration equilibrium with the atmospheric air, and K is the gas transfer coefficient exponentially depending on the wind speed (Wanninkhof 1992).
The total methane content for the basins was calculated from the equation:

where Ctot is the total methane content (nmol or Tg), Cai is the average methane concentration (nmol/m3 or Tg/m3) of the layer i, Vi is the volume (m3) of the layer i. The values of Vi were derived from the detailed bathymetry map of the basin. The layer thicknesses were determined based on the distance between sampling horizons, so the number of the layers selected varied for different field campaigns. The Cai was calculated as average value between methane concentrations at layer boundaries. The value of methane concentration at the deepest horizon was used as the Cai for the lower layer.
3. Results
3.1. Methane in surface waters of the Large Aral Sea
The values of methane concentration in the surface layer of the central part of the Large Aral Sea ranged from 37--47 nmol l−1 in September 2012, and from 124--234 nmol l−1 in October 2013 (figure 2(a)). The two profiles of 2013 were characterized by a decrease of methane content near the coasts.

Figure 2. (a) Surface distribution of dissolved methane in the central part of the Large Aral Sea (September 2012 and October 2013) and in the Chernyshev Bay (October 2015 and June 2016). (b) Vertical distribution of dissolved methane in the central part of the Large Aral Sea (September 2012 and October 2013) and in the Chernyshev Bay (October 2015 and June 2016). (c) Hydrochemical structure in the Chernyshev Bay in October 2015.
Download figure:
Standard image High-resolution image
3.2. Vertical distribution of dissolved CH4 in the Large Aral Sea
Vertical distribution of dissolved methane in the Large Aral is almost homogeneous from surface to 10–15 m (figure 2(b)). A considerable increase of methane saturation is registered below 15 m. CH4 concentration reaches its maximum value in the bottom layer, namely, about 7100 nmol l−1 at 36 m in 2012, nearly 12 800 nmol l−1 at 29 m, and slightly over 17 000 nmol l−1 at 31 m in 2013. In September 2012, the maximum of methane content was observed at 20 m.
The measurements of methane content in the Chernyshev Bay water column exhibited moderate values in the upper layer from the surface to the depth of 4 m (140–155 nmol l−1 in October 2015 and 130 nmol l−1 in June 2016), and steep rise of saturation to the bottom (78 000 nmol l−1 at 12 m in 2015, and over 147 000 nmol l−1 at 12.9 m in 2016) (figure 2(b)).
3.3. Methane in the surface waters of Lake Tshchebas and the Small Aral Sea
Dissolved methane concentration in surface layer near the northern coast of Lake Tshchebas was 23.2 nmol l−1 in October 2015 and 13.6 nmol l−1 in September 2016 (table S1).
According to the data obtained in the survey of September 2016, methane content in the surface waters of the Small Aral Sea is 34 nmol l−1 near its southern coast. Relatively high concentration of CH4 was registered at the Kokaral Dike just upstream of it (123 nmol l−1). At the same time, the values of methane concentration downstream of the dike were 20.6, 11.7 and 22.6 nmol l−1 at distance of 2000, 4000 and 6000 m, respectively.
3.4. Methane fluxes and the total methane content
Methane fluxes from the water surface to the atmosphere and the total methane content were calculated for the Large Aral excluding Chernyshev Bay according the data of 2012 and 2013, and for the Chernyshev Bay separately according the data of 2015 and 2016 (table 1).
Table 1. Surface methane flux and total methane content in the Large Aral Sea, the Chernyshev Bay and other basins.
| Surface methane flux | ||||||
|---|---|---|---|---|---|---|
| Water object | Tg/yr | μmol/(m2 * day) | CH4surface, nmol l−1 | Area, km2 | Total methane content, Tg | Source |
| Oceans | 10* | 4.7 | 2.5** | 361.26 · 106 | 43.2*** | *Cicerone and Oremland 1988, Houghton 1996 |
| **Scranton and Brewer 1977, Tilbrook and Karl 1995 | ||||||
| ***Reeburgh 2007. | ||||||
| Lake Crampton | 2 · 10−7 | 116.0 | 410 | 0.258 | Bastviken et al 2004 (flux values given in mg C/(m2 * yr) are converted into μmol CH4/(m2 * day) and Tg/yr) | |
| Lake Hummingbird | 6 · 10−9 | 135.2 | 680 | 0.008 | ||
| Lake North Gate | 2 · 10−9 | 141.1 | 340 | 0.003 | ||
| Lake Roach | 2 · 10−7 | 90.2 | 270 | 0.450 | ||
| Lake Ljustjärn | 9 · 10−8 | 113.0 | 470 | 0.130 | ||
| Lake Lovtjärn | 7 · 10−8 | 145.4 | 610 | 0.085 | ||
| Lake Gränsjön | 3 · 10−8 | 129.7 | 480 | 0.045 | ||
| Lake Grunnen | 3 · 10−7 | 124.0 | 460 | 0.480 | ||
| Lake Gyslättasjön | 2 · 10−7 | 104.8 | 380 | 0.263 | ||
| Lake Erie | 7 · 10−3 | 43.4 | 13 | 25 700 | Howard et al 1971 | |
| Lake N2-cont | 1 · 10−8 | 132.9 | 570 | 0.018 | Kling et al 1992 | |
| Lake 227 | 5 · 10−8 | 169.6 | 0.055 | Rudd and Hamilton 1978 | ||
| Lake Biwa | 1 · 10−3 | 269.6 | 70 | 674 | Miyajima et al 1997 | |
| Lake Constance | 1 · 10−4 | 39.5 | 12 | 540 | Schulz et al 2001 | |
| Lake Kasumigaura | 3 · 10−4 | 262.6 | 300 | 168 | Utsumi et al 1998 | |
| Black Sea | 422 000 | 96 | Reeburgh et al 1991, Kessler et al 2006 | |||
| Big Soda Lake | 3 · 10−7–4 · 10−7 | 31.4–41.2 | 1.46 | Iversen et al 1987 | ||
| Lake Kivu | 5 · 10−4 | 35.6 | 2322 | Borges et al 2011 | ||
| Kabuno Bay of Lake Kivu | 3 · 10−5 | 106.8 | 48 | |||
| Large Aral Sea excluding Chernyshev Bay (2012) | 2 · 10−4 | 9.8 | 42 | 3881 | 9 · 10−4 | Present study |
| Large Aral Sea excluding Chernyshev Bay (2013) | 3 · 10−3 | 133.8 | 187 | 3836 | 2 · 10−3 | |
| Chernyshev Bay of the Large Aral Sea (2015) | 9 · 10−5 | 111.1 | 155 | 140 | 3 · 10−4 | |
| Chernyshev Bay of the Large Aral Sea (2016) | 8 · 10−5 | 92.6 | 130 | 139 | 5 · 10−4 | |
4. Discussion
4.1. Methane in surface waters of the Large Aral Sea
The atmospheric equilibrium concentration of methane in the surface layer of the Large Aral Sea, as calculated from the equation proposed by (Wiesenburg and Guinasso 1979), was about 1.2 nmol l−1 in September 2012, and October 2013. At the same time, the factually measured values of methane content exceeded these values by a factor of 37–210.
It is important to note that methane saturation in the central part of the Large Aral Sea in 2013 was 3–5 times higher than the values of 2012. The Large Aral Sea is inhabited with brine shrimp Artemia parthenogenetica which has been the dominant zooplankton species since the late 1990s. Artemia population generally increased: its abundance grew from only a few individuals per m3 in 1998 to 1260 in m3 in 2006, while the biomass grew from 0.2 g m−3 in 2000 to 2.9 g m−3 in 2008 (Mirabdullaev et al 2004, Arashkevich et al 2009, Zavialov et al 2012). Anaerobic microenvironments such as fecal pellets of zooplankton and sinking particulate matter are considered to be a potential source of methane in aerobic waters (Scranton and Brewer 1977, Burke et al 1983, Boone 2000, Reeburgh 2007). Hypothetically, these biological conditions may have resulted in the increase of methane concentration in time. Moreover, methane concentration in surface waters of the Large Aral appears to be related with high methane content in the lower layer, as described in more detail below. Even if values of the vertical eddy diffusion coefficient are low at the boundary of aerobic and anaerobic waters, a large difference in methane concentrations between the layers can provide a sufficiently high flux from the lower layers to the upper ones. According to the data of vertical temperature profiles (figure S2) (Izhitskiy et al 2014b), it can be assumed that in October 2013 the thickness of the upper mixed layer was greater than in September 2012. More intensive water mixing could lead to increase of the vertical transfer of dissolved methane from the anaerobic layer to the aerobic one.
The spatial patterns of surface methane distribution in 2012 and 2013 were also different. In 2012, horizontal distribution of methane content was relatively homogeneous across the Large Sea. However, the distribution of 2013 demonstrates a decrease of methane concentration towards the coasts. No obvious correlation between methane content and other hydrochemical indicators (Makkaveev et al 2018), except dissolved oxygen, was found in the surface layer of the basin for the period of 2012–2013. Comparing methane content in 2012 and 2013, it is important to consider the influence of the seasonal fluctuation of concentrations. We can only indirectly estimate the scale of seasonal variability based on methane content in the Chernyshev Bay (the part of the Large Aral Sea). The difference between the values of CH4 in October 2015 and June 2016 in the bay is less than the difference between the values in September 2012 and October 2013 in the Large Aral Sea (figure 2(a)). Therefore, we suppose that the interannual variability of the methane content in this case may be higher than potential fluctuations of the autumn months.
4.2. Vertical distribution of dissolved CH4 in the Large Aral Sea
Vertical distribution of dissolved methane observed in the central part of the Large Aral and in the Chernyshev Bay is typical for lakes and reservoirs with presence of anoxic layer (Yakushev et al 2006), where high concentrations of methane are observed in sulfidic zone. Methanogenesis process can start when the other electron acceptors (i.e. dissolved oxygen, nitrate, manganese and iron oxides) are depleted. Methane concentration in the bottom layer of the central part of the Large Aral in 2012 and 2013 are three orders of magnitude higher than those at the surface. It is an important finding of the implemented survey. Such a high increase of dissolved methane content in the lower layer of the Large Aral suggests that decomposition of organic matter is very intensive in this layer and other electron acceptors are used up. According to the hydrophysical data obtained in September 2012, an abrupt thermocline was located at the depth of 11–12 m (figure S2). At the same time, oxygen concentration decreased from the surface to 20 m (Makkaveev et al 2018). The described vertical structure along with high biomass of zooplankton provides conditions favorable for methanogenic bacteria, which are obligate anaerobes. In addition, the vertical distribution of hydrochemical parameters in Chernyshev Bay, considered below, illustrates the anaerobic decomposition of organic matter, including denitrification and sulfate reduction. Thus, it is likely that decomposition of organic matter causes pronounced increase of methane concentration in anoxic layer of the Large Aral Sea.
Similar vertical gradients of methane concentration in this region were observed in October 2013 (figure 2(b)), accompanied by oxygen (O2) concentration decrease from the surface down to 20 m depth, and hydrogen sulfide (H2S) content increase from 20 m horizon down to the bottom (Makkaveev et al 2018). The methane profile of 2013 manifested exponential growth in the lower layer, while one year earlier, a peak of dissolved methane was detected at the depth of 20 m (figure 2(b)). In 2013, methane concentration was two times higher than the bottom value in 2012. Judging by the shape of these vertical profiles, we hypothesize that there is no transport of methane through bubbling in this case. However, it should be noted that the shape of the methane profile depends not only on the location of the gas sources and sinks, but also on the turbulent diffusion coefficient of methane. Thus, the presence of methane bubbling in the Aral Sea requires additional verification.
Methane concentrations in the lower layer of the central part of the Large Aral Sea are close to those characteristic for the Black Sea, which is the largest methane reservoir on the planet (Lein and Ivanov 2005). Maximum dissolved methane content in the anaerobic layer of the Black Sea amount to 12 000 nmol l−1 (Reeburgh et al 1991, Wakeham et al 2003, 2004). However, concentrations of CH4 registered in the lower layer of the Chernyshev Bay, which is considered below, are an order of magnitude higher than the values typical for the Black Sea.
The data obtained in October 2015, allow analysis of the details of vertical biogeochemical structure of the Chernyshev Bay waters (figure 2(c)). In the hyperhaline bottom layer, a sulfidic zone was formed separated from the upper layer by an extremely strong halocline. The origin of this halocline is hypothetically related to the inflow of the heavy high salinity water formed in summer in the shallower part of the Aral Sea to the bottom layer of the deeper part of the sea through a strait between the eastern and the western basins (Zavialov 2005). Described process of dense water advection to the bottom layer of the western basin through the Chernyshev Bay was held on at least untill 2014, when the complete schrinkage of the estern basin had occurred.
The vertical distributions of the main ions (figure 2(c)) show clear difference in concentrations in the surface and the bottom layers with an increase of sodium (Na) from 8 g l−1 to 15 g l−1, magnesium (Mg) from 2 g l−1 to 3 g l−1, sulfate (SO4) from 5 g/l to 15 g l−1, chloride (Cl) from 15 to 20 g l−1 and less pronounced increase of the total inorganic carbon (∑CO2) from 0.09 to 0.12 g l−1 that is correlated with an increase in salinity (from 130 to 240 g kg−1). The distribution of calcium (Ca) was characterized by an opposite distribution with lower concentrations in the bottom layer (0.05 g l−1) compared with the surface one (0.10 g l−1). The latter fact can be indicative of ongoing precipitation of the calcium carbonate in the bottom layer or in the shallow part of the Aral Sea where this water mass can have originated from. Our data demonstrate also that the ratios between the main ions (in molar concentrations) differ for cations: Ca:Mg:Na = 0.007:0.24:1 in the surface layer and Ca:Mg:Na = 0.002:0.18:1 in the bottom layer and for anions: ∑CO2:SO4:Cl = 0.004:0.47:1 in the surface layer and ∑CO2:SO4:Cl = 0.004:0.90:1 in the bottom layer. The data of vertical profiles of the ions, along with hydrophysical parameters, are an additional illustration of the bright difference in conditions between the aerobic and anaerobic water layers.
Decomposition of organic matter under suboxic and anoxic conditions is implemented by several chemical reactions, such as denitrification and sulphate reduction. Besides, reactions of interaction of reduced and oxidized forms of different elements takes place through chemical and microbiological pathways.
Investigation of hydrochemical structure in the Chernyshev Bay in October 2015, revealed typical features of the anaerobic basins (Yakushev et al 2007). The upper mixed layer occupying the top three meters was characterized by uniform temperature and high oxygen concentrations at about 300 μM. Below, there was a marked increase in temperature from 12--27 °C and a decrease of oxygen concentration to zero. In general, the concentrations of phosphates, nitrates and silicates in the surface layer were low, which may point on intensive photosynthesis. Nitrates vanished in the oxygenized zone, while, at the lower limit of nitrate maximum, there was a peak of nitrites.
The appearance of hydrogen sulfide was registered from the depth of 7 m. Thus, a suboxic layer existed between the depths of 4 m--7 m, with the absence of measurable concentrations of both oxygen and hydrogen sulfide. In this layer, as in other anaerobic basins, an increase in the content of phosphates and silicates (up to 10 and 180 μM, respectively) occurred from the depth of oxygen removal. As for the Black Sea, the increase of methane can also be seen here. Phosphates were characterized by a maximum under the hydrogen sulfide border typical for anaerobic basins.
Therefore, high methane saturation observed in the modern Aral Sea appears to be the result of formation of anaerobic conditions and organic matter decay. Bottom content of methane in the Chernyshev Bay in October 2015 is four times higher than bottom value of the central part of the Large Aral in October 2013. The maximum concentration detected in the residual basins of the Aral Sea was registered in the bottom layer of the Chernyshev Bay in June 2016. This value exceeded bottom methane concentration in the Chernyshev Bay in October 2015, by a factor of two. The surface methane content exceeded the equilibrium with the atmosphere value by a factor of 146 in October 2015, and by a factor of 125 in June 2016, which is comparable to the similar figures for the central part of the basin. The investigation also revealed a significant growth of CH4 concentration below 4 m depth (figure 2(c)). Thus, the presence of vertical stratification is accompanied by the highest methane concentrations and could be considered as the most important factor for methane distribution in the residual basins.
4.3. Methane in the surface waters of Lake Tshchebas and the Small Aral Sea
Atmospheric equilibrium methane content in the surface layer of Lake Tshchebas, calculated from the equation suggested by (Wiesenburg and Guinasso 1979), was 2 nmol l−1 for the conditions of October 2015, while the factually observed concentration exceeded it by a factor of 12. The value of concentration observed in September 2016 is slightly lower than that a year before. At the same time, surface methane content in Lake Tshchebas was 2–10 times lower than that in the Large Aral Sea. Episodic water releases through the Kokaral Dike appear to be the major factor affecting biochemical characteristics of the Tshchebas.
An approximate estimate shows that surface methane content in the Small Aral Sea exceeds atmospheric equilibrium value by a factor of 13 for the southern part of the basin, and by a factor of 48 for the area near the Kokaral Dike. It is important to note that the dam is located near to the delta area of the Syr-Daria River. The water discharged through the dam forms an impermanent flow downstream of the dam, where methane content significantly decreases. Water stagnation just upstream of the dam may result in the development of organic matter reduction in anaerobic microenvironments and sediments and, hence, leads to an increase of CH4 concentration (Martens and Goldhaber 1978, Capone and Kiene 1988, Romankevich and Vetrov 1997, Vinogradov et al 2000, Lasareva et al 2017).
4.4. Methane fluxes and total methane content
The estimated methane flux from the surface of the Large Aral was about 10 μmol/m2/day in 2012 and about 134 μmol/m2/day in 2013. These values are actually higher than those for many other lakes (table 1), including the meromictic Lake Kivu with its Kabuno Bay (table 1). African Lake Kivu is known for its high methane content (up to 0.02 mol l−1) in the monimolimnion, the deep layer whose mixing with the upper water mass is greatly reduced (Findenegg 1935). The concentrations of methane and carbon dioxide are monitored in the lake for potential danger of catastrophic overturn which would release large volumes of the gases to the atmosphere (Schmid et al 2003, 2005, Descy et al 2012, Katsev et al 2017). It is well known that limnic eruptions in lakes Monoun and Nyos have resulted in catastrophic consequences including human life loss and mortality of animals (Kling et al 1987, Sigurdsson et al 1987). In comparison with other lakes exhibiting similar values of the surface methane flux per unit area, the total methane flux from the entire surface of the Aral Sea is higher due to the relatively large area of the lake (table 1).
The values of the CH4 emission from the Chernyshev Bay were estimated at 111 μmol/m2/day in 2015 and 93 μmol/m2/day in 2016. The total content of methane in the Large Aral Sea was about 9 · 10−4 Tg in 2012 and about 2 · 10−3 Tg in 2013, while that in the Chernyshev Bay it was about 3 · 10−4 Tg in 2015 and about 5 · 10−4 Tg in 2016 (table 1).
5. Conclusions
The study yielded the first data on the methane content in water of the residual basins of the Aral Sea. Significant differences of methane concentrations and variability in different parts of the former Aral Sea emphasize sharp distinction between ecological conditions in the basins formed during the ongoing desiccation. The observed differences of methane content and distributions in separate residual basins are linked with the differences of their mixing and oxygenation regimes.
High values of dissolved methane in the anaerobic layer of the Large Aral Sea, including the Chernyshev Bay, are likely to be caused by damping of vertical mixing and decomposition of organic matter in anoxic conditions. In turn, large amounts of methane accumulated in the lower layers eventually supplies the dissolved gas to the upper aerobic zone. No obvious correlation between concentrations of methane and other hydrochemical indicators was found in the aerobic layer. However, for the anoxic layer of the Large Aral Sea, certain relations between distributions of methane and other hydrochemical parameters, such as oxygen, hydrogen sulfide, phosphates, silicates, nitrates, and nitrites were found. Content of methane was small in the oxygenated layer and increased in a similar way as silicate and phosphate in sulfidic zone.
In the Small Aral Sea, methane content was moderate, with maximum values registered near the Kokaral Dike and the Syr-Daria mouth. Excess methane content over equilibrium with the atmospheric air in the aerobic waters of the Small Aral is apparently related to organic matter decay in anaerobic microenvironments and upper part of sediments. Lake Tshchebas exhibits intermediate conditions between the Large Aral Sea and the Small Aral Sea in terms of salinity and methane concentration.
Acknowledgments
The laboratory analyses and data processing part of the study were supported by the Ministry of Education and Science of Russia [theme No.0149-2018-0002 and agreement No.14.W03.31-0006].
The contributions of EY were supported by Norwegian Research Council [SkatteFUNN project 272749 'Aquatic Modeling Tools'].
The data on the reported values of dissolved methane concentrations can be obtained in supporting information.
Declarations of interest:
None. ESI, POZ, EVY and ASI collected the data. ESI, AVE and EVY conducted the laboratory analysis. ESI and EVY wrote the manuscript. AVE and POZ modified the manuscript. All the authors reviewed and approved the manuscript.